
 Login Sign Up


| |||||
 |  | ||||

| 12Stocks.com Market Intelligence |
Best MidCap Stocks
|
| In a hurry? Mid Cap Stocks Lists: Performance Trends Table, Stock Charts
Sort midcap stocks: Daily, Weekly, Year-to-Date, Market Cap & Trends. Filter midcap stocks list by sector: Show all, Tech, Finance, Energy, Staples, Retail, Industrial, Materials, Utilities and HealthCare Filter midcap stocks list by size:All MidCap Large Mid-Range Small |
| 12Stocks.com Mid Cap Stocks Performances & Trends Daily | |||||||||
|
|  The overall Smart Investing & Trading Score is 31 (0-bearish to 100-bullish) which puts Mid Cap index in short term bearish to neutral trend. The Smart Investing & Trading Score from previous trading session is 36 and a deterioration of trend continues.
| ||||||||
Here are the Smart Investing & Trading Scores of the most requested mid cap stocks at 12Stocks.com (click stock name for detailed review):
|


| 12Stocks.com: Top Performing Mid Cap Index Stocks | ||||||||||||||||||||||||||||||||||||||||||||||||
 The top performing Mid Cap Index stocks year to date are
Now, more recently, over last week, the top performing Mid Cap Index stocks on the move are


|
||||||||||||||||||||||||||||||||||||||||||||||||
| 12Stocks.com: Investing in Midcap Index with Stocks | |
|
The following table helps investors and traders sort through current performance and trends (as measured by Smart Investing & Trading Score) of various
stocks in the Midcap Index. Quick View: Move mouse or cursor over stock symbol (ticker) to view short-term technical chart and over stock name to view long term chart. Click on  to add stock symbol to your watchlist and to add stock symbol to your watchlist and  to view watchlist. Click on any ticker or stock name for detailed market intelligence report for that stock. to view watchlist. Click on any ticker or stock name for detailed market intelligence report for that stock. |
12Stocks.com Performance of Stocks in Midcap Index
| Ticker | Stock Name | Watchlist | Category | Recent Price | Smart Investing & Trading Score | Change % | YTD Change% |
| HIG | Hartford Financial |   | Financials | 97.30 | 38 | -0.49% | 21.05% |
| IAC | IAC/InterActiveCorp | | Technology | 47.90 | 0 | -0.60% | -8.55% |
| TTWO | Take-Two Interactive | | Technology | 145.30 | 10 | -1.34% | -9.72% |
| MKTX | MarketAxess | | Financials | 204.94 | 0 | -3.78% | -30.02% |
| MKL | Markel | | Financials | 1427.07 | 0 | -0.38% | 0.50% |
| ACGL | Arch Capital | | Financials | 89.76 | 33 | -0.24% | 20.86% |
| VMC | Vulcan Materials | | Industrials | 260.47 | 26 | -0.88% | 14.74% |
| XYL | Xylem | | Industrials | 127.29 | 51 | -0.64% | 11.31% |
| IFF | Flavors | | Materials | 82.59 | 36 | -1.22% | 2.00% |
| DPZ | Domino s | | Services & Goods | 488.02 | 36 | -1.47% | 18.39% |
| LH | Laboratory | | Health Care | 203.32 | 0 | -1.17% | -10.55% |
| TDOC | Teladoc Health | | Technology | 13.55 | 15 | -4.64% | -37.12% |
| LEN | Lennar | | Industrials | 156.12 | 34 | -2.36% | 4.75% |
| EVRG | Evergy | | Utilities | 50.39 | 23 | -2.08% | -3.47% |
| WAT | Waters | | Health Care | 319.59 | 13 | -0.95% | -2.93% |
| OMC | Omnicom | | Services & Goods | 90.55 | 23 | -0.04% | 4.67% |
| CRWD | CrowdStrike | | Technology | 299.50 | 26 | -3.09% | 17.30% |
| CCL | Carnival | | Services & Goods | 14.06 | 0 | -2.09% | -24.16% |
| LDOS | Leidos | | Technology | 124.88 | 31 | -0.68% | 15.37% |
| TOST | Toast | | Technology | 22.50 | 31 | -5.54% | 22.88% |
| RYAN | Ryan Specialty | | Financials | 49.52 | 36 | -0.86% | 15.03% |
| EPAM | EPAM | | Technology | 254.81 | 0 | -1.68% | -14.30% |
| ZBRA | Zebra Technologies | | Technology | 283.00 | 36 | -2.31% | 3.54% |
| TRU | TransUnion | | Services & Goods | 71.88 | 31 | -2.30% | 4.61% |
| ATO | Atmos Energy | | Utilities | 113.06 | 10 | -0.82% | -2.45% |
| For chart view version of above stock list: Chart View ➞ 0 - 25 , 25 - 50 , 50 - 75 , 75 - 100 , 100 - 125 , 125 - 150 , 150 - 175 , 175 - 200 , 200 - 225 , 225 - 250 , 250 - 275 , 275 - 300 , 300 - 325 , 325 - 350 , 350 - 375 , 375 - 400 , 400 - 425 , 425 - 450 , 450 - 475 , 475 - 500 , 500 - 525 , 525 - 550 , 550 - 575 , 575 - 600 , 600 - 625 , 625 - 650 , 650 - 675 , 675 - 700 , 700 - 725 , 725 - 750 , 750 - 775 | ||
 | Click To Change The Sort Order: By Market Cap or Company Size Performance: Year-to-date, Week and Day |  |
|
Get the most comprehensive stock market coverage daily at 12Stocks.com ➞ Best Stocks Today ➞ Best Stocks Weekly ➞ Best Stocks Year-to-Date ➞ Best Stocks Trends ➞  Best Stocks Today 12Stocks.com Best Nasdaq Stocks ➞ Best S&P 500 Stocks ➞ Best Tech Stocks ➞ Best Biotech Stocks ➞ |
| Detailed Overview of Midcap Stocks |
| Midcap Technical Overview, Leaders & Laggards, Top Midcap ETF Funds & Detailed Midcap Stocks List, Charts, Trends & More |
| Midcap: Technical Analysis, Trends & YTD Performance | |
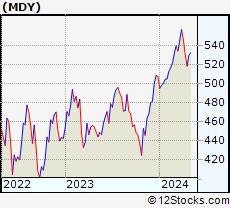
| MidCap segment as represented by
MDY, an exchange-traded fund [ETF], holds basket of about four hundred midcap stocks from across all major sectors of the US stock market. The midcap index (contains stocks like Green Mountain Coffee Roasters and Tractor Supply Company) is up by 3.3% and is currently underperforming the overall market by -2.04% year-to-date. Below is a quick view of technical charts and trends: | |
 MDY Weekly Chart |
|
| Long Term Trend: Good | |
| Medium Term Trend: Not Good | |
 MDY Daily Chart |
|
| Short Term Trend: Not Good | |
| Overall Trend Score: 31 | |
| YTD Performance: 3.3% | |
| **Trend Scores & Views Are Only For Educational Purposes And Not For Investing | |
| 12Stocks.com: Investing in Midcap Index using Exchange Traded Funds | |
|
The following table shows list of key exchange traded funds (ETF) that
help investors track Midcap index. The following list also includes leveraged ETF funds that track twice or thrice the daily returns of Midcap indices. Short or inverse ETF funds move in the opposite direction to the index they track and are useful during market pullbacks or during bear markets. Quick View: Move mouse or cursor over ETF symbol (ticker) to view short-term technical chart and over ETF name to view long term chart. Click on ticker or stock name for detailed view. Click on to add stock symbol to your watchlist and to view watchlist. |
12Stocks.com List of ETFs that track Midcap Index
| Ticker | ETF Name | Watchlist | Recent Price | Smart Investing & Trading Score | Change % | Week % | Year-to-date % |
| IJH | iShares Core S&P Mid-Cap | | 57.26 | 31 | -1.09 | -1.09 | 3.3% |
| IWR | iShares Russell Mid-Cap | | 79.60 | 31 | -1.27 | -1.27 | 2.41% |
| IWP | iShares Russell Mid-Cap Growth | | 108.16 | 26 | -1.53 | -1.53 | 3.54% |
| IWS | iShares Russell Mid-Cap Value | | 118.57 | 31 | -1.10 | -1.1 | 1.96% |
| MDY | SPDR S&P MidCap 400 ETF | | 524.10 | 31 | -1.10 | -1.1 | 3.3% |
| IJK | iShares S&P Mid-Cap 400 Growth | | 86.46 | 31 | -1.17 | -1.17 | 9.14% |
| IJJ | iShares S&P Mid-Cap 400 Value | | 110.58 | 13 | -1.26 | -1.26 | -3.03% |
| MYY | ProShares Short MidCap400 | | 20.91 | 64 | 1.01 | 1.01 | -2.54% |
| XMLV | PowerShares S&P MidCap Low Volatil ETF | | 53.76 | 36 | -0.90 | -0.9 | 1.09% |
| UMDD | ProShares UltraPro MidCap400 | | 23.44 | 31 | -3.03 | -3.03 | 5.02% |
| SMDD | ProShares UltraPro Short MidCap400 | | 12.09 | 64 | 2.92 | 2.92 | -10.18% |
| MZZ | ProShares UltraShort MidCap400 | | 11.91 | 34 | 2.67 | 2.67 | -5.26% |
| MVV | ProShares Ultra MidCap400 | | 61.69 | 36 | -0.06 | -0.06 | 6.56% |
| 12Stocks.com: Charts, Trends, Fundamental Data and Performances of MidCap Stocks | |
|
We now take in-depth look at all MidCap stocks including charts, multi-period performances and overall trends (as measured by Smart Investing & Trading Score). One can sort MidCap stocks (click link to choose) by Daily, Weekly and by Year-to-Date performances. Also, one can sort by size of the company or by market capitalization. |
| Select Your Default Chart Type: | |||||
| |||||
| Click on stock symbol or name for detailed view. Click on to add stock symbol to your watchlist and to view watchlist. Quick View: Move mouse or cursor over "Daily" to quickly view daily technical stock chart and over "Weekly" to view weekly technical stock chart. | |||||

 | HIG The Hartford Financial Services Group, Inc. |
| Sector: Financials | |
| SubSector: Property & Casualty Insurance | |
| MarketCap: 12582.8 Millions | |
| Recent Price: 97.30 Smart Investing & Trading Score: 38 | |
| Day Percent Change: -0.49% Day Change: -0.48 | |
| Week Change: -0.49% Year-to-date Change: 21.1% | |
| HIG Links: Profile News Message Board | |
| Charts:- Daily , Weekly | |
| Add HIG to Watchlist: View: Get Complete HIG Trend Analysis ➞ | |
 | IAC IAC/InterActiveCorp |
| Sector: Technology | |
| SubSector: Internet Information Providers | |
| MarketCap: 12561.2 Millions | |
| Recent Price: 47.90 Smart Investing & Trading Score: 0 | |
| Day Percent Change: -0.60% Day Change: -0.29 | |
| Week Change: -0.6% Year-to-date Change: -8.6% | |
| IAC Links: Profile News Message Board | |
| Charts:- Daily , Weekly | |
| Add IAC to Watchlist: View: Get Complete IAC Trend Analysis ➞ | |
 | TTWO Take-Two Interactive Software, Inc. |
| Sector: Technology | |
| SubSector: Multimedia & Graphics Software | |
| MarketCap: 12479.6 Millions | |
| Recent Price: 145.30 Smart Investing & Trading Score: 10 | |
| Day Percent Change: -1.34% Day Change: -1.97 | |
| Week Change: -1.34% Year-to-date Change: -9.7% | |
| TTWO Links: Profile News Message Board | |
| Charts:- Daily , Weekly | |
| Add TTWO to Watchlist: View: Get Complete TTWO Trend Analysis ➞ | |
 | MKTX MarketAxess Holdings Inc. |
| Sector: Financials | |
| SubSector: Investment Brokerage - National | |
| MarketCap: 12431.5 Millions | |
| Recent Price: 204.94 Smart Investing & Trading Score: 0 | |
| Day Percent Change: -3.78% Day Change: -8.06 | |
| Week Change: -3.78% Year-to-date Change: -30.0% | |
| MKTX Links: Profile News Message Board | |
| Charts:- Daily , Weekly | |
| Add MKTX to Watchlist: View: Get Complete MKTX Trend Analysis ➞ | |
 | MKL Markel Corporation |
| Sector: Financials | |
| SubSector: Property & Casualty Insurance | |
| MarketCap: 12405.9 Millions | |
| Recent Price: 1427.07 Smart Investing & Trading Score: 0 | |
| Day Percent Change: -0.38% Day Change: -5.47 | |
| Week Change: -0.38% Year-to-date Change: 0.5% | |
| MKL Links: Profile News Message Board | |
| Charts:- Daily , Weekly | |
| Add MKL to Watchlist: View: Get Complete MKL Trend Analysis ➞ | |
 | ACGL Arch Capital Group Ltd. |
| Sector: Financials | |
| SubSector: Property & Casualty Insurance | |
| MarketCap: 12350.9 Millions | |
| Recent Price: 89.76 Smart Investing & Trading Score: 33 | |
| Day Percent Change: -0.24% Day Change: -0.22 | |
| Week Change: -0.24% Year-to-date Change: 20.9% | |
| ACGL Links: Profile News Message Board | |
| Charts:- Daily , Weekly | |
| Add ACGL to Watchlist: View: Get Complete ACGL Trend Analysis ➞ | |
 | VMC Vulcan Materials Company |
| Sector: Industrials | |
| SubSector: General Building Materials | |
| MarketCap: 12304.7 Millions | |
| Recent Price: 260.47 Smart Investing & Trading Score: 26 | |
| Day Percent Change: -0.88% Day Change: -2.31 | |
| Week Change: -0.88% Year-to-date Change: 14.7% | |
| VMC Links: Profile News Message Board | |
| Charts:- Daily , Weekly | |
| Add VMC to Watchlist: View: Get Complete VMC Trend Analysis ➞ | |
 | XYL Xylem Inc. |
| Sector: Industrials | |
| SubSector: Diversified Machinery | |
| MarketCap: 12195.1 Millions | |
| Recent Price: 127.29 Smart Investing & Trading Score: 51 | |
| Day Percent Change: -0.64% Day Change: -0.82 | |
| Week Change: -0.64% Year-to-date Change: 11.3% | |
| XYL Links: Profile News Message Board | |
| Charts:- Daily , Weekly | |
| Add XYL to Watchlist: View: Get Complete XYL Trend Analysis ➞ | |
 | IFF International Flavors & Fragrances Inc. |
| Sector: Materials | |
| SubSector: Specialty Chemicals | |
| MarketCap: 12178.7 Millions | |
| Recent Price: 82.59 Smart Investing & Trading Score: 36 | |
| Day Percent Change: -1.22% Day Change: -1.02 | |
| Week Change: -1.22% Year-to-date Change: 2.0% | |
| IFF Links: Profile News Message Board | |
| Charts:- Daily , Weekly | |
| Add IFF to Watchlist: View: Get Complete IFF Trend Analysis ➞ | |
 | DPZ Domino s Pizza, Inc. |
| Sector: Services & Goods | |
| SubSector: Restaurants | |
| MarketCap: 12166 Millions | |
| Recent Price: 488.02 Smart Investing & Trading Score: 36 | |
| Day Percent Change: -1.47% Day Change: -7.29 | |
| Week Change: -1.47% Year-to-date Change: 18.4% | |
| DPZ Links: Profile News Message Board | |
| Charts:- Daily , Weekly | |
| Add DPZ to Watchlist: View: Get Complete DPZ Trend Analysis ➞ | |
 | LH Laboratory Corporation of America Holdings |
| Sector: Health Care | |
| SubSector: Medical Laboratories & Research | |
| MarketCap: 12119.2 Millions | |
| Recent Price: 203.32 Smart Investing & Trading Score: 0 | |
| Day Percent Change: -1.17% Day Change: -2.41 | |
| Week Change: -1.17% Year-to-date Change: -10.6% | |
| LH Links: Profile News Message Board | |
| Charts:- Daily , Weekly | |
| Add LH to Watchlist: View: Get Complete LH Trend Analysis ➞ | |
 | TDOC Teladoc Health, Inc. |
| Sector: Technology | |
| SubSector: Healthcare Information Services | |
| MarketCap: 11968.5 Millions | |
| Recent Price: 13.55 Smart Investing & Trading Score: 15 | |
| Day Percent Change: -4.64% Day Change: -0.66 | |
| Week Change: -4.64% Year-to-date Change: -37.1% | |
| TDOC Links: Profile News Message Board | |
| Charts:- Daily , Weekly | |
| Add TDOC to Watchlist: View: Get Complete TDOC Trend Analysis ➞ | |
 | LEN Lennar Corporation |
| Sector: Industrials | |
| SubSector: Residential Construction | |
| MarketCap: 11926.6 Millions | |
| Recent Price: 156.12 Smart Investing & Trading Score: 34 | |
| Day Percent Change: -2.36% Day Change: -3.78 | |
| Week Change: -2.36% Year-to-date Change: 4.8% | |
| LEN Links: Profile News Message Board | |
| Charts:- Daily , Weekly | |
| Add LEN to Watchlist: View: Get Complete LEN Trend Analysis ➞ | |
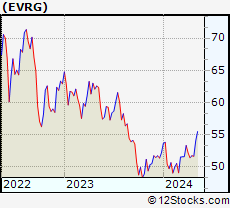 | EVRG Evergy, Inc. |
| Sector: Utilities | |
| SubSector: Electric Utilities | |
| MarketCap: 11914.8 Millions | |
| Recent Price: 50.39 Smart Investing & Trading Score: 23 | |
| Day Percent Change: -2.08% Day Change: -1.07 | |
| Week Change: -2.08% Year-to-date Change: -3.5% | |
| EVRG Links: Profile News Message Board | |
| Charts:- Daily , Weekly | |
| Add EVRG to Watchlist: View: Get Complete EVRG Trend Analysis ➞ | |
 | WAT Waters Corporation |
| Sector: Health Care | |
| SubSector: Medical Instruments & Supplies | |
| MarketCap: 11882 Millions | |
| Recent Price: 319.59 Smart Investing & Trading Score: 13 | |
| Day Percent Change: -0.95% Day Change: -3.07 | |
| Week Change: -0.95% Year-to-date Change: -2.9% | |
| WAT Links: Profile News Message Board | |
| Charts:- Daily , Weekly | |
| Add WAT to Watchlist: View: Get Complete WAT Trend Analysis ➞ | |
 | OMC Omnicom Group Inc. |
| Sector: Services & Goods | |
| SubSector: Advertising Agencies | |
| MarketCap: 11813.5 Millions | |
| Recent Price: 90.55 Smart Investing & Trading Score: 23 | |
| Day Percent Change: -0.04% Day Change: -0.04 | |
| Week Change: -0.04% Year-to-date Change: 4.7% | |
| OMC Links: Profile News Message Board | |
| Charts:- Daily , Weekly | |
| Add OMC to Watchlist: View: Get Complete OMC Trend Analysis ➞ | |
 | CRWD CrowdStrike Holdings, Inc. |
| Sector: Technology | |
| SubSector: Security Software & Services | |
| MarketCap: 11803.6 Millions | |
| Recent Price: 299.50 Smart Investing & Trading Score: 26 | |
| Day Percent Change: -3.09% Day Change: -9.55 | |
| Week Change: -3.09% Year-to-date Change: 17.3% | |
| CRWD Links: Profile News Message Board | |
| Charts:- Daily , Weekly | |
| Add CRWD to Watchlist: View: Get Complete CRWD Trend Analysis ➞ | |
 | CCL Carnival Corporation & Plc |
| Sector: Services & Goods | |
| SubSector: Resorts & Casinos | |
| MarketCap: 11725.4 Millions | |
| Recent Price: 14.06 Smart Investing & Trading Score: 0 | |
| Day Percent Change: -2.09% Day Change: -0.30 | |
| Week Change: -2.09% Year-to-date Change: -24.2% | |
| CCL Links: Profile News Message Board | |
| Charts:- Daily , Weekly | |
| Add CCL to Watchlist: View: Get Complete CCL Trend Analysis ➞ | |
 | LDOS Leidos Holdings, Inc. |
| Sector: Technology | |
| SubSector: Information Technology Services | |
| MarketCap: 11707.5 Millions | |
| Recent Price: 124.88 Smart Investing & Trading Score: 31 | |
| Day Percent Change: -0.68% Day Change: -0.85 | |
| Week Change: -0.68% Year-to-date Change: 15.4% | |
| LDOS Links: Profile News Message Board | |
| Charts:- Daily , Weekly | |
| Add LDOS to Watchlist: View: Get Complete LDOS Trend Analysis ➞ | |
 | TOST Toast, Inc. |
| Sector: Technology | |
| SubSector: Software - Infrastructure | |
| MarketCap: 11680 Millions | |
| Recent Price: 22.50 Smart Investing & Trading Score: 31 | |
| Day Percent Change: -5.54% Day Change: -1.32 | |
| Week Change: -5.54% Year-to-date Change: 22.9% | |
| TOST Links: Profile News Message Board | |
| Charts:- Daily , Weekly | |
| Add TOST to Watchlist: View: Get Complete TOST Trend Analysis ➞ | |
 | RYAN Ryan Specialty Holdings, Inc. |
| Sector: Financials | |
| SubSector: Insurance - Specialty | |
| MarketCap: 11630 Millions | |
| Recent Price: 49.52 Smart Investing & Trading Score: 36 | |
| Day Percent Change: -0.86% Day Change: -0.43 | |
| Week Change: -0.86% Year-to-date Change: 15.0% | |
| RYAN Links: Profile News Message Board | |
| Charts:- Daily , Weekly | |
| Add RYAN to Watchlist: View: Get Complete RYAN Trend Analysis ➞ | |
 | EPAM EPAM Systems, Inc. |
| Sector: Technology | |
| SubSector: Information Technology Services | |
| MarketCap: 11519.6 Millions | |
| Recent Price: 254.81 Smart Investing & Trading Score: 0 | |
| Day Percent Change: -1.68% Day Change: -4.35 | |
| Week Change: -1.68% Year-to-date Change: -14.3% | |
| EPAM Links: Profile News Message Board | |
| Charts:- Daily , Weekly | |
| Add EPAM to Watchlist: View: Get Complete EPAM Trend Analysis ➞ | |
 | ZBRA Zebra Technologies Corporation |
| Sector: Technology | |
| SubSector: Communication Equipment | |
| MarketCap: 11474.9 Millions | |
| Recent Price: 283.00 Smart Investing & Trading Score: 36 | |
| Day Percent Change: -2.31% Day Change: -6.68 | |
| Week Change: -2.31% Year-to-date Change: 3.5% | |
| ZBRA Links: Profile News Message Board | |
| Charts:- Daily , Weekly | |
| Add ZBRA to Watchlist: View: Get Complete ZBRA Trend Analysis ➞ | |
 | TRU TransUnion |
| Sector: Services & Goods | |
| SubSector: Business Services | |
| MarketCap: 11457.2 Millions | |
| Recent Price: 71.88 Smart Investing & Trading Score: 31 | |
| Day Percent Change: -2.30% Day Change: -1.69 | |
| Week Change: -2.3% Year-to-date Change: 4.6% | |
| TRU Links: Profile News Message Board | |
| Charts:- Daily , Weekly | |
| Add TRU to Watchlist: View: Get Complete TRU Trend Analysis ➞ | |
 | ATO Atmos Energy Corporation |
| Sector: Utilities | |
| SubSector: Gas Utilities | |
| MarketCap: 11449 Millions | |
| Recent Price: 113.06 Smart Investing & Trading Score: 10 | |
| Day Percent Change: -0.82% Day Change: -0.93 | |
| Week Change: -0.82% Year-to-date Change: -2.5% | |
| ATO Links: Profile News Message Board | |
| Charts:- Daily , Weekly | |
| Add ATO to Watchlist: View: Get Complete ATO Trend Analysis ➞ | |
| For tabular summary view of above stock list: Summary View ➞ 0 - 25 , 25 - 50 , 50 - 75 , 75 - 100 , 100 - 125 , 125 - 150 , 150 - 175 , 175 - 200 , 200 - 225 , 225 - 250 , 250 - 275 , 275 - 300 , 300 - 325 , 325 - 350 , 350 - 375 , 375 - 400 , 400 - 425 , 425 - 450 , 450 - 475 , 475 - 500 , 500 - 525 , 525 - 550 , 550 - 575 , 575 - 600 , 600 - 625 , 625 - 650 , 650 - 675 , 675 - 700 , 700 - 725 , 725 - 750 , 750 - 775 | ||
| Click To Change The Sort Order: By Market Cap or Company Size Performance: Year-to-date, Week and Day | |
| Select Chart Type: | ||
|
Best Stocks Today 12Stocks.com |
© 2024 12Stocks.com Terms & Conditions Privacy Contact Us
All Information Provided Only For Education And Not To Be Used For Investing or Trading. See Terms & Conditions


One More Thing ... Get Best Stocks Delivered Daily!
Never Ever Miss A Move With Our Top Ten Stocks Lists
Find Best Stocks In Any Market - Bull or Bear Market
Take A Peek At Our Top Ten Stocks Lists: Daily, Weekly, Year-to-Date & Top Trends
Find Best Stocks In Any Market - Bull or Bear Market
Take A Peek At Our Top Ten Stocks Lists: Daily, Weekly, Year-to-Date & Top Trends
Midcap Stocks With Best Up Trends [0-bearish to 100-bullish]: Coupang [100], BioMarin Pharmaceutical[95], Medical Properties[93], HEICO [90], Formula One[90], M&T Bank[85], Rockwell Automation[85], Alcoa [83], LPL Financial[83], Apartment ome[76], Yum! [75]
Best Midcap Stocks Year-to-Date:
AppLovin [79.49%], Vistra Energy[77.1%], ShockWave Medical[71.65%], EMCOR [61.2%], Constellation Energy[58.31%], Spotify [54.61%], Pure Storage[46.66%], Natera [44.35%], Williams-Sonoma [42.99%], CAVA [42.02%], NRG Energy[41.1%] Best Midcap Stocks This Week:
Medical Properties[18.8%], M&T Bank[4.74%], Alcoa [3.89%], New York[2.46%], Planet Fitness[2.07%], Coupang [1.88%], Cardinal Health[1.84%], Conagra [1.54%], Organon [1.49%], Cable One[1.47%], Flowers Foods[1.28%] Best Midcap Stocks Daily:
Medical Properties[18.80%], M&T Bank[4.74%], Alcoa [3.89%], New York[2.46%], Planet Fitness[2.07%], Coupang [1.88%], Cardinal Health[1.84%], Conagra [1.54%], Organon [1.49%], Cable One[1.47%], Flowers Foods[1.28%]