
 Login Sign Up


| |||||
 |  | ||||

| 12Stocks.com Market Intelligence |
Best MidCap Stocks
|
| In a hurry? Mid Cap Stocks Lists: Performance Trends Table, Stock Charts
Sort midcap stocks: Daily, Weekly, Year-to-Date, Market Cap & Trends. Filter midcap stocks list by sector: Show all, Tech, Finance, Energy, Staples, Retail, Industrial, Materials, Utilities and HealthCare Filter midcap stocks list by size:All MidCap Large Mid-Range Small |
| 12Stocks.com Mid Cap Stocks Performances & Trends Daily | |||||||||
|
|  The overall Smart Investing & Trading Score is 44 (0-bearish to 100-bullish) which puts Mid Cap index in short term neutral trend. The Smart Investing & Trading Score from previous trading session is 26 and hence an improvement of trend.
| ||||||||
Here are the Smart Investing & Trading Scores of the most requested mid cap stocks at 12Stocks.com (click stock name for detailed review):
|


| 12Stocks.com: Top Performing Mid Cap Index Stocks | ||||||||||||||||||||||||||||||||||||||||||||||||
 The top performing Mid Cap Index stocks year to date are
Now, more recently, over last week, the top performing Mid Cap Index stocks on the move are


|
||||||||||||||||||||||||||||||||||||||||||||||||
| 12Stocks.com: Investing in Midcap Index with Stocks | |
|
The following table helps investors and traders sort through current performance and trends (as measured by Smart Investing & Trading Score) of various
stocks in the Midcap Index. Quick View: Move mouse or cursor over stock symbol (ticker) to view short-term technical chart and over stock name to view long term chart. Click on  to add stock symbol to your watchlist and to add stock symbol to your watchlist and  to view watchlist. Click on any ticker or stock name for detailed market intelligence report for that stock. to view watchlist. Click on any ticker or stock name for detailed market intelligence report for that stock. |
12Stocks.com Performance of Stocks in Midcap Index
| Ticker | Stock Name | Watchlist | Category | Recent Price | Smart Investing & Trading Score | Change % | YTD Change% |
| MPWR | Monolithic Power |   | Technology | 630.16 | 26 | -1.18% | -0.10% |
| OHI | Omega | | Financials | 30.06 | 36 | 0.33% | -1.96% |
| TTC | Toro | | Industrials | 84.84 | 10 | 0.66% | -11.62% |
| KRC | Kilroy Realty | | Financials | 32.86 | 18 | 1.42% | -17.52% |
| SEIC | SEI s | | Financials | 66.27 | 36 | 0.28% | 4.27% |
| CTLT | Catalent | | Health Care | 56.31 | 68 | 0.63% | 25.34% |
| REG | Regency Centers | | Financials | 57.73 | 25 | 0.77% | -13.84% |
| VNO | Vornado Realty | | Financials | 26.32 | 30 | 2.37% | -6.83% |
| MTN | Vail Resorts | | Services & Goods | 219.10 | 10 | -0.19% | 2.64% |
| URI | United Rentals | | Transports | 645.88 | 36 | 1.52% | 12.64% |
| ATR | Aptar | | Consumer Staples | 139.23 | 44 | 0.60% | 12.63% |
| EMN | Eastman Chemical | | Materials | 96.21 | 53 | 0.25% | 7.11% |
| CIEN | Ciena | | Technology | 44.51 | 18 | -0.65% | -1.11% |
| CBSH | Commerce Bancshares | | Financials | 52.71 | 78 | -0.68% | -1.31% |
| PHM | Pulte | | Industrials | 108.68 | 51 | 2.38% | 5.29% |
| PTC | PTC | | Technology | 176.90 | 18 | -0.33% | 1.11% |
| JNPR | Juniper Networks | | Technology | 36.28 | 13 | -0.53% | 23.08% |
| RNR | RenaissanceRe | | Financials | 220.56 | 32 | 1.92% | 12.53% |
| CHE | Chemed | | Health Care | 603.47 | 36 | -0.12% | 3.20% |
| ALB | Albemarle | | Materials | 113.51 | 10 | -0.77% | -21.44% |
| AMH | American Homes | | Financials | 35.02 | 38 | 1.04% | -2.61% |
| TXT | Textron | | Industrials | 93.31 | 49 | 1.19% | 16.02% |
| AIZ | Assurant | | Financials | 170.76 | 43 | 0.40% | 1.34% |
| IPGP | IPG Photonics | | Technology | 85.46 | 35 | 1.29% | -21.26% |
| AMED | Amedisys | | Health Care | 91.13 | 23 | 0.19% | -4.13% |
| For chart view version of above stock list: Chart View ➞ 0 - 25 , 25 - 50 , 50 - 75 , 75 - 100 , 100 - 125 , 125 - 150 , 150 - 175 , 175 - 200 , 200 - 225 , 225 - 250 , 250 - 275 , 275 - 300 , 300 - 325 , 325 - 350 , 350 - 375 , 375 - 400 , 400 - 425 , 425 - 450 , 450 - 475 , 475 - 500 , 500 - 525 , 525 - 550 , 550 - 575 , 575 - 600 , 600 - 625 , 625 - 650 , 650 - 675 , 675 - 700 | ||
 | Click To Change The Sort Order: By Market Cap or Company Size Performance: Year-to-date, Week and Day |  |
|
Get the most comprehensive stock market coverage daily at 12Stocks.com ➞ Best Stocks Today ➞ Best Stocks Weekly ➞ Best Stocks Year-to-Date ➞ Best Stocks Trends ➞  Best Stocks Today 12Stocks.com Best Nasdaq Stocks ➞ Best S&P 500 Stocks ➞ Best Tech Stocks ➞ Best Biotech Stocks ➞ |
| Detailed Overview of Midcap Stocks |
| Midcap Technical Overview, Leaders & Laggards, Top Midcap ETF Funds & Detailed Midcap Stocks List, Charts, Trends & More |
| Midcap: Technical Analysis, Trends & YTD Performance | |
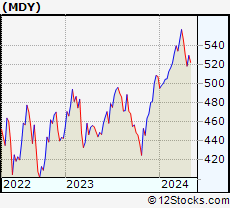
| MidCap segment as represented by
MDY, an exchange-traded fund [ETF], holds basket of about four hundred midcap stocks from across all major sectors of the US stock market. The midcap index (contains stocks like Green Mountain Coffee Roasters and Tractor Supply Company) is up by 2.72% and is currently underperforming the overall market by -2.33% year-to-date. Below is a quick view of technical charts and trends: | |
 MDY Weekly Chart |
|
| Long Term Trend: Good | |
| Medium Term Trend: Not Good | |
 MDY Daily Chart |
|
| Short Term Trend: Deteriorating | |
| Overall Trend Score: 44 | |
| YTD Performance: 2.72% | |
| **Trend Scores & Views Are Only For Educational Purposes And Not For Investing | |
| 12Stocks.com: Investing in Midcap Index using Exchange Traded Funds | |
|
The following table shows list of key exchange traded funds (ETF) that
help investors track Midcap index. The following list also includes leveraged ETF funds that track twice or thrice the daily returns of Midcap indices. Short or inverse ETF funds move in the opposite direction to the index they track and are useful during market pullbacks or during bear markets. Quick View: Move mouse or cursor over ETF symbol (ticker) to view short-term technical chart and over ETF name to view long term chart. Click on ticker or stock name for detailed view. Click on to add stock symbol to your watchlist and to view watchlist. |
12Stocks.com List of ETFs that track Midcap Index
| Ticker | ETF Name | Watchlist | Recent Price | Smart Investing & Trading Score | Change % | Week % | Year-to-date % |
| IJH | iShares Core S&P Mid-Cap | | 56.74 | 41 | 0.42 | -1.98 | 2.37% |
| IWR | iShares Russell Mid-Cap | | 78.86 | 43 | 0.05 | -2.18 | 1.45% |
| MDY | SPDR S&P MidCap 400 ETF | | 521.18 | 44 | 0.76 | -1.65 | 2.72% |
| IWP | iShares Russell Mid-Cap Growth | | 106.89 | 36 | -0.12 | -2.69 | 2.33% |
| IWS | iShares Russell Mid-Cap Value | | 117.38 | 48 | -0.03 | -2.09 | 0.94% |
| IJK | iShares S&P Mid-Cap 400 Growth | | 85.47 | 41 | 0.15 | -2.3 | 7.89% |
| UMDD | ProShares UltraPro MidCap400 | | 22.70 | 36 | 1.11 | -6.09 | 1.7% |
| IJJ | iShares S&P Mid-Cap 400 Value | | 109.66 | 23 | 0.20 | -2.09 | -3.85% |
| SMDD | ProShares UltraPro Short MidCap400 | | 12.53 | 52 | -0.08 | 6.64 | -6.93% |
| XMLV | PowerShares S&P MidCap Low Volatil ETF | | 53.53 | 54 | 0.30 | -1.33 | 0.66% |
| MYY | ProShares Short MidCap400 | | 21.18 | 69 | -0.12 | 2.33 | -1.26% |
| MZZ | ProShares UltraShort MidCap400 | | 12.17 | 34 | 0.87 | 4.91 | -3.19% |
| 12Stocks.com: Charts, Trends, Fundamental Data and Performances of MidCap Stocks | |
|
We now take in-depth look at all MidCap stocks including charts, multi-period performances and overall trends (as measured by Smart Investing & Trading Score). One can sort MidCap stocks (click link to choose) by Daily, Weekly and by Year-to-Date performances. Also, one can sort by size of the company or by market capitalization. |
| Select Your Default Chart Type: | |||||
| |||||
| Click on stock symbol or name for detailed view. Click on to add stock symbol to your watchlist and to view watchlist. Quick View: Move mouse or cursor over "Daily" to quickly view daily technical stock chart and over "Weekly" to view weekly technical stock chart. | |||||

 | MPWR Monolithic Power Systems, Inc. |
| Sector: Technology | |
| SubSector: Semiconductor - Specialized | |
| MarketCap: 6436.4 Millions | |
| Recent Price: 630.16 Smart Investing & Trading Score: 26 | |
| Day Percent Change: -1.18% Day Change: -7.56 | |
| Week Change: -4.26% Year-to-date Change: -0.1% | |
| MPWR Links: Profile News Message Board | |
| Charts:- Daily , Weekly | |
| Add MPWR to Watchlist: View: Get Complete MPWR Trend Analysis ➞ | |
 | OHI Omega Healthcare Investors, Inc. |
| Sector: Financials | |
| SubSector: REIT - Healthcare Facilities | |
| MarketCap: 6433.84 Millions | |
| Recent Price: 30.06 Smart Investing & Trading Score: 36 | |
| Day Percent Change: 0.33% Day Change: 0.10 | |
| Week Change: -1.44% Year-to-date Change: -2.0% | |
| OHI Links: Profile News Message Board | |
| Charts:- Daily , Weekly | |
| Add OHI to Watchlist: View: Get Complete OHI Trend Analysis ➞ | |
 | TTC The Toro Company |
| Sector: Industrials | |
| SubSector: Small Tools & Accessories | |
| MarketCap: 6426.96 Millions | |
| Recent Price: 84.84 Smart Investing & Trading Score: 10 | |
| Day Percent Change: 0.66% Day Change: 0.56 | |
| Week Change: -1.08% Year-to-date Change: -11.6% | |
| TTC Links: Profile News Message Board | |
| Charts:- Daily , Weekly | |
| Add TTC to Watchlist: View: Get Complete TTC Trend Analysis ➞ | |
 | KRC Kilroy Realty Corporation |
| Sector: Financials | |
| SubSector: REIT - Office | |
| MarketCap: 6390.46 Millions | |
| Recent Price: 32.86 Smart Investing & Trading Score: 18 | |
| Day Percent Change: 1.42% Day Change: 0.46 | |
| Week Change: -1.82% Year-to-date Change: -17.5% | |
| KRC Links: Profile News Message Board | |
| Charts:- Daily , Weekly | |
| Add KRC to Watchlist: View: Get Complete KRC Trend Analysis ➞ | |
 | SEIC SEI Investments Company |
| Sector: Financials | |
| SubSector: Asset Management | |
| MarketCap: 6367.03 Millions | |
| Recent Price: 66.27 Smart Investing & Trading Score: 36 | |
| Day Percent Change: 0.28% Day Change: 0.19 | |
| Week Change: -1.8% Year-to-date Change: 4.3% | |
| SEIC Links: Profile News Message Board | |
| Charts:- Daily , Weekly | |
| Add SEIC to Watchlist: View: Get Complete SEIC Trend Analysis ➞ | |
 | CTLT Catalent, Inc. |
| Sector: Health Care | |
| SubSector: Drugs - Generic | |
| MarketCap: 6351.95 Millions | |
| Recent Price: 56.31 Smart Investing & Trading Score: 68 | |
| Day Percent Change: 0.63% Day Change: 0.35 | |
| Week Change: 0.03% Year-to-date Change: 25.3% | |
| CTLT Links: Profile News Message Board | |
| Charts:- Daily , Weekly | |
| Add CTLT to Watchlist: View: Get Complete CTLT Trend Analysis ➞ | |
 | REG Regency Centers Corporation |
| Sector: Financials | |
| SubSector: REIT - Retail | |
| MarketCap: 6345.84 Millions | |
| Recent Price: 57.73 Smart Investing & Trading Score: 25 | |
| Day Percent Change: 0.77% Day Change: 0.44 | |
| Week Change: -1.3% Year-to-date Change: -13.8% | |
| REG Links: Profile News Message Board | |
| Charts:- Daily , Weekly | |
| Add REG to Watchlist: View: Get Complete REG Trend Analysis ➞ | |
 | VNO Vornado Realty Trust |
| Sector: Financials | |
| SubSector: REIT - Diversified | |
| MarketCap: 6300.63 Millions | |
| Recent Price: 26.32 Smart Investing & Trading Score: 30 | |
| Day Percent Change: 2.37% Day Change: 0.61 | |
| Week Change: -4.01% Year-to-date Change: -6.8% | |
| VNO Links: Profile News Message Board | |
| Charts:- Daily , Weekly | |
| Add VNO to Watchlist: View: Get Complete VNO Trend Analysis ➞ | |
 | MTN Vail Resorts, Inc. |
| Sector: Services & Goods | |
| SubSector: Resorts & Casinos | |
| MarketCap: 6259.64 Millions | |
| Recent Price: 219.10 Smart Investing & Trading Score: 10 | |
| Day Percent Change: -0.19% Day Change: -0.41 | |
| Week Change: -3.47% Year-to-date Change: 2.6% | |
| MTN Links: Profile News Message Board | |
| Charts:- Daily , Weekly | |
| Add MTN to Watchlist: View: Get Complete MTN Trend Analysis ➞ | |
 | URI United Rentals, Inc. |
| Sector: Transports | |
| SubSector: Rental & Leasing Services | |
| MarketCap: 6246.64 Millions | |
| Recent Price: 645.88 Smart Investing & Trading Score: 36 | |
| Day Percent Change: 1.52% Day Change: 9.65 | |
| Week Change: -4.29% Year-to-date Change: 12.6% | |
| URI Links: Profile News Message Board | |
| Charts:- Daily , Weekly | |
| Add URI to Watchlist: View: Get Complete URI Trend Analysis ➞ | |
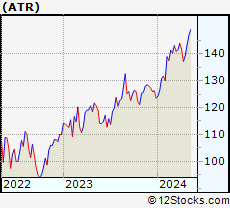 | ATR AptarGroup, Inc. |
| Sector: Consumer Staples | |
| SubSector: Packaging & Containers | |
| MarketCap: 6219.43 Millions | |
| Recent Price: 139.23 Smart Investing & Trading Score: 44 | |
| Day Percent Change: 0.60% Day Change: 0.83 | |
| Week Change: 1.48% Year-to-date Change: 12.6% | |
| ATR Links: Profile News Message Board | |
| Charts:- Daily , Weekly | |
| Add ATR to Watchlist: View: Get Complete ATR Trend Analysis ➞ | |
 | EMN Eastman Chemical Company |
| Sector: Materials | |
| SubSector: Chemicals - Major Diversified | |
| MarketCap: 6217.06 Millions | |
| Recent Price: 96.21 Smart Investing & Trading Score: 53 | |
| Day Percent Change: 0.25% Day Change: 0.24 | |
| Week Change: -1.81% Year-to-date Change: 7.1% | |
| EMN Links: Profile News Message Board | |
| Charts:- Daily , Weekly | |
| Add EMN to Watchlist: View: Get Complete EMN Trend Analysis ➞ | |
 | CIEN Ciena Corporation |
| Sector: Technology | |
| SubSector: Communication Equipment | |
| MarketCap: 6206.99 Millions | |
| Recent Price: 44.51 Smart Investing & Trading Score: 18 | |
| Day Percent Change: -0.65% Day Change: -0.29 | |
| Week Change: -2.39% Year-to-date Change: -1.1% | |
| CIEN Links: Profile News Message Board | |
| Charts:- Daily , Weekly | |
| Add CIEN to Watchlist: View: Get Complete CIEN Trend Analysis ➞ | |
 | CBSH Commerce Bancshares, Inc. |
| Sector: Financials | |
| SubSector: Regional - Midwest Banks | |
| MarketCap: 6201.5 Millions | |
| Recent Price: 52.71 Smart Investing & Trading Score: 78 | |
| Day Percent Change: -0.68% Day Change: -0.36 | |
| Week Change: 2.53% Year-to-date Change: -1.3% | |
| CBSH Links: Profile News Message Board | |
| Charts:- Daily , Weekly | |
| Add CBSH to Watchlist: View: Get Complete CBSH Trend Analysis ➞ | |
 | PHM PulteGroup, Inc. |
| Sector: Industrials | |
| SubSector: Residential Construction | |
| MarketCap: 6186.46 Millions | |
| Recent Price: 108.68 Smart Investing & Trading Score: 51 | |
| Day Percent Change: 2.38% Day Change: 2.53 | |
| Week Change: -1.99% Year-to-date Change: 5.3% | |
| PHM Links: Profile News Message Board | |
| Charts:- Daily , Weekly | |
| Add PHM to Watchlist: View: Get Complete PHM Trend Analysis ➞ | |
 | PTC PTC Inc. |
| Sector: Technology | |
| SubSector: Technical & System Software | |
| MarketCap: 6166.7 Millions | |
| Recent Price: 176.90 Smart Investing & Trading Score: 18 | |
| Day Percent Change: -0.33% Day Change: -0.58 | |
| Week Change: -1.75% Year-to-date Change: 1.1% | |
| PTC Links: Profile News Message Board | |
| Charts:- Daily , Weekly | |
| Add PTC to Watchlist: View: Get Complete PTC Trend Analysis ➞ | |
 | JNPR Juniper Networks, Inc. |
| Sector: Technology | |
| SubSector: Communication Equipment | |
| MarketCap: 6161.49 Millions | |
| Recent Price: 36.28 Smart Investing & Trading Score: 13 | |
| Day Percent Change: -0.53% Day Change: -0.20 | |
| Week Change: -1% Year-to-date Change: 23.1% | |
| JNPR Links: Profile News Message Board | |
| Charts:- Daily , Weekly | |
| Add JNPR to Watchlist: View: Get Complete JNPR Trend Analysis ➞ | |
 | RNR RenaissanceRe Holdings Ltd. |
| Sector: Financials | |
| SubSector: Property & Casualty Insurance | |
| MarketCap: 6153.32 Millions | |
| Recent Price: 220.56 Smart Investing & Trading Score: 32 | |
| Day Percent Change: 1.92% Day Change: 4.16 | |
| Week Change: 2.22% Year-to-date Change: 12.5% | |
| RNR Links: Profile News Message Board | |
| Charts:- Daily , Weekly | |
| Add RNR to Watchlist: View: Get Complete RNR Trend Analysis ➞ | |
 | CHE Chemed Corporation |
| Sector: Health Care | |
| SubSector: Home Health Care | |
| MarketCap: 6148.95 Millions | |
| Recent Price: 603.47 Smart Investing & Trading Score: 36 | |
| Day Percent Change: -0.12% Day Change: -0.70 | |
| Week Change: -2.43% Year-to-date Change: 3.2% | |
| CHE Links: Profile News Message Board | |
| Charts:- Daily , Weekly | |
| Add CHE to Watchlist: View: Get Complete CHE Trend Analysis ➞ | |
 | ALB Albemarle Corporation |
| Sector: Materials | |
| SubSector: Specialty Chemicals | |
| MarketCap: 6139.27 Millions | |
| Recent Price: 113.51 Smart Investing & Trading Score: 10 | |
| Day Percent Change: -0.77% Day Change: -0.88 | |
| Week Change: -7.4% Year-to-date Change: -21.4% | |
| ALB Links: Profile News Message Board | |
| Charts:- Daily , Weekly | |
| Add ALB to Watchlist: View: Get Complete ALB Trend Analysis ➞ | |
 | AMH American Homes 4 Rent |
| Sector: Financials | |
| SubSector: REIT - Residential | |
| MarketCap: 6135.31 Millions | |
| Recent Price: 35.02 Smart Investing & Trading Score: 38 | |
| Day Percent Change: 1.04% Day Change: 0.36 | |
| Week Change: -1.52% Year-to-date Change: -2.6% | |
| AMH Links: Profile News Message Board | |
| Charts:- Daily , Weekly | |
| Add AMH to Watchlist: View: Get Complete AMH Trend Analysis ➞ | |
 | TXT Textron Inc. |
| Sector: Industrials | |
| SubSector: Aerospace/Defense - Major Diversified | |
| MarketCap: 6123.09 Millions | |
| Recent Price: 93.31 Smart Investing & Trading Score: 49 | |
| Day Percent Change: 1.19% Day Change: 1.10 | |
| Week Change: -0.7% Year-to-date Change: 16.0% | |
| TXT Links: Profile News Message Board | |
| Charts:- Daily , Weekly | |
| Add TXT to Watchlist: View: Get Complete TXT Trend Analysis ➞ | |
 | AIZ Assurant, Inc. |
| Sector: Financials | |
| SubSector: Accident & Health Insurance | |
| MarketCap: 6110.3 Millions | |
| Recent Price: 170.76 Smart Investing & Trading Score: 43 | |
| Day Percent Change: 0.40% Day Change: 0.67 | |
| Week Change: -1.97% Year-to-date Change: 1.3% | |
| AIZ Links: Profile News Message Board | |
| Charts:- Daily , Weekly | |
| Add AIZ to Watchlist: View: Get Complete AIZ Trend Analysis ➞ | |
 | IPGP IPG Photonics Corporation |
| Sector: Technology | |
| SubSector: Semiconductor Equipment & Materials | |
| MarketCap: 6059.38 Millions | |
| Recent Price: 85.46 Smart Investing & Trading Score: 35 | |
| Day Percent Change: 1.29% Day Change: 1.09 | |
| Week Change: -0.34% Year-to-date Change: -21.3% | |
| IPGP Links: Profile News Message Board | |
| Charts:- Daily , Weekly | |
| Add IPGP to Watchlist: View: Get Complete IPGP Trend Analysis ➞ | |
 | AMED Amedisys, Inc. |
| Sector: Health Care | |
| SubSector: Home Health Care | |
| MarketCap: 6058.95 Millions | |
| Recent Price: 91.13 Smart Investing & Trading Score: 23 | |
| Day Percent Change: 0.19% Day Change: 0.17 | |
| Week Change: -0.84% Year-to-date Change: -4.1% | |
| AMED Links: Profile News Message Board | |
| Charts:- Daily , Weekly | |
| Add AMED to Watchlist: View: Get Complete AMED Trend Analysis ➞ | |
| For tabular summary view of above stock list: Summary View ➞ 0 - 25 , 25 - 50 , 50 - 75 , 75 - 100 , 100 - 125 , 125 - 150 , 150 - 175 , 175 - 200 , 200 - 225 , 225 - 250 , 250 - 275 , 275 - 300 , 300 - 325 , 325 - 350 , 350 - 375 , 375 - 400 , 400 - 425 , 425 - 450 , 450 - 475 , 475 - 500 , 500 - 525 , 525 - 550 , 550 - 575 , 575 - 600 , 600 - 625 , 625 - 650 , 650 - 675 , 675 - 700 | ||
| Click To Change The Sort Order: By Market Cap or Company Size Performance: Year-to-date, Week and Day | |
| Select Chart Type: | ||
|
Best Stocks Today 12Stocks.com |
© 2024 12Stocks.com Terms & Conditions Privacy Contact Us
All Information Provided Only For Education And Not To Be Used For Investing or Trading. See Terms & Conditions


One More Thing ... Get Best Stocks Delivered Daily!
Never Ever Miss A Move With Our Top Ten Stocks Lists
Find Best Stocks In Any Market - Bull or Bear Market
Take A Peek At Our Top Ten Stocks Lists: Daily, Weekly, Year-to-Date & Top Trends
Find Best Stocks In Any Market - Bull or Bear Market
Take A Peek At Our Top Ten Stocks Lists: Daily, Weekly, Year-to-Date & Top Trends
Midcap Stocks With Best Up Trends [0-bearish to 100-bullish]: Genuine Parts[100], Alaska Air[100], United Airlines[100], Medical Properties[100], HEICO [100], Generac [93], Delta Air[93], United [93], Bunge [93], Flowers Foods[93], Pilgrim s[90]
Best Midcap Stocks Year-to-Date:
AppLovin [77.99%], Constellation Energy[59.78%], EMCOR [58.18%], Pure Storage[47.34%], CAVA [44.09%], Natera [43.65%], Williams-Sonoma [41.72%], Wingstop [41.22%], NRG Energy[40.48%], Allison Transmission[38.13%], Robinhood Markets[37.82%] Best Midcap Stocks This Week:
Medical Properties[22.31%], United Airlines[21.81%], Genuine Parts[10.85%], Alaska Air[9.9%], Iridium [8.59%], Advance Auto[8.55%], AMC Entertainment[8.49%], American Airlines[7.91%], Southwest Airlines[6.57%], Cable One[6.09%], agilon health[5.96%] Best Midcap Stocks Daily:
Genuine Parts[11.86%], Iridium [8.42%], Ally Financial[7.80%], Alaska Air[6.25%], Manpower [6.25%], Coinbase Global[5.90%], Ginkgo Bioworks[5.13%], agilon health[4.69%], United Airlines[4.46%], Cable One[4.24%], Rocket [4.17%]