
 Login Sign Up


| |||||
 |  | ||||

| 12Stocks.com Market Intelligence |
Best MidCap Stocks
|
| In a hurry? Mid Cap Stocks Lists: Performance Trends Table, Stock Charts
Sort midcap stocks: Daily, Weekly, Year-to-Date, Market Cap & Trends. Filter midcap stocks list by sector: Show all, Tech, Finance, Energy, Staples, Retail, Industrial, Materials, Utilities and HealthCare Filter midcap stocks list by size:All MidCap Large Mid-Range Small |
| 12Stocks.com Mid Cap Stocks Performances & Trends Daily | |||||||||
|
|  The overall Smart Investing & Trading Score is 36 (0-bearish to 100-bullish) which puts Mid Cap index in short term bearish to neutral trend. The Smart Investing & Trading Score from previous trading session is 26 and hence an improvement of trend.
| ||||||||
Here are the Smart Investing & Trading Scores of the most requested mid cap stocks at 12Stocks.com (click stock name for detailed review):
|


| 12Stocks.com: Top Performing Mid Cap Index Stocks | ||||||||||||||||||||||||||||||||||||||||||||||||
 The top performing Mid Cap Index stocks year to date are
Now, more recently, over last week, the top performing Mid Cap Index stocks on the move are


|
||||||||||||||||||||||||||||||||||||||||||||||||
| 12Stocks.com: Investing in Midcap Index with Stocks | |
|
The following table helps investors and traders sort through current performance and trends (as measured by Smart Investing & Trading Score) of various
stocks in the Midcap Index. Quick View: Move mouse or cursor over stock symbol (ticker) to view short-term technical chart and over stock name to view long term chart. Click on  to add stock symbol to your watchlist and to add stock symbol to your watchlist and  to view watchlist. Click on any ticker or stock name for detailed market intelligence report for that stock. to view watchlist. Click on any ticker or stock name for detailed market intelligence report for that stock. |
12Stocks.com Performance of Stocks in Midcap Index
| Ticker | Stock Name | Watchlist | Category | Recent Price | Smart Investing & Trading Score | Change % | YTD Change% |
| BIO | Bio-Rad |   | Health Care | 279.63 | 0 | -3.86% | -13.40% |
| BR | Broadridge Financial | | Technology | 194.97 | 17 | 0.78% | -5.24% |
| MLM | Martin Marietta | | Industrials | 591.59 | 48 | -0.22% | 18.58% |
| BRO | Brown & Brown | | Financials | 81.62 | 58 | 1.24% | 14.78% |
| HES | Hess | | Energy | 151.79 | 61 | 0.66% | 5.29% |
| NUE | Nucor | | Materials | 192.85 | 43 | 0.04% | 10.81% |
| FITB | Fifth Third | | Financials | 34.47 | 40 | 1.09% | -0.06% |
| UDR | UDR | | Financials | 35.84 | 20 | 1.41% | -6.40% |
| EXPD | Expeditors | | Transports | 115.06 | 0 | 0.63% | -9.55% |
| KEY | KeyCorp | | Financials | 14.61 | 35 | 1.25% | 1.46% |
| HEI | HEICO | | Industrials | 199.83 | 100 | 1.15% | 11.72% |
| WST | West Pharmaceutical | | Health Care | 379.07 | 39 | 0.45% | 7.65% |
| NVR | NVR | | Industrials | 7800.50 | 56 | 1.70% | 11.43% |
| LNG | Cheniere Energy | | Energy | 159.53 | 42 | 1.73% | -6.55% |
| SSNC | SS&C Technologies | | Technology | 60.73 | 10 | 0.81% | -0.62% |
| WRB | W. R. | | Financials | 81.30 | 23 | 0.72% | 14.95% |
| BURL | Burlington Stores | | Services & Goods | 179.99 | 10 | 0.04% | -7.45% |
| INVH | Invitation Homes | | Financials | 33.32 | 23 | 0.76% | -2.32% |
| IEX | IDEX | | Industrials | 228.54 | 36 | 0.75% | 5.26% |
| TSCO | Tractor Supply | | Services & Goods | 248.80 | 68 | 0.57% | 15.70% |
| PATH | UiPath | | Technology | 19.33 | 10 | 1.10% | -22.23% |
| ELS | Equity LifeStyle | | Financials | 62.50 | 42 | 1.13% | -11.40% |
| GDDY | GoDaddy | | Technology | 123.46 | 46 | 0.90% | 16.30% |
| WPC | W. P. | | Financials | 54.16 | 35 | 1.22% | -16.42% |
| QRVO | Qorvo | | Technology | 109.36 | 31 | -0.54% | -2.89% |
| For chart view version of above stock list: Chart View ➞ 0 - 25 , 25 - 50 , 50 - 75 , 75 - 100 , 100 - 125 , 125 - 150 , 150 - 175 , 175 - 200 , 200 - 225 , 225 - 250 , 250 - 275 , 275 - 300 , 300 - 325 , 325 - 350 , 350 - 375 , 375 - 400 , 400 - 425 , 425 - 450 , 450 - 475 , 475 - 500 , 500 - 525 , 525 - 550 , 550 - 575 , 575 - 600 , 600 - 625 , 625 - 650 , 650 - 675 , 675 - 700 | ||
 | Click To Change The Sort Order: By Market Cap or Company Size Performance: Year-to-date, Week and Day |  |
|
Get the most comprehensive stock market coverage daily at 12Stocks.com ➞ Best Stocks Today ➞ Best Stocks Weekly ➞ Best Stocks Year-to-Date ➞ Best Stocks Trends ➞  Best Stocks Today 12Stocks.com Best Nasdaq Stocks ➞ Best S&P 500 Stocks ➞ Best Tech Stocks ➞ Best Biotech Stocks ➞ |
| Detailed Overview of Midcap Stocks |
| Midcap Technical Overview, Leaders & Laggards, Top Midcap ETF Funds & Detailed Midcap Stocks List, Charts, Trends & More |
| Midcap: Technical Analysis, Trends & YTD Performance | |
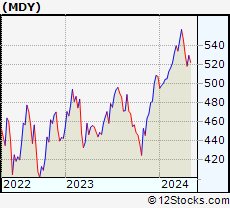
| MidCap segment as represented by
MDY, an exchange-traded fund [ETF], holds basket of about four hundred midcap stocks from across all major sectors of the US stock market. The midcap index (contains stocks like Green Mountain Coffee Roasters and Tractor Supply Company) is up by 2.72% and is currently underperforming the overall market by -2.33% year-to-date. Below is a quick view of technical charts and trends: | |
 MDY Weekly Chart |
|
| Long Term Trend: Good | |
| Medium Term Trend: Not Good | |
 MDY Daily Chart |
|
| Short Term Trend: Deteriorating | |
| Overall Trend Score: 36 | |
| YTD Performance: 2.72% | |
| **Trend Scores & Views Are Only For Educational Purposes And Not For Investing | |
| 12Stocks.com: Investing in Midcap Index using Exchange Traded Funds | |
|
The following table shows list of key exchange traded funds (ETF) that
help investors track Midcap index. The following list also includes leveraged ETF funds that track twice or thrice the daily returns of Midcap indices. Short or inverse ETF funds move in the opposite direction to the index they track and are useful during market pullbacks or during bear markets. Quick View: Move mouse or cursor over ETF symbol (ticker) to view short-term technical chart and over ETF name to view long term chart. Click on ticker or stock name for detailed view. Click on to add stock symbol to your watchlist and to view watchlist. |
12Stocks.com List of ETFs that track Midcap Index
| Ticker | ETF Name | Watchlist | Recent Price | Smart Investing & Trading Score | Change % | Week % | Year-to-date % |
| IJH | iShares Core S&P Mid-Cap | | 56.74 | 26 | 0.42 | -1.98 | 2.37% |
| IWR | iShares Russell Mid-Cap | | 78.86 | 33 | 0.05 | -2.18 | 1.45% |
| MDY | SPDR S&P MidCap 400 ETF | | 521.18 | 36 | 0.76 | -1.65 | 2.72% |
| IWP | iShares Russell Mid-Cap Growth | | 106.89 | 26 | -0.12 | -2.69 | 2.33% |
| IWS | iShares Russell Mid-Cap Value | | 117.38 | 38 | -0.03 | -2.09 | 0.94% |
| IJK | iShares S&P Mid-Cap 400 Growth | | 85.47 | 31 | 0.15 | -2.3 | 7.89% |
| UMDD | ProShares UltraPro MidCap400 | | 22.70 | 36 | 1.11 | -6.09 | 1.7% |
| IJJ | iShares S&P Mid-Cap 400 Value | | 109.66 | 0 | 0.20 | -2.09 | -3.85% |
| SMDD | ProShares UltraPro Short MidCap400 | | 12.53 | 52 | -0.08 | 6.64 | -6.93% |
| XMLV | PowerShares S&P MidCap Low Volatil ETF | | 53.53 | 36 | 0.30 | -1.33 | 0.66% |
| MYY | ProShares Short MidCap400 | | 21.18 | 69 | -0.12 | 2.33 | -1.26% |
| MZZ | ProShares UltraShort MidCap400 | | 12.17 | 34 | 0.87 | 4.91 | -3.19% |
| 12Stocks.com: Charts, Trends, Fundamental Data and Performances of MidCap Stocks | |
|
We now take in-depth look at all MidCap stocks including charts, multi-period performances and overall trends (as measured by Smart Investing & Trading Score). One can sort MidCap stocks (click link to choose) by Daily, Weekly and by Year-to-Date performances. Also, one can sort by size of the company or by market capitalization. |
| Select Your Default Chart Type: | |||||
| |||||
| Click on stock symbol or name for detailed view. Click on to add stock symbol to your watchlist and to view watchlist. Quick View: Move mouse or cursor over "Daily" to quickly view daily technical stock chart and over "Weekly" to view weekly technical stock chart. | |||||

 | BIO Bio-Rad Laboratories, Inc. |
| Sector: Health Care | |
| SubSector: Medical Laboratories & Research | |
| MarketCap: 10660 Millions | |
| Recent Price: 279.63 Smart Investing & Trading Score: 0 | |
| Day Percent Change: -3.86% Day Change: -11.23 | |
| Week Change: -6.93% Year-to-date Change: -13.4% | |
| BIO Links: Profile News Message Board | |
| Charts:- Daily , Weekly | |
| Add BIO to Watchlist: View: Get Complete BIO Trend Analysis ➞ | |
 | BR Broadridge Financial Solutions, Inc. |
| Sector: Technology | |
| SubSector: Information Technology Services | |
| MarketCap: 10633.8 Millions | |
| Recent Price: 194.97 Smart Investing & Trading Score: 17 | |
| Day Percent Change: 0.78% Day Change: 1.52 | |
| Week Change: -1.94% Year-to-date Change: -5.2% | |
| BR Links: Profile News Message Board | |
| Charts:- Daily , Weekly | |
| Add BR to Watchlist: View: Get Complete BR Trend Analysis ➞ | |
 | MLM Martin Marietta Materials, Inc. |
| Sector: Industrials | |
| SubSector: General Building Materials | |
| MarketCap: 10624.3 Millions | |
| Recent Price: 591.59 Smart Investing & Trading Score: 48 | |
| Day Percent Change: -0.22% Day Change: -1.33 | |
| Week Change: -1.75% Year-to-date Change: 18.6% | |
| MLM Links: Profile News Message Board | |
| Charts:- Daily , Weekly | |
| Add MLM to Watchlist: View: Get Complete MLM Trend Analysis ➞ | |
 | BRO Brown & Brown, Inc. |
| Sector: Financials | |
| SubSector: Insurance Brokers | |
| MarketCap: 10475.7 Millions | |
| Recent Price: 81.62 Smart Investing & Trading Score: 58 | |
| Day Percent Change: 1.24% Day Change: 1.00 | |
| Week Change: -0.34% Year-to-date Change: 14.8% | |
| BRO Links: Profile News Message Board | |
| Charts:- Daily , Weekly | |
| Add BRO to Watchlist: View: Get Complete BRO Trend Analysis ➞ | |
 | HES Hess Corporation |
| Sector: Energy | |
| SubSector: Independent Oil & Gas | |
| MarketCap: 10465.3 Millions | |
| Recent Price: 151.79 Smart Investing & Trading Score: 61 | |
| Day Percent Change: 0.66% Day Change: 0.99 | |
| Week Change: -0.93% Year-to-date Change: 5.3% | |
| HES Links: Profile News Message Board | |
| Charts:- Daily , Weekly | |
| Add HES to Watchlist: View: Get Complete HES Trend Analysis ➞ | |
 | NUE Nucor Corporation |
| Sector: Materials | |
| SubSector: Steel & Iron | |
| MarketCap: 10281.8 Millions | |
| Recent Price: 192.85 Smart Investing & Trading Score: 43 | |
| Day Percent Change: 0.04% Day Change: 0.07 | |
| Week Change: -0.86% Year-to-date Change: 10.8% | |
| NUE Links: Profile News Message Board | |
| Charts:- Daily , Weekly | |
| Add NUE to Watchlist: View: Get Complete NUE Trend Analysis ➞ | |
 | FITB Fifth Third Bancorp |
| Sector: Financials | |
| SubSector: Regional - Midwest Banks | |
| MarketCap: 10197 Millions | |
| Recent Price: 34.47 Smart Investing & Trading Score: 40 | |
| Day Percent Change: 1.09% Day Change: 0.37 | |
| Week Change: -1.12% Year-to-date Change: -0.1% | |
| FITB Links: Profile News Message Board | |
| Charts:- Daily , Weekly | |
| Add FITB to Watchlist: View: Get Complete FITB Trend Analysis ➞ | |
 | UDR UDR, Inc. |
| Sector: Financials | |
| SubSector: REIT - Residential | |
| MarketCap: 10180.1 Millions | |
| Recent Price: 35.84 Smart Investing & Trading Score: 20 | |
| Day Percent Change: 1.41% Day Change: 0.50 | |
| Week Change: -2.18% Year-to-date Change: -6.4% | |
| UDR Links: Profile News Message Board | |
| Charts:- Daily , Weekly | |
| Add UDR to Watchlist: View: Get Complete UDR Trend Analysis ➞ | |
 | EXPD Expeditors International of Washington, Inc. |
| Sector: Transports | |
| SubSector: Air Delivery & Freight Services | |
| MarketCap: 10129.8 Millions | |
| Recent Price: 115.06 Smart Investing & Trading Score: 0 | |
| Day Percent Change: 0.63% Day Change: 0.72 | |
| Week Change: -2.21% Year-to-date Change: -9.6% | |
| EXPD Links: Profile News Message Board | |
| Charts:- Daily , Weekly | |
| Add EXPD to Watchlist: View: Get Complete EXPD Trend Analysis ➞ | |
 | KEY KeyCorp |
| Sector: Financials | |
| SubSector: Regional - Midwest Banks | |
| MarketCap: 10045 Millions | |
| Recent Price: 14.61 Smart Investing & Trading Score: 35 | |
| Day Percent Change: 1.25% Day Change: 0.18 | |
| Week Change: 0% Year-to-date Change: 1.5% | |
| KEY Links: Profile News Message Board | |
| Charts:- Daily , Weekly | |
| Add KEY to Watchlist: View: Get Complete KEY Trend Analysis ➞ | |
 | HEI HEICO Corporation |
| Sector: Industrials | |
| SubSector: Aerospace/Defense Products & Services | |
| MarketCap: 10023.1 Millions | |
| Recent Price: 199.83 Smart Investing & Trading Score: 100 | |
| Day Percent Change: 1.15% Day Change: 2.28 | |
| Week Change: 4.21% Year-to-date Change: 11.7% | |
| HEI Links: Profile News Message Board | |
| Charts:- Daily , Weekly | |
| Add HEI to Watchlist: View: Get Complete HEI Trend Analysis ➞ | |
 | WST West Pharmaceutical Services, Inc. |
| Sector: Health Care | |
| SubSector: Medical Instruments & Supplies | |
| MarketCap: 9989 Millions | |
| Recent Price: 379.07 Smart Investing & Trading Score: 39 | |
| Day Percent Change: 0.45% Day Change: 1.71 | |
| Week Change: -0.24% Year-to-date Change: 7.7% | |
| WST Links: Profile News Message Board | |
| Charts:- Daily , Weekly | |
| Add WST to Watchlist: View: Get Complete WST Trend Analysis ➞ | |
 | NVR NVR, Inc. |
| Sector: Industrials | |
| SubSector: Residential Construction | |
| MarketCap: 9912.56 Millions | |
| Recent Price: 7800.50 Smart Investing & Trading Score: 56 | |
| Day Percent Change: 1.70% Day Change: 130.56 | |
| Week Change: -0.22% Year-to-date Change: 11.4% | |
| NVR Links: Profile News Message Board | |
| Charts:- Daily , Weekly | |
| Add NVR to Watchlist: View: Get Complete NVR Trend Analysis ➞ | |
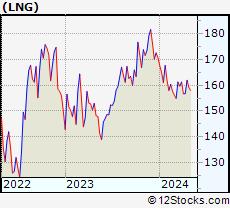 | LNG Cheniere Energy, Inc. |
| Sector: Energy | |
| SubSector: Oil & Gas Pipelines | |
| MarketCap: 9905.15 Millions | |
| Recent Price: 159.53 Smart Investing & Trading Score: 42 | |
| Day Percent Change: 1.73% Day Change: 2.72 | |
| Week Change: 1.74% Year-to-date Change: -6.6% | |
| LNG Links: Profile News Message Board | |
| Charts:- Daily , Weekly | |
| Add LNG to Watchlist: View: Get Complete LNG Trend Analysis ➞ | |
 | SSNC SS&C Technologies Holdings, Inc. |
| Sector: Technology | |
| SubSector: Business Software & Services | |
| MarketCap: 9884.08 Millions | |
| Recent Price: 60.73 Smart Investing & Trading Score: 10 | |
| Day Percent Change: 0.81% Day Change: 0.49 | |
| Week Change: -2.06% Year-to-date Change: -0.6% | |
| SSNC Links: Profile News Message Board | |
| Charts:- Daily , Weekly | |
| Add SSNC to Watchlist: View: Get Complete SSNC Trend Analysis ➞ | |
 | WRB W. R. Berkley Corporation |
| Sector: Financials | |
| SubSector: Property & Casualty Insurance | |
| MarketCap: 9863.82 Millions | |
| Recent Price: 81.30 Smart Investing & Trading Score: 23 | |
| Day Percent Change: 0.72% Day Change: 0.59 | |
| Week Change: -1.04% Year-to-date Change: 15.0% | |
| WRB Links: Profile News Message Board | |
| Charts:- Daily , Weekly | |
| Add WRB to Watchlist: View: Get Complete WRB Trend Analysis ➞ | |
 | BURL Burlington Stores, Inc. |
| Sector: Services & Goods | |
| SubSector: Discount, Variety Stores | |
| MarketCap: 9801.42 Millions | |
| Recent Price: 179.99 Smart Investing & Trading Score: 10 | |
| Day Percent Change: 0.04% Day Change: 0.08 | |
| Week Change: -5.33% Year-to-date Change: -7.5% | |
| BURL Links: Profile News Message Board | |
| Charts:- Daily , Weekly | |
| Add BURL to Watchlist: View: Get Complete BURL Trend Analysis ➞ | |
 | INVH Invitation Homes Inc. |
| Sector: Financials | |
| SubSector: Real Estate Development | |
| MarketCap: 9782.89 Millions | |
| Recent Price: 33.32 Smart Investing & Trading Score: 23 | |
| Day Percent Change: 0.76% Day Change: 0.25 | |
| Week Change: -1.77% Year-to-date Change: -2.3% | |
| INVH Links: Profile News Message Board | |
| Charts:- Daily , Weekly | |
| Add INVH to Watchlist: View: Get Complete INVH Trend Analysis ➞ | |
 | IEX IDEX Corporation |
| Sector: Industrials | |
| SubSector: Diversified Machinery | |
| MarketCap: 9721.46 Millions | |
| Recent Price: 228.54 Smart Investing & Trading Score: 36 | |
| Day Percent Change: 0.75% Day Change: 1.71 | |
| Week Change: -1.78% Year-to-date Change: 5.3% | |
| IEX Links: Profile News Message Board | |
| Charts:- Daily , Weekly | |
| Add IEX to Watchlist: View: Get Complete IEX Trend Analysis ➞ | |
 | TSCO Tractor Supply Company |
| Sector: Services & Goods | |
| SubSector: Specialty Retail, Other | |
| MarketCap: 9692.94 Millions | |
| Recent Price: 248.80 Smart Investing & Trading Score: 68 | |
| Day Percent Change: 0.57% Day Change: 1.41 | |
| Week Change: 1.6% Year-to-date Change: 15.7% | |
| TSCO Links: Profile News Message Board | |
| Charts:- Daily , Weekly | |
| Add TSCO to Watchlist: View: Get Complete TSCO Trend Analysis ➞ | |
 | PATH UiPath Inc. |
| Sector: Technology | |
| SubSector: Software - Infrastructure | |
| MarketCap: 9580 Millions | |
| Recent Price: 19.33 Smart Investing & Trading Score: 10 | |
| Day Percent Change: 1.10% Day Change: 0.21 | |
| Week Change: -6.66% Year-to-date Change: -22.2% | |
| PATH Links: Profile News Message Board | |
| Charts:- Daily , Weekly | |
| Add PATH to Watchlist: View: Get Complete PATH Trend Analysis ➞ | |
 | ELS Equity LifeStyle Properties, Inc. |
| Sector: Financials | |
| SubSector: REIT - Residential | |
| MarketCap: 9570.61 Millions | |
| Recent Price: 62.50 Smart Investing & Trading Score: 42 | |
| Day Percent Change: 1.13% Day Change: 0.70 | |
| Week Change: 2.41% Year-to-date Change: -11.4% | |
| ELS Links: Profile News Message Board | |
| Charts:- Daily , Weekly | |
| Add ELS to Watchlist: View: Get Complete ELS Trend Analysis ➞ | |
 | GDDY GoDaddy Inc. |
| Sector: Technology | |
| SubSector: Internet Software & Services | |
| MarketCap: 9570.51 Millions | |
| Recent Price: 123.46 Smart Investing & Trading Score: 46 | |
| Day Percent Change: 0.90% Day Change: 1.10 | |
| Week Change: 0.13% Year-to-date Change: 16.3% | |
| GDDY Links: Profile News Message Board | |
| Charts:- Daily , Weekly | |
| Add GDDY to Watchlist: View: Get Complete GDDY Trend Analysis ➞ | |
 | WPC W. P. Carey Inc. |
| Sector: Financials | |
| SubSector: REIT - Diversified | |
| MarketCap: 9560.03 Millions | |
| Recent Price: 54.16 Smart Investing & Trading Score: 35 | |
| Day Percent Change: 1.22% Day Change: 0.66 | |
| Week Change: -1.46% Year-to-date Change: -16.4% | |
| WPC Links: Profile News Message Board | |
| Charts:- Daily , Weekly | |
| Add WPC to Watchlist: View: Get Complete WPC Trend Analysis ➞ | |
 | QRVO Qorvo, Inc. |
| Sector: Technology | |
| SubSector: Semiconductor - Broad Line | |
| MarketCap: 9524.32 Millions | |
| Recent Price: 109.36 Smart Investing & Trading Score: 31 | |
| Day Percent Change: -0.54% Day Change: -0.59 | |
| Week Change: -1.8% Year-to-date Change: -2.9% | |
| QRVO Links: Profile News Message Board | |
| Charts:- Daily , Weekly | |
| Add QRVO to Watchlist: View: Get Complete QRVO Trend Analysis ➞ | |
| For tabular summary view of above stock list: Summary View ➞ 0 - 25 , 25 - 50 , 50 - 75 , 75 - 100 , 100 - 125 , 125 - 150 , 150 - 175 , 175 - 200 , 200 - 225 , 225 - 250 , 250 - 275 , 275 - 300 , 300 - 325 , 325 - 350 , 350 - 375 , 375 - 400 , 400 - 425 , 425 - 450 , 450 - 475 , 475 - 500 , 500 - 525 , 525 - 550 , 550 - 575 , 575 - 600 , 600 - 625 , 625 - 650 , 650 - 675 , 675 - 700 | ||
| Click To Change The Sort Order: By Market Cap or Company Size Performance: Year-to-date, Week and Day | |
| Select Chart Type: | ||
|
Best Stocks Today 12Stocks.com |
© 2024 12Stocks.com Terms & Conditions Privacy Contact Us
All Information Provided Only For Education And Not To Be Used For Investing or Trading. See Terms & Conditions


One More Thing ... Get Best Stocks Delivered Daily!
Never Ever Miss A Move With Our Top Ten Stocks Lists
Find Best Stocks In Any Market - Bull or Bear Market
Take A Peek At Our Top Ten Stocks Lists: Daily, Weekly, Year-to-Date & Top Trends
Find Best Stocks In Any Market - Bull or Bear Market
Take A Peek At Our Top Ten Stocks Lists: Daily, Weekly, Year-to-Date & Top Trends
Midcap Stocks With Best Up Trends [0-bearish to 100-bullish]: Genuine Parts[100], Alaska Air[100], United Airlines[100], Medical Properties[100], HEICO [100], Conagra [95], Delta Air[93], Bunge [93], Royal Gold[93], Coupang [90], United [88]
Best Midcap Stocks Year-to-Date:
AppLovin [77.99%], Constellation Energy[59.78%], EMCOR [58.18%], Pure Storage[47.34%], CAVA [44.09%], Natera [43.65%], Williams-Sonoma [41.72%], Wingstop [41.22%], NRG Energy[40.48%], Allison Transmission[38.13%], Robinhood Markets[37.82%] Best Midcap Stocks This Week:
Medical Properties[22.31%], United Airlines[21.81%], Genuine Parts[10.85%], Alaska Air[9.9%], Iridium [8.59%], Advance Auto[8.55%], AMC Entertainment[8.49%], American Airlines[7.91%], Southwest Airlines[6.57%], Cable One[6.09%], agilon health[5.96%] Best Midcap Stocks Daily:
Genuine Parts[11.86%], Iridium [8.42%], Ally Financial[7.80%], Alaska Air[6.25%], Manpower [6.25%], Coinbase Global[5.90%], Ginkgo Bioworks[5.13%], agilon health[4.69%], United Airlines[4.46%], Cable One[4.24%], Rocket [4.17%]