
 Login Sign Up


| |||||
 |  | ||||

| 12Stocks.com Market Intelligence |
Best MidCap Stocks
|
| In a hurry? Mid Cap Stocks Lists: Performance Trends Table, Stock Charts
Sort midcap stocks: Daily, Weekly, Year-to-Date, Market Cap & Trends. Filter midcap stocks list by sector: Show all, Tech, Finance, Energy, Staples, Retail, Industrial, Materials, Utilities and HealthCare Filter midcap stocks list by size:All MidCap Large Mid-Range Small |
| 12Stocks.com Mid Cap Stocks Performances & Trends Daily | |||||||||
|
|  The overall Smart Investing & Trading Score is 63 (0-bearish to 100-bullish) which puts Mid Cap index in short term neutral to bullish trend. The Smart Investing & Trading Score from previous trading session is 44 and an improvement of trend continues.
| ||||||||
Here are the Smart Investing & Trading Scores of the most requested mid cap stocks at 12Stocks.com (click stock name for detailed review):
|


| 12Stocks.com: Top Performing Mid Cap Index Stocks | ||||||||||||||||||||||||||||||||||||||||||||||||
 The top performing Mid Cap Index stocks year to date are
Now, more recently, over last week, the top performing Mid Cap Index stocks on the move are


|
||||||||||||||||||||||||||||||||||||||||||||||||
| 12Stocks.com: Investing in Midcap Index with Stocks | |
|
The following table helps investors and traders sort through current performance and trends (as measured by Smart Investing & Trading Score) of various
stocks in the Midcap Index. Quick View: Move mouse or cursor over stock symbol (ticker) to view short-term technical chart and over stock name to view long term chart. Click on  to add stock symbol to your watchlist and to add stock symbol to your watchlist and  to view watchlist. Click on any ticker or stock name for detailed market intelligence report for that stock. to view watchlist. Click on any ticker or stock name for detailed market intelligence report for that stock. |
12Stocks.com Performance of Stocks in Midcap Index
| Ticker | Stock Name | Watchlist | Category | Recent Price | Smart Investing & Trading Score | Change % | YTD Change% |
| WSM | Williams-Sonoma |   | Services & Goods | 284.69 | 68 | 1.60% | 41.09% |
| TNDM | Tandem Diabetes | | Health Care | 33.59 | 83 | 5.75% | 13.54% |
| AYI | Acuity | | Technology | 253.35 | 63 | 1.50% | 23.69% |
| HLI | Houlihan Lokey | | Financials | 129.02 | 85 | 0.82% | 7.60% |
| JWN | Nordstrom | | Services & Goods | 19.61 | 93 | 4.36% | 6.29% |
| GPK | Graphic Packaging | | Consumer Staples | 27.27 | 61 | -0.46% | 10.61% |
| HUN | Huntsman | | Materials | 24.09 | 42 | -0.23% | -4.16% |
| JBL | Jabil | | Technology | 120.52 | 17 | 1.17% | -5.40% |
| HIW | Highwoods Properties | | Financials | 25.41 | 100 | 2.83% | 10.67% |
| NFG | National Fuel | | Energy | 53.78 | 95 | 0.40% | 7.21% |
| CRI | Carter s | | Consumer Staples | 73.76 | 32 | 2.43% | -1.51% |
| SEB | Seaboard | | Industrials | 3270.45 | 67 | 3.75% | -8.39% |
| FCNCA | First Citizens | | Financials | 1645.22 | 95 | 1.38% | 15.94% |
| RYN | Rayonier | | Industrials | 30.78 | 58 | 0.95% | -7.87% |
| MUSA | Murphy USA | | Services & Goods | 418.40 | 78 | 0.08% | 17.34% |
| SLM | SLM | | Financials | 21.76 | 100 | 2.06% | 13.81% |
| DAR | Darling Ingredients | | Industrials | 43.61 | 55 | 1.70% | -12.50% |
| LOPE | Grand Canyon | | Services & Goods | 129.84 | 40 | 0.69% | -1.67% |
| MIDD | Middleby | | Industrials | 144.98 | 68 | 2.15% | -1.49% |
| KSS | Kohl s | | Services & Goods | 25.74 | 69 | 4.21% | -10.25% |
| LAZ | Lazard | | Financials | 39.56 | 75 | 2.74% | 13.66% |
| HRB | H&R Block | | Services & Goods | 47.45 | 90 | 0.36% | -1.90% |
| TPL | Texas Pacific | | Financials | 584.51 | 42 | -0.22% | -62.83% |
| SLGN | Silgan | | Consumer Staples | 47.35 | 61 | 0.66% | 4.64% |
| FANG | Diamondback Energy | | Energy | 201.78 | 61 | -0.39% | 30.11% |
| For chart view version of above stock list: Chart View ➞ 0 - 25 , 25 - 50 , 50 - 75 , 75 - 100 , 100 - 125 , 125 - 150 , 150 - 175 , 175 - 200 | ||
 | Click To Change The Sort Order: By Market Cap or Company Size Performance: Year-to-date, Week and Day |  |
|
Get the most comprehensive stock market coverage daily at 12Stocks.com ➞ Best Stocks Today ➞ Best Stocks Weekly ➞ Best Stocks Year-to-Date ➞ Best Stocks Trends ➞  Best Stocks Today 12Stocks.com Best Nasdaq Stocks ➞ Best S&P 500 Stocks ➞ Best Tech Stocks ➞ Best Biotech Stocks ➞ |
| Detailed Overview of Midcap Stocks |
| Midcap Technical Overview, Leaders & Laggards, Top Midcap ETF Funds & Detailed Midcap Stocks List, Charts, Trends & More |
| Midcap: Technical Analysis, Trends & YTD Performance | |
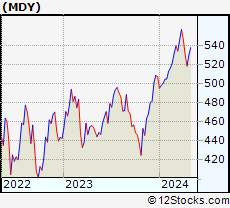
| MidCap segment as represented by
MDY, an exchange-traded fund [ETF], holds basket of about four hundred midcap stocks from across all major sectors of the US stock market. The midcap index (contains stocks like Green Mountain Coffee Roasters and Tractor Supply Company) is up by 4.36% and is currently underperforming the overall market by -1.13% year-to-date. Below is a quick view of technical charts and trends: | |
 MDY Weekly Chart |
|
| Long Term Trend: Very Good | |
| Medium Term Trend: Not Good | |
 MDY Daily Chart |
|
| Short Term Trend: Very Good | |
| Overall Trend Score: 63 | |
| YTD Performance: 4.36% | |
| **Trend Scores & Views Are Only For Educational Purposes And Not For Investing | |
| 12Stocks.com: Investing in Midcap Index using Exchange Traded Funds | |
|
The following table shows list of key exchange traded funds (ETF) that
help investors track Midcap index. The following list also includes leveraged ETF funds that track twice or thrice the daily returns of Midcap indices. Short or inverse ETF funds move in the opposite direction to the index they track and are useful during market pullbacks or during bear markets. Quick View: Move mouse or cursor over ETF symbol (ticker) to view short-term technical chart and over ETF name to view long term chart. Click on ticker or stock name for detailed view. Click on to add stock symbol to your watchlist and to view watchlist. |
12Stocks.com List of ETFs that track Midcap Index
| Ticker | ETF Name | Watchlist | Recent Price | Smart Investing & Trading Score | Change % | Week % | Year-to-date % |
| IJH | iShares Core S&P Mid-Cap | | 57.81 | 68 | 1.76 | 2.18 | 4.3% |
| IWR | iShares Russell Mid-Cap | | 80.22 | 63 | 1.05 | 1.98 | 3.2% |
| MDY | SPDR S&P MidCap 400 ETF | | 529.49 | 63 | 1.14 | 2.16 | 4.36% |
| IJK | iShares S&P Mid-Cap 400 Growth | | 86.84 | 63 | 1.47 | 2.35 | 9.62% |
| IWP | iShares Russell Mid-Cap Growth | | 108.34 | 58 | 1.53 | 2.5 | 3.71% |
| IWS | iShares Russell Mid-Cap Value | | 119.73 | 68 | 0.78 | 1.77 | 2.96% |
| IJJ | iShares S&P Mid-Cap 400 Value | | 112.69 | 63 | 1.03 | 1.93 | -1.19% |
| UMDD | ProShares UltraPro MidCap400 | | 24.02 | 63 | 3.65 | 6.44 | 7.59% |
| SMDD | ProShares UltraPro Short MidCap400 | | 11.78 | 32 | -2.72 | -6.22 | -12.5% |
| XMLV | PowerShares S&P MidCap Low Volatil ETF | | 54.96 | 75 | 0.77 | 1.48 | 3.35% |
| MZZ | ProShares UltraShort MidCap400 | | 11.63 | 27 | -2.76 | -4.44 | -7.48% |
| MVV | ProShares Ultra MidCap400 | | 61.70 | 68 | 2.34 | 4.58 | 6.58% |
| MYY | ProShares Short MidCap400 | | 20.89 | 32 | -0.38 | -1.41 | -2.63% |
| 12Stocks.com: Charts, Trends, Fundamental Data and Performances of MidCap Stocks | |
|
We now take in-depth look at all MidCap stocks including charts, multi-period performances and overall trends (as measured by Smart Investing & Trading Score). One can sort MidCap stocks (click link to choose) by Daily, Weekly and by Year-to-Date performances. Also, one can sort by size of the company or by market capitalization. |
| Select Your Default Chart Type: | |||||
| |||||
| Click on stock symbol or name for detailed view. Click on to add stock symbol to your watchlist and to view watchlist. Quick View: Move mouse or cursor over "Daily" to quickly view daily technical stock chart and over "Weekly" to view weekly technical stock chart. | |||||

 | WSM Williams-Sonoma, Inc. |
| Sector: Services & Goods | |
| SubSector: Home Furnishing Stores | |
| MarketCap: 3370.05 Millions | |
| Recent Price: 284.69 Smart Investing & Trading Score: 68 | |
| Day Percent Change: 1.60% Day Change: 4.47 | |
| Week Change: 1.97% Year-to-date Change: 41.1% | |
| WSM Links: Profile News Message Board | |
| Charts:- Daily , Weekly | |
| Add WSM to Watchlist: View: Get Complete WSM Trend Analysis ➞ | |
 | TNDM Tandem Diabetes Care, Inc. |
| Sector: Health Care | |
| SubSector: Medical Instruments & Supplies | |
| MarketCap: 3359.1 Millions | |
| Recent Price: 33.59 Smart Investing & Trading Score: 83 | |
| Day Percent Change: 5.75% Day Change: 1.82 | |
| Week Change: 10.37% Year-to-date Change: 13.5% | |
| TNDM Links: Profile News Message Board | |
| Charts:- Daily , Weekly | |
| Add TNDM to Watchlist: View: Get Complete TNDM Trend Analysis ➞ | |
 | AYI Acuity Brands, Inc. |
| Sector: Technology | |
| SubSector: Diversified Electronics | |
| MarketCap: 3356.66 Millions | |
| Recent Price: 253.35 Smart Investing & Trading Score: 63 | |
| Day Percent Change: 1.50% Day Change: 3.75 | |
| Week Change: 2.55% Year-to-date Change: 23.7% | |
| AYI Links: Profile News Message Board | |
| Charts:- Daily , Weekly | |
| Add AYI to Watchlist: View: Get Complete AYI Trend Analysis ➞ | |
 | HLI Houlihan Lokey, Inc. |
| Sector: Financials | |
| SubSector: Investment Brokerage - National | |
| MarketCap: 3352.65 Millions | |
| Recent Price: 129.02 Smart Investing & Trading Score: 85 | |
| Day Percent Change: 0.82% Day Change: 1.05 | |
| Week Change: 4.24% Year-to-date Change: 7.6% | |
| HLI Links: Profile News Message Board | |
| Charts:- Daily , Weekly | |
| Add HLI to Watchlist: View: Get Complete HLI Trend Analysis ➞ | |
 | JWN Nordstrom, Inc. |
| Sector: Services & Goods | |
| SubSector: Apparel Stores | |
| MarketCap: 3351.68 Millions | |
| Recent Price: 19.61 Smart Investing & Trading Score: 93 | |
| Day Percent Change: 4.36% Day Change: 0.82 | |
| Week Change: 3.65% Year-to-date Change: 6.3% | |
| JWN Links: Profile News Message Board | |
| Charts:- Daily , Weekly | |
| Add JWN to Watchlist: View: Get Complete JWN Trend Analysis ➞ | |
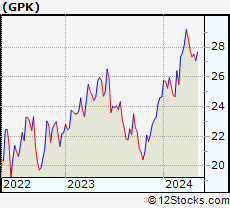 | GPK Graphic Packaging Holding Company |
| Sector: Consumer Staples | |
| SubSector: Packaging & Containers | |
| MarketCap: 3350.23 Millions | |
| Recent Price: 27.27 Smart Investing & Trading Score: 61 | |
| Day Percent Change: -0.46% Day Change: -0.13 | |
| Week Change: -0.31% Year-to-date Change: 10.6% | |
| GPK Links: Profile News Message Board | |
| Charts:- Daily , Weekly | |
| Add GPK to Watchlist: View: Get Complete GPK Trend Analysis ➞ | |
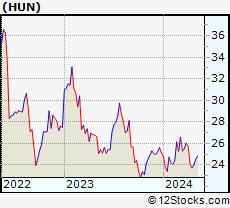 | HUN Huntsman Corporation |
| Sector: Materials | |
| SubSector: Chemicals - Major Diversified | |
| MarketCap: 3304.06 Millions | |
| Recent Price: 24.09 Smart Investing & Trading Score: 42 | |
| Day Percent Change: -0.23% Day Change: -0.05 | |
| Week Change: 1.54% Year-to-date Change: -4.2% | |
| HUN Links: Profile News Message Board | |
| Charts:- Daily , Weekly | |
| Add HUN to Watchlist: View: Get Complete HUN Trend Analysis ➞ | |
 | JBL Jabil Inc. |
| Sector: Technology | |
| SubSector: Printed Circuit Boards | |
| MarketCap: 3272.15 Millions | |
| Recent Price: 120.52 Smart Investing & Trading Score: 17 | |
| Day Percent Change: 1.17% Day Change: 1.39 | |
| Week Change: 1.49% Year-to-date Change: -5.4% | |
| JBL Links: Profile News Message Board | |
| Charts:- Daily , Weekly | |
| Add JBL to Watchlist: View: Get Complete JBL Trend Analysis ➞ | |
 | HIW Highwoods Properties, Inc. |
| Sector: Financials | |
| SubSector: REIT - Office | |
| MarketCap: 3227.46 Millions | |
| Recent Price: 25.41 Smart Investing & Trading Score: 100 | |
| Day Percent Change: 2.83% Day Change: 0.70 | |
| Week Change: 5.09% Year-to-date Change: 10.7% | |
| HIW Links: Profile News Message Board | |
| Charts:- Daily , Weekly | |
| Add HIW to Watchlist: View: Get Complete HIW Trend Analysis ➞ | |
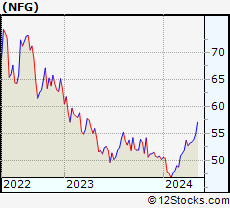 | NFG National Fuel Gas Company |
| Sector: Energy | |
| SubSector: Independent Oil & Gas | |
| MarketCap: 3197.73 Millions | |
| Recent Price: 53.78 Smart Investing & Trading Score: 95 | |
| Day Percent Change: 0.40% Day Change: 0.21 | |
| Week Change: 0.66% Year-to-date Change: 7.2% | |
| NFG Links: Profile News Message Board | |
| Charts:- Daily , Weekly | |
| Add NFG to Watchlist: View: Get Complete NFG Trend Analysis ➞ | |
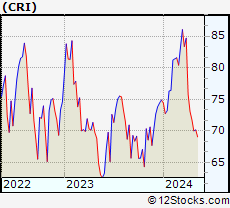 | CRI Carter s, Inc. |
| Sector: Consumer Staples | |
| SubSector: Textile - Apparel Clothing | |
| MarketCap: 3173.55 Millions | |
| Recent Price: 73.76 Smart Investing & Trading Score: 32 | |
| Day Percent Change: 2.43% Day Change: 1.75 | |
| Week Change: 2.8% Year-to-date Change: -1.5% | |
| CRI Links: Profile News Message Board | |
| Charts:- Daily , Weekly | |
| Add CRI to Watchlist: View: Get Complete CRI Trend Analysis ➞ | |
 | SEB Seaboard Corporation |
| Sector: Industrials | |
| SubSector: Conglomerates | |
| MarketCap: 3161.78 Millions | |
| Recent Price: 3270.45 Smart Investing & Trading Score: 67 | |
| Day Percent Change: 3.75% Day Change: 118.20 | |
| Week Change: 1.27% Year-to-date Change: -8.4% | |
| SEB Links: Profile News Message Board | |
| Charts:- Daily , Weekly | |
| Add SEB to Watchlist: View: Get Complete SEB Trend Analysis ➞ | |
 | FCNCA First Citizens BancShares, Inc. |
| Sector: Financials | |
| SubSector: Regional - Mid-Atlantic Banks | |
| MarketCap: 3157.19 Millions | |
| Recent Price: 1645.22 Smart Investing & Trading Score: 95 | |
| Day Percent Change: 1.38% Day Change: 22.47 | |
| Week Change: 4.97% Year-to-date Change: 15.9% | |
| FCNCA Links: Profile News Message Board | |
| Charts:- Daily , Weekly | |
| Add FCNCA to Watchlist: View: Get Complete FCNCA Trend Analysis ➞ | |
 | RYN Rayonier Inc. |
| Sector: Industrials | |
| SubSector: Lumber, Wood Production | |
| MarketCap: 3143 Millions | |
| Recent Price: 30.78 Smart Investing & Trading Score: 58 | |
| Day Percent Change: 0.95% Day Change: 0.29 | |
| Week Change: 1.42% Year-to-date Change: -7.9% | |
| RYN Links: Profile News Message Board | |
| Charts:- Daily , Weekly | |
| Add RYN to Watchlist: View: Get Complete RYN Trend Analysis ➞ | |
 | MUSA Murphy USA Inc. |
| Sector: Services & Goods | |
| SubSector: Specialty Retail, Other | |
| MarketCap: 3133.14 Millions | |
| Recent Price: 418.40 Smart Investing & Trading Score: 78 | |
| Day Percent Change: 0.08% Day Change: 0.33 | |
| Week Change: 0.28% Year-to-date Change: 17.3% | |
| MUSA Links: Profile News Message Board | |
| Charts:- Daily , Weekly | |
| Add MUSA to Watchlist: View: Get Complete MUSA Trend Analysis ➞ | |
 | SLM SLM Corporation |
| Sector: Financials | |
| SubSector: Credit Services | |
| MarketCap: 3099.78 Millions | |
| Recent Price: 21.76 Smart Investing & Trading Score: 100 | |
| Day Percent Change: 2.06% Day Change: 0.44 | |
| Week Change: 3.18% Year-to-date Change: 13.8% | |
| SLM Links: Profile News Message Board | |
| Charts:- Daily , Weekly | |
| Add SLM to Watchlist: View: Get Complete SLM Trend Analysis ➞ | |
 | DAR Darling Ingredients Inc. |
| Sector: Industrials | |
| SubSector: Waste Management | |
| MarketCap: 3075.28 Millions | |
| Recent Price: 43.61 Smart Investing & Trading Score: 55 | |
| Day Percent Change: 1.70% Day Change: 0.73 | |
| Week Change: 2.35% Year-to-date Change: -12.5% | |
| DAR Links: Profile News Message Board | |
| Charts:- Daily , Weekly | |
| Add DAR to Watchlist: View: Get Complete DAR Trend Analysis ➞ | |
 | LOPE Grand Canyon Education, Inc. |
| Sector: Services & Goods | |
| SubSector: Education & Training Services | |
| MarketCap: 3073.56 Millions | |
| Recent Price: 129.84 Smart Investing & Trading Score: 40 | |
| Day Percent Change: 0.69% Day Change: 0.90 | |
| Week Change: 2.11% Year-to-date Change: -1.7% | |
| LOPE Links: Profile News Message Board | |
| Charts:- Daily , Weekly | |
| Add LOPE to Watchlist: View: Get Complete LOPE Trend Analysis ➞ | |
 | MIDD The Middleby Corporation |
| Sector: Industrials | |
| SubSector: Diversified Machinery | |
| MarketCap: 3070.36 Millions | |
| Recent Price: 144.98 Smart Investing & Trading Score: 68 | |
| Day Percent Change: 2.15% Day Change: 3.05 | |
| Week Change: 1.67% Year-to-date Change: -1.5% | |
| MIDD Links: Profile News Message Board | |
| Charts:- Daily , Weekly | |
| Add MIDD to Watchlist: View: Get Complete MIDD Trend Analysis ➞ | |
 | KSS Kohl s Corporation |
| Sector: Services & Goods | |
| SubSector: Department Stores | |
| MarketCap: 3068 Millions | |
| Recent Price: 25.74 Smart Investing & Trading Score: 69 | |
| Day Percent Change: 4.21% Day Change: 1.04 | |
| Week Change: 11% Year-to-date Change: -10.3% | |
| KSS Links: Profile News Message Board | |
| Charts:- Daily , Weekly | |
| Add KSS to Watchlist: View: Get Complete KSS Trend Analysis ➞ | |
 | LAZ Lazard Ltd |
| Sector: Financials | |
| SubSector: Asset Management | |
| MarketCap: 3061.13 Millions | |
| Recent Price: 39.56 Smart Investing & Trading Score: 75 | |
| Day Percent Change: 2.74% Day Change: 1.05 | |
| Week Change: 4.34% Year-to-date Change: 13.7% | |
| LAZ Links: Profile News Message Board | |
| Charts:- Daily , Weekly | |
| Add LAZ to Watchlist: View: Get Complete LAZ Trend Analysis ➞ | |
 | HRB H&R Block, Inc. |
| Sector: Services & Goods | |
| SubSector: Personal Services | |
| MarketCap: 3052.45 Millions | |
| Recent Price: 47.45 Smart Investing & Trading Score: 90 | |
| Day Percent Change: 0.36% Day Change: 0.17 | |
| Week Change: 1.3% Year-to-date Change: -1.9% | |
| HRB Links: Profile News Message Board | |
| Charts:- Daily , Weekly | |
| Add HRB to Watchlist: View: Get Complete HRB Trend Analysis ➞ | |
 | TPL Texas Pacific Land Trust |
| Sector: Financials | |
| SubSector: Real Estate Development | |
| MarketCap: 3052.29 Millions | |
| Recent Price: 584.51 Smart Investing & Trading Score: 42 | |
| Day Percent Change: -0.22% Day Change: -1.30 | |
| Week Change: 0.33% Year-to-date Change: -62.8% | |
| TPL Links: Profile News Message Board | |
| Charts:- Daily , Weekly | |
| Add TPL to Watchlist: View: Get Complete TPL Trend Analysis ➞ | |
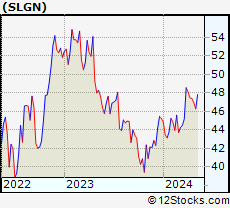 | SLGN Silgan Holdings Inc. |
| Sector: Consumer Staples | |
| SubSector: Packaging & Containers | |
| MarketCap: 3046.23 Millions | |
| Recent Price: 47.35 Smart Investing & Trading Score: 61 | |
| Day Percent Change: 0.66% Day Change: 0.31 | |
| Week Change: -0.11% Year-to-date Change: 4.6% | |
| SLGN Links: Profile News Message Board | |
| Charts:- Daily , Weekly | |
| Add SLGN to Watchlist: View: Get Complete SLGN Trend Analysis ➞ | |
 | FANG Diamondback Energy, Inc. |
| Sector: Energy | |
| SubSector: Independent Oil & Gas | |
| MarketCap: 3009.13 Millions | |
| Recent Price: 201.78 Smart Investing & Trading Score: 61 | |
| Day Percent Change: -0.39% Day Change: -0.80 | |
| Week Change: 0.52% Year-to-date Change: 30.1% | |
| FANG Links: Profile News Message Board | |
| Charts:- Daily , Weekly | |
| Add FANG to Watchlist: View: Get Complete FANG Trend Analysis ➞ | |
| For tabular summary view of above stock list: Summary View ➞ 0 - 25 , 25 - 50 , 50 - 75 , 75 - 100 , 100 - 125 , 125 - 150 , 150 - 175 , 175 - 200 | ||
| Click To Change The Sort Order: By Market Cap or Company Size Performance: Year-to-date, Week and Day | |
| Select Chart Type: | ||
|
Best Stocks Today 12Stocks.com |
© 2024 12Stocks.com Terms & Conditions Privacy Contact Us
All Information Provided Only For Education And Not To Be Used For Investing or Trading. See Terms & Conditions


One More Thing ... Get Best Stocks Delivered Daily!
Never Ever Miss A Move With Our Top Ten Stocks Lists
Find Best Stocks In Any Market - Bull or Bear Market
Take A Peek At Our Top Ten Stocks Lists: Daily, Weekly, Year-to-Date & Top Trends
Find Best Stocks In Any Market - Bull or Bear Market
Take A Peek At Our Top Ten Stocks Lists: Daily, Weekly, Year-to-Date & Top Trends
Midcap Stocks With Best Up Trends [0-bearish to 100-bullish]: Ryder System[100], Quest Diagnostics[100], RLI [100], Popular [100], HEICO [100], Highwoods Properties[100], BOK Financial[100], Formula One[100], Kirby [100], BioMarin Pharmaceutical[100], Generac [100]
Best Midcap Stocks Year-to-Date:
AppLovin [78.09%], Constellation Energy[59.81%], EMCOR [57.06%], Natera [45.83%], Pure Storage[45.04%], Williams-Sonoma [41.09%], CAVA [40.77%], Wingstop [40.54%], Robinhood Markets[39.59%], DICK S[39.31%], Coupang [39.07%] Best Midcap Stocks This Week:
Coinbase Global[12.08%], Kohl s[11%], Tandem Diabetes[10.37%], Ryder System[10.34%], AMC Entertainment[9.65%], Repligen [9.19%], New York[7.97%], Enphase Energy[7.28%], Natera [7.11%], Wayfair [6.89%], Confluent [6.88%] Best Midcap Stocks Daily:
Ryder System[10.05%], Repligen [8.96%], Sunrun [7.86%], Ginkgo Bioworks[7.58%], Viasat [6.51%], Tandem Diabetes[5.75%], Plug Power[5.62%], Roblox [5.23%], Crane Co[5.01%], Confluent [5.01%], Bruker [4.93%]