
 Login Sign Up


| |||||
 |  | ||||

| 12Stocks.com Market Intelligence |
Best MidCap Stocks
|
| In a hurry? Mid Cap Stocks Lists: Performance Trends Table, Stock Charts
Sort midcap stocks: Daily, Weekly, Year-to-Date, Market Cap & Trends. Filter midcap stocks list by sector: Show all, Tech, Finance, Energy, Staples, Retail, Industrial, Materials, Utilities and HealthCare Filter midcap stocks list by size:All MidCap Large Mid-Range Small |
| 12Stocks.com Mid Cap Stocks Performances & Trends Daily | |||||||||
|
|  The overall Smart Investing & Trading Score is 44 (0-bearish to 100-bullish) which puts Mid Cap index in short term neutral trend. The Smart Investing & Trading Score from previous trading session is 36 and hence an improvement of trend.
| ||||||||
Here are the Smart Investing & Trading Scores of the most requested mid cap stocks at 12Stocks.com (click stock name for detailed review):
|


| 12Stocks.com: Top Performing Mid Cap Index Stocks | ||||||||||||||||||||||||||||||||||||||||||||||||
 The top performing Mid Cap Index stocks year to date are
Now, more recently, over last week, the top performing Mid Cap Index stocks on the move are


|
||||||||||||||||||||||||||||||||||||||||||||||||
| 12Stocks.com: Investing in Midcap Index with Stocks | |
|
The following table helps investors and traders sort through current performance and trends (as measured by Smart Investing & Trading Score) of various
stocks in the Midcap Index. Quick View: Move mouse or cursor over stock symbol (ticker) to view short-term technical chart and over stock name to view long term chart. Click on  to add stock symbol to your watchlist and to add stock symbol to your watchlist and  to view watchlist. Click on any ticker or stock name for detailed market intelligence report for that stock. to view watchlist. Click on any ticker or stock name for detailed market intelligence report for that stock. |
12Stocks.com Performance of Stocks in Midcap Index
| Ticker | Stock Name | Watchlist | Category | Recent Price | Smart Investing & Trading Score | Change % | YTD Change% |
| RJF | Raymond James |   | Financials | 123.60 | 68 | 1.34% | 10.85% |
| BEN | Franklin Resources | | Financials | 25.15 | 32 | 0.52% | -15.58% |
| SYF | Synchrony Financial | | Financials | 41.57 | 68 | 1.89% | 8.85% |
| DFS | Discover Financial | | Financials | 125.35 | 68 | 0.87% | 11.52% |
| NLY | Annaly Capital | | Financials | 18.23 | 32 | 1.33% | -5.89% |
| CNA | CNA Financial | | Financials | 44.44 | 73 | 2.54% | 5.03% |
| RF | Regions Financial | | Financials | 18.90 | 54 | -0.53% | -2.48% |
| CBOE | Cboe Global | | Financials | 180.40 | 42 | 1.58% | 1.03% |
| TPG | TPG | | Financials | 42.48 | 44 | -1.11% | -1.81% |
| MPW | Medical Properties | | Financials | 4.42 | 48 | -11.42% | -9.98% |
| HBAN | Huntington Bancshares | | Financials | 13.28 | 68 | 0.76% | 4.40% |
| HST | Host Hotels | | Financials | 18.71 | 10 | 0.65% | -3.90% |
| CFG | Citizens Financial | | Financials | 33.99 | 68 | 3.31% | 2.56% |
| PFG | Pripal Financial | | Financials | 80.44 | 68 | 1.87% | 2.25% |
| SOFI | SoFi Technologies | | Financials | 7.11 | 10 | -2.94% | -27.82% |
| WU | Western Union | | Financials | 13.02 | 63 | 0.70% | 9.23% |
| GL | Globe Life | | Financials | 66.74 | 32 | 2.68% | -45.17% |
| CPT | Camden Property | | Financials | 96.29 | 68 | 1.05% | -3.02% |
| VICI | VICI Properties | | Financials | 27.89 | 32 | 1.34% | -12.52% |
| CG | Carlyle | | Financials | 44.08 | 41 | 0.92% | 8.33% |
| AGNC | AGNC | | Financials | 9.15 | 37 | 0.99% | -6.73% |
| COLD | Americold Realty | | Financials | 22.84 | 0 | 0.48% | -24.55% |
| FNF | Fidelity National | | Financials | 48.77 | 32 | 2.50% | -4.41% |
| OHI | Omega | | Financials | 30.42 | 58 | 1.47% | -0.78% |
| KRC | Kilroy Realty | | Financials | 33.09 | 32 | 1.29% | -16.94% |
| For chart view version of above stock list: Chart View ➞ 0 - 25 , 25 - 50 , 50 - 75 , 75 - 100 , 100 - 125 , 125 - 150 , 150 - 175 | ||
 | Click To Change The Sort Order: By Market Cap or Company Size Performance: Year-to-date, Week and Day |  |
|
Get the most comprehensive stock market coverage daily at 12Stocks.com ➞ Best Stocks Today ➞ Best Stocks Weekly ➞ Best Stocks Year-to-Date ➞ Best Stocks Trends ➞  Best Stocks Today 12Stocks.com Best Nasdaq Stocks ➞ Best S&P 500 Stocks ➞ Best Tech Stocks ➞ Best Biotech Stocks ➞ |
| Detailed Overview of Midcap Stocks |
| Midcap Technical Overview, Leaders & Laggards, Top Midcap ETF Funds & Detailed Midcap Stocks List, Charts, Trends & More |
| Midcap: Technical Analysis, Trends & YTD Performance | |
| MidCap segment as represented by
MDY, an exchange-traded fund [ETF], holds basket of about four hundred midcap stocks from across all major sectors of the US stock market. The midcap index (contains stocks like Green Mountain Coffee Roasters and Tractor Supply Company) is up by 2.15% and is currently underperforming the overall market by -1.23% year-to-date. Below is a quick view of technical charts and trends: | |
 MDY Weekly Chart |
|
| Long Term Trend: Good | |
| Medium Term Trend: Not Good | |
 MDY Daily Chart |
|
| Short Term Trend: Deteriorating | |
| Overall Trend Score: 44 | |
| YTD Performance: 2.15% | |
| **Trend Scores & Views Are Only For Educational Purposes And Not For Investing | |
| 12Stocks.com: Investing in Midcap Index using Exchange Traded Funds | |
|
The following table shows list of key exchange traded funds (ETF) that
help investors track Midcap index. The following list also includes leveraged ETF funds that track twice or thrice the daily returns of Midcap indices. Short or inverse ETF funds move in the opposite direction to the index they track and are useful during market pullbacks or during bear markets. Quick View: Move mouse or cursor over ETF symbol (ticker) to view short-term technical chart and over ETF name to view long term chart. Click on ticker or stock name for detailed view. Click on to add stock symbol to your watchlist and to view watchlist. |
12Stocks.com List of ETFs that track Midcap Index
| Ticker | ETF Name | Watchlist | Recent Price | Smart Investing & Trading Score | Change % | Week % | Year-to-date % |
| IJH | iShares Core S&P Mid-Cap | | 56.58 | 36 | 0.27 | -2.26 | 2.07% |
| IWR | iShares Russell Mid-Cap | | 78.66 | 36 | -0.06 | -2.43 | 1.2% |
| IWP | iShares Russell Mid-Cap Growth | | 105.70 | 36 | -0.75 | -3.77 | 1.19% |
| MDY | SPDR S&P MidCap 400 ETF | | 518.28 | 44 | 0.33 | -2.2 | 2.15% |
| IWS | iShares Russell Mid-Cap Value | | 117.65 | 41 | 0.29 | -1.87 | 1.17% |
| IJK | iShares S&P Mid-Cap 400 Growth | | 84.85 | 36 | -0.21 | -3.01 | 7.11% |
| IJJ | iShares S&P Mid-Cap 400 Value | | 110.55 | 17 | 1.00 | -1.29 | -3.06% |
| XMLV | PowerShares S&P MidCap Low Volatil ETF | | 54.16 | 53 | 1.06 | -0.17 | 1.84% |
| MVV | ProShares Ultra MidCap400 | | 59.00 | 36 | 0.99 | -4.42 | 1.92% |
| SMDD | ProShares UltraPro Short MidCap400 | | 12.69 | 59 | -0.01 | 7.99 | -5.75% |
| MZZ | ProShares UltraShort MidCap400 | | 12.21 | 34 | -0.16 | 5.26 | -2.87% |
| UMDD | ProShares UltraPro MidCap400 | | 22.28 | 36 | -0.13 | -7.83 | -0.18% |
| MYY | ProShares Short MidCap400 | | 21.23 | 69 | -0.14 | 2.55 | -1.05% |
| 12Stocks.com: Charts, Trends, Fundamental Data and Performances of MidCap Stocks | |
|
We now take in-depth look at all MidCap stocks including charts, multi-period performances and overall trends (as measured by Smart Investing & Trading Score). One can sort MidCap stocks (click link to choose) by Daily, Weekly and by Year-to-Date performances. Also, one can sort by size of the company or by market capitalization. |
| Select Your Default Chart Type: | |||||
| |||||
| Click on stock symbol or name for detailed view. Click on to add stock symbol to your watchlist and to view watchlist. Quick View: Move mouse or cursor over "Daily" to quickly view daily technical stock chart and over "Weekly" to view weekly technical stock chart. | |||||

 | RJF Raymond James Financial, Inc. |
| Sector: Financials | |
| SubSector: Investment Brokerage - Regional | |
| MarketCap: 9490.65 Millions | |
| Recent Price: 123.60 Smart Investing & Trading Score: 68 | |
| Day Percent Change: 1.34% Day Change: 1.64 | |
| Week Change: 0.86% Year-to-date Change: 10.9% | |
| RJF Links: Profile News Message Board | |
| Charts:- Daily , Weekly | |
| Add RJF to Watchlist: View: Get Complete RJF Trend Analysis ➞ | |
 | BEN Franklin Resources, Inc. |
| Sector: Financials | |
| SubSector: Asset Management | |
| MarketCap: 9419.73 Millions | |
| Recent Price: 25.15 Smart Investing & Trading Score: 32 | |
| Day Percent Change: 0.52% Day Change: 0.13 | |
| Week Change: -1.02% Year-to-date Change: -15.6% | |
| BEN Links: Profile News Message Board | |
| Charts:- Daily , Weekly | |
| Add BEN to Watchlist: View: Get Complete BEN Trend Analysis ➞ | |
 | SYF Synchrony Financial |
| Sector: Financials | |
| SubSector: Credit Services | |
| MarketCap: 9297.28 Millions | |
| Recent Price: 41.57 Smart Investing & Trading Score: 68 | |
| Day Percent Change: 1.89% Day Change: 0.77 | |
| Week Change: 2.87% Year-to-date Change: 8.9% | |
| SYF Links: Profile News Message Board | |
| Charts:- Daily , Weekly | |
| Add SYF to Watchlist: View: Get Complete SYF Trend Analysis ➞ | |
 | DFS Discover Financial Services |
| Sector: Financials | |
| SubSector: Credit Services | |
| MarketCap: 9228.88 Millions | |
| Recent Price: 125.35 Smart Investing & Trading Score: 68 | |
| Day Percent Change: 0.87% Day Change: 1.08 | |
| Week Change: 3.67% Year-to-date Change: 11.5% | |
| DFS Links: Profile News Message Board | |
| Charts:- Daily , Weekly | |
| Add DFS to Watchlist: View: Get Complete DFS Trend Analysis ➞ | |
 | NLY Annaly Capital Management, Inc. |
| Sector: Financials | |
| SubSector: Mortgage Investment | |
| MarketCap: 9127.79 Millions | |
| Recent Price: 18.23 Smart Investing & Trading Score: 32 | |
| Day Percent Change: 1.33% Day Change: 0.24 | |
| Week Change: -1.14% Year-to-date Change: -5.9% | |
| NLY Links: Profile News Message Board | |
| Charts:- Daily , Weekly | |
| Add NLY to Watchlist: View: Get Complete NLY Trend Analysis ➞ | |
 | CNA CNA Financial Corporation |
| Sector: Financials | |
| SubSector: Property & Casualty Insurance | |
| MarketCap: 9123.32 Millions | |
| Recent Price: 44.44 Smart Investing & Trading Score: 73 | |
| Day Percent Change: 2.54% Day Change: 1.10 | |
| Week Change: 2.54% Year-to-date Change: 5.0% | |
| CNA Links: Profile News Message Board | |
| Charts:- Daily , Weekly | |
| Add CNA to Watchlist: View: Get Complete CNA Trend Analysis ➞ | |
 | RF Regions Financial Corporation |
| Sector: Financials | |
| SubSector: Regional - Southeast Banks | |
| MarketCap: 8936.25 Millions | |
| Recent Price: 18.90 Smart Investing & Trading Score: 54 | |
| Day Percent Change: -0.53% Day Change: -0.10 | |
| Week Change: -1.51% Year-to-date Change: -2.5% | |
| RF Links: Profile News Message Board | |
| Charts:- Daily , Weekly | |
| Add RF to Watchlist: View: Get Complete RF Trend Analysis ➞ | |
 | CBOE Cboe Global Markets, Inc. |
| Sector: Financials | |
| SubSector: Diversified Investments | |
| MarketCap: 8834.5 Millions | |
| Recent Price: 180.40 Smart Investing & Trading Score: 42 | |
| Day Percent Change: 1.58% Day Change: 2.80 | |
| Week Change: 1.06% Year-to-date Change: 1.0% | |
| CBOE Links: Profile News Message Board | |
| Charts:- Daily , Weekly | |
| Add CBOE to Watchlist: View: Get Complete CBOE Trend Analysis ➞ | |
 | TPG TPG Inc. |
| Sector: Financials | |
| SubSector: Asset Management | |
| MarketCap: 8700 Millions | |
| Recent Price: 42.48 Smart Investing & Trading Score: 44 | |
| Day Percent Change: -1.11% Day Change: -0.48 | |
| Week Change: -1.92% Year-to-date Change: -1.8% | |
| TPG Links: Profile News Message Board | |
| Charts:- Daily , Weekly | |
| Add TPG to Watchlist: View: Get Complete TPG Trend Analysis ➞ | |
 | MPW Medical Properties Trust, Inc. |
| Sector: Financials | |
| SubSector: REIT - Healthcare Facilities | |
| MarketCap: 8586.74 Millions | |
| Recent Price: 4.42 Smart Investing & Trading Score: 48 | |
| Day Percent Change: -11.42% Day Change: -0.57 | |
| Week Change: 10.78% Year-to-date Change: -10.0% | |
| MPW Links: Profile News Message Board | |
| Charts:- Daily , Weekly | |
| Add MPW to Watchlist: View: Get Complete MPW Trend Analysis ➞ | |
 | HBAN Huntington Bancshares Incorporated |
| Sector: Financials | |
| SubSector: Regional - Midwest Banks | |
| MarketCap: 8468.1 Millions | |
| Recent Price: 13.28 Smart Investing & Trading Score: 68 | |
| Day Percent Change: 0.76% Day Change: 0.10 | |
| Week Change: -0.23% Year-to-date Change: 4.4% | |
| HBAN Links: Profile News Message Board | |
| Charts:- Daily , Weekly | |
| Add HBAN to Watchlist: View: Get Complete HBAN Trend Analysis ➞ | |
 | HST Host Hotels & Resorts, Inc. |
| Sector: Financials | |
| SubSector: REIT - Hotel/Motel | |
| MarketCap: 8253.74 Millions | |
| Recent Price: 18.71 Smart Investing & Trading Score: 10 | |
| Day Percent Change: 0.65% Day Change: 0.12 | |
| Week Change: -6.45% Year-to-date Change: -3.9% | |
| HST Links: Profile News Message Board | |
| Charts:- Daily , Weekly | |
| Add HST to Watchlist: View: Get Complete HST Trend Analysis ➞ | |
 | CFG Citizens Financial Group, Inc. |
| Sector: Financials | |
| SubSector: Regional - Mid-Atlantic Banks | |
| MarketCap: 8225.19 Millions | |
| Recent Price: 33.99 Smart Investing & Trading Score: 68 | |
| Day Percent Change: 3.31% Day Change: 1.09 | |
| Week Change: 2.56% Year-to-date Change: 2.6% | |
| CFG Links: Profile News Message Board | |
| Charts:- Daily , Weekly | |
| Add CFG to Watchlist: View: Get Complete CFG Trend Analysis ➞ | |
 | PFG Principal Financial Group, Inc. |
| Sector: Financials | |
| SubSector: Life Insurance | |
| MarketCap: 8178.86 Millions | |
| Recent Price: 80.44 Smart Investing & Trading Score: 68 | |
| Day Percent Change: 1.87% Day Change: 1.48 | |
| Week Change: 0.78% Year-to-date Change: 2.3% | |
| PFG Links: Profile News Message Board | |
| Charts:- Daily , Weekly | |
| Add PFG to Watchlist: View: Get Complete PFG Trend Analysis ➞ | |
 | SOFI SoFi Technologies, Inc. |
| Sector: Financials | |
| SubSector: Credit Services | |
| MarketCap: 7990 Millions | |
| Recent Price: 7.11 Smart Investing & Trading Score: 10 | |
| Day Percent Change: -2.94% Day Change: -0.21 | |
| Week Change: -3% Year-to-date Change: -27.8% | |
| SOFI Links: Profile News Message Board | |
| Charts:- Daily , Weekly | |
| Add SOFI to Watchlist: View: Get Complete SOFI Trend Analysis ➞ | |
 | WU The Western Union Company |
| Sector: Financials | |
| SubSector: Credit Services | |
| MarketCap: 7974.48 Millions | |
| Recent Price: 13.02 Smart Investing & Trading Score: 63 | |
| Day Percent Change: 0.70% Day Change: 0.09 | |
| Week Change: -1.29% Year-to-date Change: 9.2% | |
| WU Links: Profile News Message Board | |
| Charts:- Daily , Weekly | |
| Add WU to Watchlist: View: Get Complete WU Trend Analysis ➞ | |
 | GL Globe Life Inc. |
| Sector: Financials | |
| SubSector: Life Insurance | |
| MarketCap: 7596.46 Millions | |
| Recent Price: 66.74 Smart Investing & Trading Score: 32 | |
| Day Percent Change: 2.68% Day Change: 1.74 | |
| Week Change: 12.95% Year-to-date Change: -45.2% | |
| GL Links: Profile News Message Board | |
| Charts:- Daily , Weekly | |
| Add GL to Watchlist: View: Get Complete GL Trend Analysis ➞ | |
 | CPT Camden Property Trust |
| Sector: Financials | |
| SubSector: REIT - Residential | |
| MarketCap: 7535.21 Millions | |
| Recent Price: 96.29 Smart Investing & Trading Score: 68 | |
| Day Percent Change: 1.05% Day Change: 1.00 | |
| Week Change: -1.68% Year-to-date Change: -3.0% | |
| CPT Links: Profile News Message Board | |
| Charts:- Daily , Weekly | |
| Add CPT to Watchlist: View: Get Complete CPT Trend Analysis ➞ | |
 | VICI VICI Properties Inc. |
| Sector: Financials | |
| SubSector: REIT - Diversified | |
| MarketCap: 7327.03 Millions | |
| Recent Price: 27.89 Smart Investing & Trading Score: 32 | |
| Day Percent Change: 1.34% Day Change: 0.37 | |
| Week Change: -0.18% Year-to-date Change: -12.5% | |
| VICI Links: Profile News Message Board | |
| Charts:- Daily , Weekly | |
| Add VICI to Watchlist: View: Get Complete VICI Trend Analysis ➞ | |
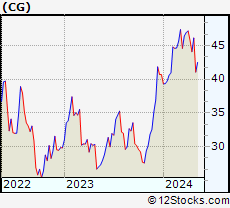 | CG The Carlyle Group Inc. |
| Sector: Financials | |
| SubSector: Asset Management | |
| MarketCap: 7269.33 Millions | |
| Recent Price: 44.08 Smart Investing & Trading Score: 41 | |
| Day Percent Change: 0.92% Day Change: 0.40 | |
| Week Change: -3.73% Year-to-date Change: 8.3% | |
| CG Links: Profile News Message Board | |
| Charts:- Daily , Weekly | |
| Add CG to Watchlist: View: Get Complete CG Trend Analysis ➞ | |
 | AGNC AGNC Investment Corp. |
| Sector: Financials | |
| SubSector: Mortgage Investment | |
| MarketCap: 6622.19 Millions | |
| Recent Price: 9.15 Smart Investing & Trading Score: 37 | |
| Day Percent Change: 0.99% Day Change: 0.09 | |
| Week Change: -1.72% Year-to-date Change: -6.7% | |
| AGNC Links: Profile News Message Board | |
| Charts:- Daily , Weekly | |
| Add AGNC to Watchlist: View: Get Complete AGNC Trend Analysis ➞ | |
 | COLD Americold Realty Trust |
| Sector: Financials | |
| SubSector: REIT - Industrial | |
| MarketCap: 6569.69 Millions | |
| Recent Price: 22.84 Smart Investing & Trading Score: 0 | |
| Day Percent Change: 0.48% Day Change: 0.11 | |
| Week Change: -4.59% Year-to-date Change: -24.6% | |
| COLD Links: Profile News Message Board | |
| Charts:- Daily , Weekly | |
| Add COLD to Watchlist: View: Get Complete COLD Trend Analysis ➞ | |
 | FNF Fidelity National Financial, Inc. |
| Sector: Financials | |
| SubSector: Surety & Title Insurance | |
| MarketCap: 6532.18 Millions | |
| Recent Price: 48.77 Smart Investing & Trading Score: 32 | |
| Day Percent Change: 2.50% Day Change: 1.19 | |
| Week Change: 0.33% Year-to-date Change: -4.4% | |
| FNF Links: Profile News Message Board | |
| Charts:- Daily , Weekly | |
| Add FNF to Watchlist: View: Get Complete FNF Trend Analysis ➞ | |
 | OHI Omega Healthcare Investors, Inc. |
| Sector: Financials | |
| SubSector: REIT - Healthcare Facilities | |
| MarketCap: 6433.84 Millions | |
| Recent Price: 30.42 Smart Investing & Trading Score: 58 | |
| Day Percent Change: 1.47% Day Change: 0.44 | |
| Week Change: -0.26% Year-to-date Change: -0.8% | |
| OHI Links: Profile News Message Board | |
| Charts:- Daily , Weekly | |
| Add OHI to Watchlist: View: Get Complete OHI Trend Analysis ➞ | |
 | KRC Kilroy Realty Corporation |
| Sector: Financials | |
| SubSector: REIT - Office | |
| MarketCap: 6390.46 Millions | |
| Recent Price: 33.09 Smart Investing & Trading Score: 32 | |
| Day Percent Change: 1.29% Day Change: 0.42 | |
| Week Change: -1.14% Year-to-date Change: -16.9% | |
| KRC Links: Profile News Message Board | |
| Charts:- Daily , Weekly | |
| Add KRC to Watchlist: View: Get Complete KRC Trend Analysis ➞ | |
| For tabular summary view of above stock list: Summary View ➞ 0 - 25 , 25 - 50 , 50 - 75 , 75 - 100 , 100 - 125 , 125 - 150 , 150 - 175 | ||
| Click To Change The Sort Order: By Market Cap or Company Size Performance: Year-to-date, Week and Day | |
| Select Chart Type: | ||
|
Best Stocks Today 12Stocks.com |
© 2024 12Stocks.com Terms & Conditions Privacy Contact Us
All Information Provided Only For Education And Not To Be Used For Investing or Trading. See Terms & Conditions


One More Thing ... Get Best Stocks Delivered Daily!
Never Ever Miss A Move With Our Top Ten Stocks Lists
Find Best Stocks In Any Market - Bull or Bear Market
Take A Peek At Our Top Ten Stocks Lists: Daily, Weekly, Year-to-Date & Top Trends
Find Best Stocks In Any Market - Bull or Bear Market
Take A Peek At Our Top Ten Stocks Lists: Daily, Weekly, Year-to-Date & Top Trends
Midcap Stocks With Best Up Trends [0-bearish to 100-bullish]: UGI [100], Entergy [100], Bunge [100], Flowers Foods[100], Tyson Foods[100], Genuine Parts[100], Wendy s[100], Alaska Air[100], Consolidated Edison[100], Conagra [100], United Airlines[100]
Best Midcap Stocks Year-to-Date:
ShockWave Medical[72.66%], Vistra Energy[70.46%], AppLovin [67.86%], Constellation Energy[54.47%], EMCOR [52.55%], Spotify [46.79%], Pure Storage[38.7%], Williams-Sonoma [38.37%], CAVA [37.24%], Natera [36.14%], Coupang [35.86%] Best Midcap Stocks This Week:
United Airlines[22.92%], AMC Entertainment[19.25%], Globe Life[12.95%], Genuine Parts[11.7%], Advance Auto[11.62%], Iridium [11.07%], Medical Properties[10.78%], agilon health[10.3%], UGI [9.72%], Alaska Air[8.98%], Flowers Foods[8.66%] Best Midcap Stocks Daily:
AMC Entertainment[8.22%], UGI [8.20%], Hawaiian Electric[6.86%], Fifth Third[5.93%], Iridium [5.14%], agilon health[4.10%], SSR Mining[3.99%], Walgreens Boots[3.70%], Darling Ingredients[3.47%], Citizens Financial[3.31%], J. M.[3.29%]