
 Login Sign Up


| |||||
 |  | ||||

| 12Stocks.com Market Intelligence |
Best MidCap Stocks
|
| In a hurry? Mid Cap Stocks Lists: Performance Trends Table, Stock Charts
Sort midcap stocks: Daily, Weekly, Year-to-Date, Market Cap & Trends. Filter midcap stocks list by sector: Show all, Tech, Finance, Energy, Staples, Retail, Industrial, Materials, Utilities and HealthCare Filter midcap stocks list by size:All MidCap Large Mid-Range Small |
| 12Stocks.com Mid Cap Stocks Performances & Trends Daily | |||||||||
|
|  The overall Smart Investing & Trading Score is 26 (0-bearish to 100-bullish) which puts Mid Cap index in short term bearish to neutral trend. The Smart Investing & Trading Score from previous trading session is 31 and a deterioration of trend continues.
| ||||||||
Here are the Smart Investing & Trading Scores of the most requested mid cap stocks at 12Stocks.com (click stock name for detailed review):
|


| 12Stocks.com: Top Performing Mid Cap Index Stocks | ||||||||||||||||||||||||||||||||||||||||||||||||
 The top performing Mid Cap Index stocks year to date are
Now, more recently, over last week, the top performing Mid Cap Index stocks on the move are


|
||||||||||||||||||||||||||||||||||||||||||||||||
| 12Stocks.com: Investing in Midcap Index with Stocks | |
|
The following table helps investors and traders sort through current performance and trends (as measured by Smart Investing & Trading Score) of various
stocks in the Midcap Index. Quick View: Move mouse or cursor over stock symbol (ticker) to view short-term technical chart and over stock name to view long term chart. Click on  to add stock symbol to your watchlist and to add stock symbol to your watchlist and  to view watchlist. Click on any ticker or stock name for detailed market intelligence report for that stock. to view watchlist. Click on any ticker or stock name for detailed market intelligence report for that stock. |
12Stocks.com Performance of Stocks in Midcap Index
| Ticker | Stock Name | Watchlist | Category | Recent Price | Smart Investing & Trading Score | Change % | YTD Change% |
| GXO | GXO Logistics |   | Industrials | 48.85 | 0 | -2.16% | -20.21% |
| IRM | Iron Mountain | | Technology | 75.15 | 43 | 0.59% | 7.39% |
| VICI | VICI Properties | | Financials | 27.20 | 7 | 0.18% | -14.68% |
| AGL | agilon health | | Health Care | 5.01 | 52 | 11.83% | -60.40% |
| RCL | Royal Caribbean | | Services & Goods | 127.97 | 38 | 1.08% | -1.17% |
| PTON | Peloton Interactive | | Consumer Staples | 3.09 | 5 | 0.00% | -49.26% |
| HII | Huntington Ingalls | | Industrials | 271.22 | 36 | -1.01% | 4.46% |
| CG | Carlyle | | Financials | 44.63 | 38 | -0.95% | 9.68% |
| MOH | Molina | | Health Care | 359.85 | 43 | 0.69% | -0.40% |
| UHS | Universal Health | | Health Care | 160.03 | 13 | -0.85% | 4.98% |
| SCI | Service | | Services & Goods | 68.51 | 26 | -1.13% | 0.09% |
| CCK | Crown | | Consumer Staples | 76.43 | 10 | -0.71% | -17.01% |
| CNM | Core & Main | | Industrials | 54.77 | 38 | -1.24% | 35.17% |
| NDSN | Nordson | | Industrials | 260.80 | 26 | -0.71% | -1.27% |
| GWRE | Guidewire Software | | Technology | 108.34 | 0 | -0.89% | -0.64% |
| NET | Cloudflare | | Technology | 88.00 | 26 | -3.34% | 5.69% |
| ICLR | ICON Public | | Health Care | 292.02 | 36 | -0.68% | 3.16% |
| DT | Dynatrace | | Technology | 44.43 | 17 | -0.20% | -18.76% |
| CCCS | CCC Intelligent | | Technology | 11.43 | 33 | -0.95% | 0.75% |
| TECH | Bio-Techne | | Health Care | 62.73 | 10 | -2.00% | -18.70% |
| AVTR | Avantor | | Materials | 24.38 | 36 | -0.89% | 6.79% |
| DOX | Amdocs | | Technology | 84.93 | 10 | 0.13% | -3.37% |
| RPM | RPM | | Materials | 107.36 | 30 | -0.49% | -3.83% |
| HSIC | Henry Schein | | Services & Goods | 70.20 | 0 | -1.43% | -7.28% |
| IONS | Ionis | | Health Care | 40.91 | 10 | -1.52% | -19.13% |
| For chart view version of above stock list: Chart View ➞ 0 - 25 , 25 - 50 , 50 - 75 , 75 - 100 , 100 - 125 , 125 - 150 , 150 - 175 , 175 - 200 , 200 - 225 , 225 - 250 , 250 - 275 , 275 - 300 , 300 - 325 , 325 - 350 , 350 - 375 , 375 - 400 , 400 - 425 , 425 - 450 , 450 - 475 , 475 - 500 , 500 - 525 , 525 - 550 , 550 - 575 , 575 - 600 , 600 - 625 , 625 - 650 , 650 - 675 , 675 - 700 , 700 - 725 , 725 - 750 , 750 - 775 | ||
 | Click To Change The Sort Order: By Market Cap or Company Size Performance: Year-to-date, Week and Day |  |
|
Get the most comprehensive stock market coverage daily at 12Stocks.com ➞ Best Stocks Today ➞ Best Stocks Weekly ➞ Best Stocks Year-to-Date ➞ Best Stocks Trends ➞  Best Stocks Today 12Stocks.com Best Nasdaq Stocks ➞ Best S&P 500 Stocks ➞ Best Tech Stocks ➞ Best Biotech Stocks ➞ |
| Detailed Overview of Midcap Stocks |
| Midcap Technical Overview, Leaders & Laggards, Top Midcap ETF Funds & Detailed Midcap Stocks List, Charts, Trends & More |
| Midcap: Technical Analysis, Trends & YTD Performance | |
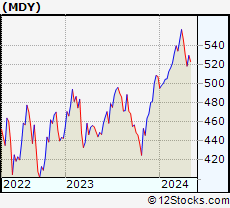
| MidCap segment as represented by
MDY, an exchange-traded fund [ETF], holds basket of about four hundred midcap stocks from across all major sectors of the US stock market. The midcap index (contains stocks like Green Mountain Coffee Roasters and Tractor Supply Company) is up by 1.95% and is currently underperforming the overall market by -2.46% year-to-date. Below is a quick view of technical charts and trends: | |
 MDY Weekly Chart |
|
| Long Term Trend: Good | |
| Medium Term Trend: Not Good | |
 MDY Daily Chart |
|
| Short Term Trend: Not Good | |
| Overall Trend Score: 26 | |
| YTD Performance: 1.95% | |
| **Trend Scores & Views Are Only For Educational Purposes And Not For Investing | |
| 12Stocks.com: Investing in Midcap Index using Exchange Traded Funds | |
|
The following table shows list of key exchange traded funds (ETF) that
help investors track Midcap index. The following list also includes leveraged ETF funds that track twice or thrice the daily returns of Midcap indices. Short or inverse ETF funds move in the opposite direction to the index they track and are useful during market pullbacks or during bear markets. Quick View: Move mouse or cursor over ETF symbol (ticker) to view short-term technical chart and over ETF name to view long term chart. Click on ticker or stock name for detailed view. Click on to add stock symbol to your watchlist and to view watchlist. |
12Stocks.com List of ETFs that track Midcap Index
| Ticker | ETF Name | Watchlist | Recent Price | Smart Investing & Trading Score | Change % | Week % | Year-to-date % |
| IJH | iShares Core S&P Mid-Cap | | 56.51 | 26 | -0.65 | -2.38 | 1.95% |
| IWR | iShares Russell Mid-Cap | | 78.82 | 33 | -0.35 | -2.23 | 1.4% |
| IWP | iShares Russell Mid-Cap Growth | | 107.02 | 26 | -0.67 | -2.57 | 2.45% |
| MDY | SPDR S&P MidCap 400 ETF | | 517.25 | 26 | -0.84 | -2.39 | 1.95% |
| IJK | iShares S&P Mid-Cap 400 Growth | | 85.34 | 31 | -0.88 | -2.45 | 7.73% |
| IWS | iShares Russell Mid-Cap Value | | 117.41 | 38 | -0.10 | -2.07 | 0.96% |
| IJJ | iShares S&P Mid-Cap 400 Value | | 109.44 | 0 | -0.69 | -2.28 | -4.03% |
| XMLV | PowerShares S&P MidCap Low Volatil ETF | | 53.37 | 36 | -0.58 | -1.62 | 0.36% |
| MVV | ProShares Ultra MidCap400 | | 58.83 | 26 | -1.97 | -4.7 | 1.62% |
| UMDD | ProShares UltraPro MidCap400 | | 22.45 | 26 | -2.52 | -7.12 | 0.58% |
| SMDD | ProShares UltraPro Short MidCap400 | | 12.54 | 57 | 2.20 | 6.72 | -6.86% |
| MZZ | ProShares UltraShort MidCap400 | | 12.07 | 34 | 0.72 | 4.01 | -4.02% |
| MYY | ProShares Short MidCap400 | | 21.21 | 74 | 0.90 | 2.46 | -1.14% |
| 12Stocks.com: Charts, Trends, Fundamental Data and Performances of MidCap Stocks | |
|
We now take in-depth look at all MidCap stocks including charts, multi-period performances and overall trends (as measured by Smart Investing & Trading Score). One can sort MidCap stocks (click link to choose) by Daily, Weekly and by Year-to-Date performances. Also, one can sort by size of the company or by market capitalization. |
| Select Your Default Chart Type: | |||||
| |||||
| Click on stock symbol or name for detailed view. Click on to add stock symbol to your watchlist and to view watchlist. Quick View: Move mouse or cursor over "Daily" to quickly view daily technical stock chart and over "Weekly" to view weekly technical stock chart. | |||||

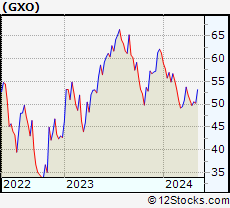 | GXO GXO Logistics, Inc. |
| Sector: Industrials | |
| SubSector: Integrated Freight & Logistics | |
| MarketCap: 7340 Millions | |
| Recent Price: 48.85 Smart Investing & Trading Score: 0 | |
| Day Percent Change: -2.16% Day Change: -1.08 | |
| Week Change: -3.97% Year-to-date Change: -20.2% | |
| GXO Links: Profile News Message Board | |
| Charts:- Daily , Weekly | |
| Add GXO to Watchlist: View: Get Complete GXO Trend Analysis ➞ | |
 | IRM Iron Mountain Incorporated |
| Sector: Technology | |
| SubSector: Business Software & Services | |
| MarketCap: 7339.18 Millions | |
| Recent Price: 75.15 Smart Investing & Trading Score: 43 | |
| Day Percent Change: 0.59% Day Change: 0.44 | |
| Week Change: -1.14% Year-to-date Change: 7.4% | |
| IRM Links: Profile News Message Board | |
| Charts:- Daily , Weekly | |
| Add IRM to Watchlist: View: Get Complete IRM Trend Analysis ➞ | |
 | VICI VICI Properties Inc. |
| Sector: Financials | |
| SubSector: REIT - Diversified | |
| MarketCap: 7327.03 Millions | |
| Recent Price: 27.20 Smart Investing & Trading Score: 7 | |
| Day Percent Change: 0.18% Day Change: 0.05 | |
| Week Change: -2.65% Year-to-date Change: -14.7% | |
| VICI Links: Profile News Message Board | |
| Charts:- Daily , Weekly | |
| Add VICI to Watchlist: View: Get Complete VICI Trend Analysis ➞ | |
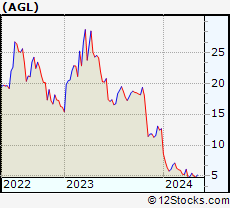 | AGL agilon health, inc. |
| Sector: Health Care | |
| SubSector: Medical Care Facilities | |
| MarketCap: 7310 Millions | |
| Recent Price: 5.01 Smart Investing & Trading Score: 52 | |
| Day Percent Change: 11.83% Day Change: 0.53 | |
| Week Change: 1.21% Year-to-date Change: -60.4% | |
| AGL Links: Profile News Message Board | |
| Charts:- Daily , Weekly | |
| Add AGL to Watchlist: View: Get Complete AGL Trend Analysis ➞ | |
 | RCL Royal Caribbean Cruises Ltd. |
| Sector: Services & Goods | |
| SubSector: Resorts & Casinos | |
| MarketCap: 7294.14 Millions | |
| Recent Price: 127.97 Smart Investing & Trading Score: 38 | |
| Day Percent Change: 1.08% Day Change: 1.37 | |
| Week Change: 0.23% Year-to-date Change: -1.2% | |
| RCL Links: Profile News Message Board | |
| Charts:- Daily , Weekly | |
| Add RCL to Watchlist: View: Get Complete RCL Trend Analysis ➞ | |
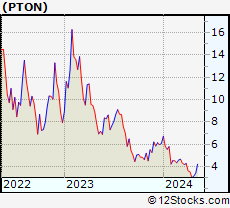 | PTON Peloton Interactive, Inc. |
| Sector: Consumer Staples | |
| SubSector: Sporting Goods | |
| MarketCap: 7282.44 Millions | |
| Recent Price: 3.09 Smart Investing & Trading Score: 5 | |
| Day Percent Change: 0.00% Day Change: 0.00 | |
| Week Change: -12.96% Year-to-date Change: -49.3% | |
| PTON Links: Profile News Message Board | |
| Charts:- Daily , Weekly | |
| Add PTON to Watchlist: View: Get Complete PTON Trend Analysis ➞ | |
 | HII Huntington Ingalls Industries, Inc. |
| Sector: Industrials | |
| SubSector: Aerospace/Defense Products & Services | |
| MarketCap: 7276.11 Millions | |
| Recent Price: 271.22 Smart Investing & Trading Score: 36 | |
| Day Percent Change: -1.01% Day Change: -2.78 | |
| Week Change: -1.63% Year-to-date Change: 4.5% | |
| HII Links: Profile News Message Board | |
| Charts:- Daily , Weekly | |
| Add HII to Watchlist: View: Get Complete HII Trend Analysis ➞ | |
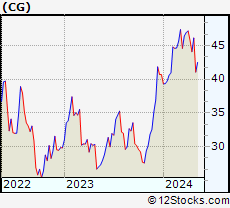 | CG The Carlyle Group Inc. |
| Sector: Financials | |
| SubSector: Asset Management | |
| MarketCap: 7269.33 Millions | |
| Recent Price: 44.63 Smart Investing & Trading Score: 38 | |
| Day Percent Change: -0.95% Day Change: -0.43 | |
| Week Change: -2.53% Year-to-date Change: 9.7% | |
| CG Links: Profile News Message Board | |
| Charts:- Daily , Weekly | |
| Add CG to Watchlist: View: Get Complete CG Trend Analysis ➞ | |
 | MOH Molina Healthcare, Inc. |
| Sector: Health Care | |
| SubSector: Health Care Plans | |
| MarketCap: 7235.6 Millions | |
| Recent Price: 359.85 Smart Investing & Trading Score: 43 | |
| Day Percent Change: 0.69% Day Change: 2.46 | |
| Week Change: -4.44% Year-to-date Change: -0.4% | |
| MOH Links: Profile News Message Board | |
| Charts:- Daily , Weekly | |
| Add MOH to Watchlist: View: Get Complete MOH Trend Analysis ➞ | |
 | UHS Universal Health Services, Inc. |
| Sector: Health Care | |
| SubSector: Hospitals | |
| MarketCap: 7217.66 Millions | |
| Recent Price: 160.03 Smart Investing & Trading Score: 13 | |
| Day Percent Change: -0.85% Day Change: -1.38 | |
| Week Change: -4.05% Year-to-date Change: 5.0% | |
| UHS Links: Profile News Message Board | |
| Charts:- Daily , Weekly | |
| Add UHS to Watchlist: View: Get Complete UHS Trend Analysis ➞ | |
 | SCI Service Corporation International |
| Sector: Services & Goods | |
| SubSector: Personal Services | |
| MarketCap: 7216.05 Millions | |
| Recent Price: 68.51 Smart Investing & Trading Score: 26 | |
| Day Percent Change: -1.13% Day Change: -0.78 | |
| Week Change: -1.86% Year-to-date Change: 0.1% | |
| SCI Links: Profile News Message Board | |
| Charts:- Daily , Weekly | |
| Add SCI to Watchlist: View: Get Complete SCI Trend Analysis ➞ | |
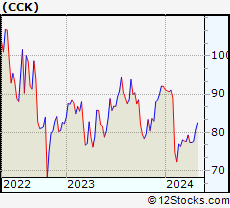 | CCK Crown Holdings, Inc. |
| Sector: Consumer Staples | |
| SubSector: Packaging & Containers | |
| MarketCap: 7198.03 Millions | |
| Recent Price: 76.43 Smart Investing & Trading Score: 10 | |
| Day Percent Change: -0.71% Day Change: -0.55 | |
| Week Change: -1.14% Year-to-date Change: -17.0% | |
| CCK Links: Profile News Message Board | |
| Charts:- Daily , Weekly | |
| Add CCK to Watchlist: View: Get Complete CCK Trend Analysis ➞ | |
 | CNM Core & Main, Inc. |
| Sector: Industrials | |
| SubSector: Industrial Distribution | |
| MarketCap: 7150 Millions | |
| Recent Price: 54.77 Smart Investing & Trading Score: 38 | |
| Day Percent Change: -1.24% Day Change: -0.69 | |
| Week Change: -2.79% Year-to-date Change: 35.2% | |
| CNM Links: Profile News Message Board | |
| Charts:- Daily , Weekly | |
| Add CNM to Watchlist: View: Get Complete CNM Trend Analysis ➞ | |
 | NDSN Nordson Corporation |
| Sector: Industrials | |
| SubSector: Diversified Machinery | |
| MarketCap: 7117.56 Millions | |
| Recent Price: 260.80 Smart Investing & Trading Score: 26 | |
| Day Percent Change: -0.71% Day Change: -1.86 | |
| Week Change: -1.45% Year-to-date Change: -1.3% | |
| NDSN Links: Profile News Message Board | |
| Charts:- Daily , Weekly | |
| Add NDSN to Watchlist: View: Get Complete NDSN Trend Analysis ➞ | |
 | GWRE Guidewire Software, Inc. |
| Sector: Technology | |
| SubSector: Business Software & Services | |
| MarketCap: 7073.18 Millions | |
| Recent Price: 108.34 Smart Investing & Trading Score: 0 | |
| Day Percent Change: -0.89% Day Change: -0.97 | |
| Week Change: -2.62% Year-to-date Change: -0.6% | |
| GWRE Links: Profile News Message Board | |
| Charts:- Daily , Weekly | |
| Add GWRE to Watchlist: View: Get Complete GWRE Trend Analysis ➞ | |
 | NET Cloudflare, Inc. |
| Sector: Technology | |
| SubSector: Application Software | |
| MarketCap: 7063.72 Millions | |
| Recent Price: 88.00 Smart Investing & Trading Score: 26 | |
| Day Percent Change: -3.34% Day Change: -3.04 | |
| Week Change: -6.14% Year-to-date Change: 5.7% | |
| NET Links: Profile News Message Board | |
| Charts:- Daily , Weekly | |
| Add NET to Watchlist: View: Get Complete NET Trend Analysis ➞ | |
 | ICLR ICON Public Limited Company |
| Sector: Health Care | |
| SubSector: Medical Laboratories & Research | |
| MarketCap: 7011 Millions | |
| Recent Price: 292.02 Smart Investing & Trading Score: 36 | |
| Day Percent Change: -0.68% Day Change: -2.01 | |
| Week Change: -4.57% Year-to-date Change: 3.2% | |
| ICLR Links: Profile News Message Board | |
| Charts:- Daily , Weekly | |
| Add ICLR to Watchlist: View: Get Complete ICLR Trend Analysis ➞ | |
 | DT Dynatrace, Inc. |
| Sector: Technology | |
| SubSector: Application Software | |
| MarketCap: 7007.12 Millions | |
| Recent Price: 44.43 Smart Investing & Trading Score: 17 | |
| Day Percent Change: -0.20% Day Change: -0.09 | |
| Week Change: -3.1% Year-to-date Change: -18.8% | |
| DT Links: Profile News Message Board | |
| Charts:- Daily , Weekly | |
| Add DT to Watchlist: View: Get Complete DT Trend Analysis ➞ | |
 | CCCS CCC Intelligent Solutions Holdings Inc. |
| Sector: Technology | |
| SubSector: Software - Infrastructure | |
| MarketCap: 6990 Millions | |
| Recent Price: 11.43 Smart Investing & Trading Score: 33 | |
| Day Percent Change: -0.95% Day Change: -0.11 | |
| Week Change: -2.39% Year-to-date Change: 0.8% | |
| CCCS Links: Profile News Message Board | |
| Charts:- Daily , Weekly | |
| Add CCCS to Watchlist: View: Get Complete CCCS Trend Analysis ➞ | |
 | TECH Bio-Techne Corporation |
| Sector: Health Care | |
| SubSector: Biotechnology | |
| MarketCap: 6958.05 Millions | |
| Recent Price: 62.73 Smart Investing & Trading Score: 10 | |
| Day Percent Change: -2.00% Day Change: -1.28 | |
| Week Change: -5.99% Year-to-date Change: -18.7% | |
| TECH Links: Profile News Message Board | |
| Charts:- Daily , Weekly | |
| Add TECH to Watchlist: View: Get Complete TECH Trend Analysis ➞ | |
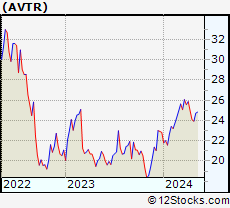 | AVTR Avantor, Inc. |
| Sector: Materials | |
| SubSector: Specialty Chemicals | |
| MarketCap: 6954 Millions | |
| Recent Price: 24.38 Smart Investing & Trading Score: 36 | |
| Day Percent Change: -0.89% Day Change: -0.22 | |
| Week Change: -2.32% Year-to-date Change: 6.8% | |
| AVTR Links: Profile News Message Board | |
| Charts:- Daily , Weekly | |
| Add AVTR to Watchlist: View: Get Complete AVTR Trend Analysis ➞ | |
 | DOX Amdocs Limited |
| Sector: Technology | |
| SubSector: Business Software & Services | |
| MarketCap: 6895.48 Millions | |
| Recent Price: 84.93 Smart Investing & Trading Score: 10 | |
| Day Percent Change: 0.13% Day Change: 0.11 | |
| Week Change: -0.91% Year-to-date Change: -3.4% | |
| DOX Links: Profile News Message Board | |
| Charts:- Daily , Weekly | |
| Add DOX to Watchlist: View: Get Complete DOX Trend Analysis ➞ | |
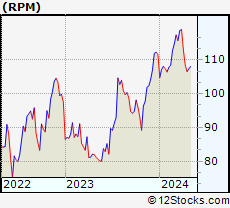 | RPM RPM International Inc. |
| Sector: Materials | |
| SubSector: Specialty Chemicals | |
| MarketCap: 6814.87 Millions | |
| Recent Price: 107.36 Smart Investing & Trading Score: 30 | |
| Day Percent Change: -0.49% Day Change: -0.53 | |
| Week Change: -1.01% Year-to-date Change: -3.8% | |
| RPM Links: Profile News Message Board | |
| Charts:- Daily , Weekly | |
| Add RPM to Watchlist: View: Get Complete RPM Trend Analysis ➞ | |
 | HSIC Henry Schein, Inc. |
| Sector: Services & Goods | |
| SubSector: Medical Equipment Wholesale | |
| MarketCap: 6760.9 Millions | |
| Recent Price: 70.20 Smart Investing & Trading Score: 0 | |
| Day Percent Change: -1.43% Day Change: -1.02 | |
| Week Change: -1.14% Year-to-date Change: -7.3% | |
| HSIC Links: Profile News Message Board | |
| Charts:- Daily , Weekly | |
| Add HSIC to Watchlist: View: Get Complete HSIC Trend Analysis ➞ | |
 | IONS Ionis Pharmaceuticals, Inc. |
| Sector: Health Care | |
| SubSector: Biotechnology | |
| MarketCap: 6725.05 Millions | |
| Recent Price: 40.91 Smart Investing & Trading Score: 10 | |
| Day Percent Change: -1.52% Day Change: -0.63 | |
| Week Change: -1.99% Year-to-date Change: -19.1% | |
| IONS Links: Profile News Message Board | |
| Charts:- Daily , Weekly | |
| Add IONS to Watchlist: View: Get Complete IONS Trend Analysis ➞ | |
| For tabular summary view of above stock list: Summary View ➞ 0 - 25 , 25 - 50 , 50 - 75 , 75 - 100 , 100 - 125 , 125 - 150 , 150 - 175 , 175 - 200 , 200 - 225 , 225 - 250 , 250 - 275 , 275 - 300 , 300 - 325 , 325 - 350 , 350 - 375 , 375 - 400 , 400 - 425 , 425 - 450 , 450 - 475 , 475 - 500 , 500 - 525 , 525 - 550 , 550 - 575 , 575 - 600 , 600 - 625 , 625 - 650 , 650 - 675 , 675 - 700 , 700 - 725 , 725 - 750 , 750 - 775 | ||
| Click To Change The Sort Order: By Market Cap or Company Size Performance: Year-to-date, Week and Day | |
| Select Chart Type: | ||
|
Best Stocks Today 12Stocks.com |
© 2024 12Stocks.com Terms & Conditions Privacy Contact Us
All Information Provided Only For Education And Not To Be Used For Investing or Trading. See Terms & Conditions


One More Thing ... Get Best Stocks Delivered Daily!
Never Ever Miss A Move With Our Top Ten Stocks Lists
Find Best Stocks In Any Market - Bull or Bear Market
Take A Peek At Our Top Ten Stocks Lists: Daily, Weekly, Year-to-Date & Top Trends
Find Best Stocks In Any Market - Bull or Bear Market
Take A Peek At Our Top Ten Stocks Lists: Daily, Weekly, Year-to-Date & Top Trends
Midcap Stocks With Best Up Trends [0-bearish to 100-bullish]: United Airlines[100], Medical Properties[100], Coupang [100], HEICO [100], Conagra [95], Inspire Medical[93], Royal Gold[93], Bunge [93], Allegro Micro[93], SYNNEX [88], United [88]
Best Midcap Stocks Year-to-Date:
Vistra Energy[78.22%], AppLovin [78.06%], ShockWave Medical[71.86%], Constellation Energy[58.3%], EMCOR [57.45%], Spotify [56.23%], Pure Storage[46.72%], Natera [44.2%], NRG Energy[42.01%], CAVA [41.58%], Wingstop [40.14%] Best Midcap Stocks This Week:
Medical Properties[19.55%], United Airlines[16.6%], AMC Entertainment[12.45%], Globe Life[7.01%], Coupang [6.49%], American Airlines[5.63%], Inspire Medical[5.08%], Advance Auto[5.04%], New York[4.58%], Southwest Airlines[4.5%], Bentley [4.03%] Best Midcap Stocks Daily:
United Airlines[17.45%], agilon health[11.83%], Inspire Medical[9.87%], AMC Entertainment[9.56%], American Airlines[6.60%], Globe Life[5.44%], Sunrun [4.99%], Alaska Air[4.71%], Ultragenyx Pharmaceutical[4.25%], Advance Auto[3.41%], Consolidated Edison[3.33%]