
 Login Sign Up


| |||||
 |  | ||||

| 12Stocks.com Market Intelligence |
Best Materials Stocks
| In a hurry? Materials Stocks Lists: Performance Trends Table, Stock Charts
Sort Materials stocks: Daily, Weekly, Year-to-Date, Market Cap & Trends. Filter Materials stocks list by size: All Materials Large Mid-Range Small |
| 12Stocks.com Materials Stocks Performances & Trends Daily | |||||||||
|
|  The overall Smart Investing & Trading Score is 36 (0-bearish to 100-bullish) which puts Materials sector in short term bearish to neutral trend. The Smart Investing & Trading Score from previous trading session is 44 and a deterioration of trend continues.
| ||||||||
Here are the Smart Investing & Trading Scores of the most requested Materials stocks at 12Stocks.com (click stock name for detailed review):
|


| Consider signing up for our daily 12Stocks.com "Best Stocks Newsletter". You will never ever miss a big stock move again! |
| 12Stocks.com: Investing in Materials sector with Stocks | |
|
The following table helps investors and traders sort through current performance and trends (as measured by Smart Investing & Trading Score) of various
stocks in the Materials sector. Quick View: Move mouse or cursor over stock symbol (ticker) to view short-term Technical chart and over stock name to view long term chart. Click on  to add stock symbol to your watchlist and to add stock symbol to your watchlist and  to view watchlist. Click on any ticker or stock name for detailed market intelligence report for that stock. to view watchlist. Click on any ticker or stock name for detailed market intelligence report for that stock. |
12Stocks.com Performance of Stocks in Materials Sector
| Ticker | Stock Name | Watchlist | Category | Recent Price | Smart Investing & Trading Score | Change % | YTD Change% |
| USGO | U.S. Gold |   | Other Industrial Metals & Mining | 7.20 | 66 | 2.64% | -6.80% |
| IPI | Intrepid Potash | | Chemicals | 19.04 | 36 | -0.83% | -20.30% |
| DNN | Denison Mines | | Metals/Minerals | 2.03 | 41 | -1.46% | 14.69% |
| VOXR | Vox Royalty | | Other Precious Metals & Mining | 2.03 | 46 | -1.93% | -1.46% |
| TMQ | Trilogy Metals | | Metals/Minerals | 0.51 | 20 | -1.08% | 17.56% |
| UEC | Uranium Energy | | Metals/Minerals | 7.07 | 25 | -1.39% | 10.47% |
| NRP | Natural | | Metals/Minerals | 91.50 | 42 | 1.27% | -1.15% |
| PROF | Profound Medical | | Metals/Minerals | 7.84 | 0 | -0.82% | -7.71% |
| ZEUS | Olympic Steel | | Steel & Iron | 68.50 | 26 | -0.17% | 2.70% |
| UAN | CVR Partners | | Chemicals | 77.82 | 36 | 0.08% | 18.81% |
| GRWG | GrowGeneration | | Chemicals | 2.23 | 5 | -2.19% | -11.16% |
| RYAM | Rayonier Advanced | | Chemicals | 4.28 | 23 | -3.82% | 5.68% |
| METC | Ramaco | | Metals/Minerals | 16.17 | 7 | 3.39% | -5.88% |
| UUUU | Energy Fuels | | Metals/Minerals | 5.80 | 0 | -3.17% | -19.33% |
| TC | TuanChe | | Metals/Minerals | 1.90 | 25 | 0.00% | 834.58% |
| EMX | EMX Royalty | | Metals/Minerals | 1.92 | 63 | -4.48% | 18.52% |
| For chart view version of above stock list: Chart View ➞ 0 - 25 , 25 - 50 , 50 - 75 , 75 - 100 , 100 - 125 , 125 - 150 , 150 - 175 | ||
 | Click To Change The Sort Order: By Market Cap or Company Size Performance: Year-to-date, Week and Day |  |
|
Get the most comprehensive stock market coverage daily at 12Stocks.com ➞ Best Stocks Today ➞ Best Stocks Weekly ➞ Best Stocks Year-to-Date ➞ Best Stocks Trends ➞  Best Stocks Today 12Stocks.com Best Nasdaq Stocks ➞ Best S&P 500 Stocks ➞ Best Tech Stocks ➞ Best Biotech Stocks ➞ |
| Detailed Overview of Materials Stocks |
| Materials Technical Overview, Leaders & Laggards, Top Materials ETF Funds & Detailed Materials Stocks List, Charts, Trends & More |
| Materials Sector: Technical Analysis, Trends & YTD Performance | |
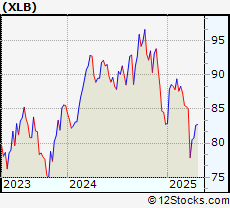
| Materials sector is composed of stocks
from mining, metals, agricultural, precious metals
and chemical subsectors. Materials sector, as represented by XLB, an exchange-traded fund [ETF] that holds basket of Materials stocks (e.g, Dow Chemical, Newmont Mining) is up by 3.81% and is currently underperforming the overall market by -1.21% year-to-date. Below is a quick view of Technical charts and trends: |
|
 XLB Weekly Chart |
|
| Long Term Trend: Very Good | |
| Medium Term Trend: Not Good | |
 XLB Daily Chart |
|
| Short Term Trend: Not Good | |
| Overall Trend Score: 36 | |
| YTD Performance: 3.81% | |
| **Trend Scores & Views Are Only For Educational Purposes And Not For Investing | |
| 12Stocks.com: Top Performing Materials Sector Stocks | ||||||||||||||||||||||||||||||||||||||||||||||||
 The top performing Materials sector stocks year to date are
Now, more recently, over last week, the top performing Materials sector stocks on the move are


|
||||||||||||||||||||||||||||||||||||||||||||||||
| 12Stocks.com: Investing in Materials Sector using Exchange Traded Funds | |
|
The following table shows list of key exchange traded funds (ETF) that
help investors track Materials Index. For detailed view, check out our ETF Funds section of our website. Quick View: Move mouse or cursor over ETF symbol (ticker) to view short-term Technical chart and over ETF name to view long term chart. Click on ticker or stock name for detailed view. Click on to add stock symbol to your watchlist and to view watchlist. |
12Stocks.com List of ETFs that track Materials Index
| Ticker | ETF Name | Watchlist | Recent Price | Smart Investing & Trading Score | Change % | Week % | Year-to-date % |
| XLB | Materials | | 88.80 | 36 | -0.77 | -1.25 | 3.81% |
| IYM | Basic Materials | | 141.69 | 36 | -0.95 | -1.47 | 2.56% |
| VAW | Materials | | 195.24 | 36 | -0.71 | -1.21 | 2.79% |
| GDX | Gold Miners | | 33.03 | 56 | -1.49 | -2.16 | 6.51% |
| UYM | Basic Materials | | 26.38 | 36 | -1.58 | -2.66 | 5.78% |
| XME | Metals and Mining | | 61.36 | 56 | 0.18 | -0.07 | 2.56% |
| MOO | Agribusiness | | 70.79 | 10 | -0.92 | -1.64 | -7.08% |
| DBA | Agriculture | | 25.07 | 66 | -2.30 | -1.42 | 20.88% |
| GLD | Gold | | 221.22 | 83 | 0.12 | 2 | 15.72% |
| SLV | Silver | | 25.80 | 76 | -2.31 | 0.66 | 18.46% |
| SLX | Steel | | 70.33 | 26 | -1.07 | -1.21 | -4.64% |
| COPX | Copper Miners | | 44.67 | 56 | -2.49 | -1.78 | 19.12% |
| SIL | Silver Miners | | 30.54 | 56 | -1.96 | -2.92 | 7.65% |
| MXI | Global Materials | | 86.47 | 36 | -1.87 | -1.48 | -0.9% |
| GDXJ | Junior Gold Miners | | 40.99 | 56 | -1.36 | -2.37 | 8.14% |
| PSCM | SmallCap Materials | | 73.92 | 36 | -0.37 | -0.37 | 0.17% |
| 12Stocks.com: Charts, Trends, Fundamental Data and Performances of Materials Stocks | |
|
We now take in-depth look at all Materials stocks including charts, multi-period performances and overall trends (as measured by Smart Investing & Trading Score). One can sort Materials stocks (click link to choose) by Daily, Weekly and by Year-to-Date performances. Also, one can sort by size of the company or by market capitalization. |
| Select Your Default Chart Type: | |||||
| |||||
| Click on stock symbol or name for detailed view. Click on to add stock symbol to your watchlist and to view watchlist. Quick View: Move mouse or cursor over "Daily" to quickly view daily Technical stock chart and over "Weekly" to view weekly Technical stock chart. | |||||

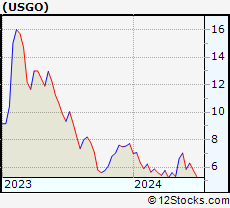 | USGO U.S. GoldMining Inc. |
| Sector: Materials | |
| SubSector: Other Industrial Metals & Mining | |
| MarketCap: 161 Millions | |
| Recent Price: 7.20 Smart Investing & Trading Score: 66 | |
| Day Percent Change: 2.64% Day Change: 0.19 | |
| Week Change: 2.35% Year-to-date Change: -6.8% | |
| USGO Links: Profile News Message Board | |
| Charts:- Daily , Weekly | |
| Add USGO to Watchlist: View: Get Complete USGO Trend Analysis ➞ | |
 | IPI Intrepid Potash, Inc. |
| Sector: Materials | |
| SubSector: Agricultural Chemicals | |
| MarketCap: 160.329 Millions | |
| Recent Price: 19.04 Smart Investing & Trading Score: 36 | |
| Day Percent Change: -0.83% Day Change: -0.16 | |
| Week Change: -6.71% Year-to-date Change: -20.3% | |
| IPI Links: Profile News Message Board | |
| Charts:- Daily , Weekly | |
| Add IPI to Watchlist: View: Get Complete IPI Trend Analysis ➞ | |
 | DNN Denison Mines Corp. |
| Sector: Materials | |
| SubSector: Industrial Metals & Minerals | |
| MarketCap: 154.11 Millions | |
| Recent Price: 2.03 Smart Investing & Trading Score: 41 | |
| Day Percent Change: -1.46% Day Change: -0.03 | |
| Week Change: -3.79% Year-to-date Change: 14.7% | |
| DNN Links: Profile News Message Board | |
| Charts:- Daily , Weekly | |
| Add DNN to Watchlist: View: Get Complete DNN Trend Analysis ➞ | |
 | VOXR Vox Royalty Corp. |
| Sector: Materials | |
| SubSector: Other Precious Metals & Mining | |
| MarketCap: 154 Millions | |
| Recent Price: 2.03 Smart Investing & Trading Score: 46 | |
| Day Percent Change: -1.93% Day Change: -0.04 | |
| Week Change: -1.93% Year-to-date Change: -1.5% | |
| VOXR Links: Profile News Message Board | |
| Charts:- Daily , Weekly | |
| Add VOXR to Watchlist: View: Get Complete VOXR Trend Analysis ➞ | |
 | TMQ Trilogy Metals Inc. |
| Sector: Materials | |
| SubSector: Industrial Metals & Minerals | |
| MarketCap: 151.21 Millions | |
| Recent Price: 0.51 Smart Investing & Trading Score: 20 | |
| Day Percent Change: -1.08% Day Change: -0.01 | |
| Week Change: -4.26% Year-to-date Change: 17.6% | |
| TMQ Links: Profile News Message Board | |
| Charts:- Daily , Weekly | |
| Add TMQ to Watchlist: View: Get Complete TMQ Trend Analysis ➞ | |
 | UEC Uranium Energy Corp. |
| Sector: Materials | |
| SubSector: Industrial Metals & Minerals | |
| MarketCap: 138.91 Millions | |
| Recent Price: 7.07 Smart Investing & Trading Score: 25 | |
| Day Percent Change: -1.39% Day Change: -0.10 | |
| Week Change: -2.62% Year-to-date Change: 10.5% | |
| UEC Links: Profile News Message Board | |
| Charts:- Daily , Weekly | |
| Add UEC to Watchlist: View: Get Complete UEC Trend Analysis ➞ | |
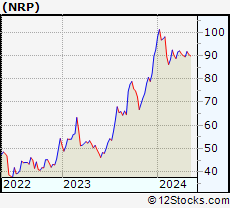 | NRP Natural Resource Partners L.P. |
| Sector: Materials | |
| SubSector: Industrial Metals & Minerals | |
| MarketCap: 130.41 Millions | |
| Recent Price: 91.50 Smart Investing & Trading Score: 42 | |
| Day Percent Change: 1.27% Day Change: 1.15 | |
| Week Change: 1.67% Year-to-date Change: -1.2% | |
| NRP Links: Profile News Message Board | |
| Charts:- Daily , Weekly | |
| Add NRP to Watchlist: View: Get Complete NRP Trend Analysis ➞ | |
 | PROF Profound Medical Corp. |
| Sector: Materials | |
| SubSector: Industrial Metals & Minerals | |
| MarketCap: 121.41 Millions | |
| Recent Price: 7.84 Smart Investing & Trading Score: 0 | |
| Day Percent Change: -0.82% Day Change: -0.07 | |
| Week Change: -1.07% Year-to-date Change: -7.7% | |
| PROF Links: Profile News Message Board | |
| Charts:- Daily , Weekly | |
| Add PROF to Watchlist: View: Get Complete PROF Trend Analysis ➞ | |
 | ZEUS Olympic Steel, Inc. |
| Sector: Materials | |
| SubSector: Steel & Iron | |
| MarketCap: 118.888 Millions | |
| Recent Price: 68.50 Smart Investing & Trading Score: 26 | |
| Day Percent Change: -0.17% Day Change: -0.12 | |
| Week Change: 0.37% Year-to-date Change: 2.7% | |
| ZEUS Links: Profile News Message Board | |
| Charts:- Daily , Weekly | |
| Add ZEUS to Watchlist: View: Get Complete ZEUS Trend Analysis ➞ | |
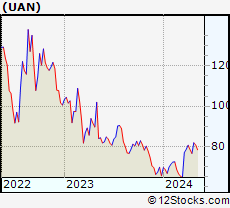 | UAN CVR Partners, LP |
| Sector: Materials | |
| SubSector: Agricultural Chemicals | |
| MarketCap: 118.529 Millions | |
| Recent Price: 77.82 Smart Investing & Trading Score: 36 | |
| Day Percent Change: 0.08% Day Change: 0.06 | |
| Week Change: -0.93% Year-to-date Change: 18.8% | |
| UAN Links: Profile News Message Board | |
| Charts:- Daily , Weekly | |
| Add UAN to Watchlist: View: Get Complete UAN Trend Analysis ➞ | |
 | GRWG GrowGeneration Corp. |
| Sector: Materials | |
| SubSector: Agricultural Chemicals | |
| MarketCap: 118.429 Millions | |
| Recent Price: 2.23 Smart Investing & Trading Score: 5 | |
| Day Percent Change: -2.19% Day Change: -0.05 | |
| Week Change: -6.3% Year-to-date Change: -11.2% | |
| GRWG Links: Profile News Message Board | |
| Charts:- Daily , Weekly | |
| Add GRWG to Watchlist: View: Get Complete GRWG Trend Analysis ➞ | |
 | RYAM Rayonier Advanced Materials Inc. |
| Sector: Materials | |
| SubSector: Chemicals - Major Diversified | |
| MarketCap: 116.736 Millions | |
| Recent Price: 4.28 Smart Investing & Trading Score: 23 | |
| Day Percent Change: -3.82% Day Change: -0.17 | |
| Week Change: -5.52% Year-to-date Change: 5.7% | |
| RYAM Links: Profile News Message Board | |
| Charts:- Daily , Weekly | |
| Add RYAM to Watchlist: View: Get Complete RYAM Trend Analysis ➞ | |
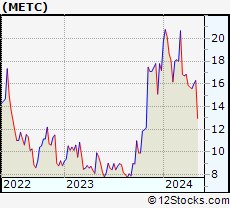 | METC Ramaco Resources, Inc. |
| Sector: Materials | |
| SubSector: Industrial Metals & Minerals | |
| MarketCap: 114.41 Millions | |
| Recent Price: 16.17 Smart Investing & Trading Score: 7 | |
| Day Percent Change: 3.39% Day Change: 0.53 | |
| Week Change: 2.93% Year-to-date Change: -5.9% | |
| METC Links: Profile News Message Board | |
| Charts:- Daily , Weekly | |
| Add METC to Watchlist: View: Get Complete METC Trend Analysis ➞ | |
 | UUUU Energy Fuels Inc. |
| Sector: Materials | |
| SubSector: Industrial Metals & Minerals | |
| MarketCap: 107.61 Millions | |
| Recent Price: 5.80 Smart Investing & Trading Score: 0 | |
| Day Percent Change: -3.17% Day Change: -0.19 | |
| Week Change: -6.45% Year-to-date Change: -19.3% | |
| UUUU Links: Profile News Message Board | |
| Charts:- Daily , Weekly | |
| Add UUUU to Watchlist: View: Get Complete UUUU Trend Analysis ➞ | |
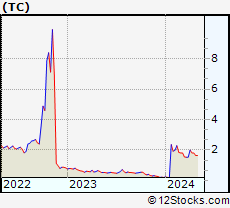 | TC TuanChe Limited |
| Sector: Materials | |
| SubSector: Industrial Metals & Minerals | |
| MarketCap: 107.31 Millions | |
| Recent Price: 1.90 Smart Investing & Trading Score: 25 | |
| Day Percent Change: 0.00% Day Change: 0.00 | |
| Week Change: 4.97% Year-to-date Change: 834.6% | |
| TC Links: Profile News Message Board | |
| Charts:- Daily , Weekly | |
| Add TC to Watchlist: View: Get Complete TC Trend Analysis ➞ | |
 | EMX EMX Royalty Corporation |
| Sector: Materials | |
| SubSector: Industrial Metals & Minerals | |
| MarketCap: 103.91 Millions | |
| Recent Price: 1.92 Smart Investing & Trading Score: 63 | |
| Day Percent Change: -4.48% Day Change: -0.09 | |
| Week Change: 0% Year-to-date Change: 18.5% | |
| EMX Links: Profile News Message Board | |
| Charts:- Daily , Weekly | |
| Add EMX to Watchlist: View: Get Complete EMX Trend Analysis ➞ | |
| For tabular summary view of above stock list: Summary View ➞ 0 - 25 , 25 - 50 , 50 - 75 , 75 - 100 , 100 - 125 , 125 - 150 , 150 - 175 | ||
| Click To Change The Sort Order: By Market Cap or Company Size Performance: Year-to-date, Week and Day | |
| Select Chart Type: | ||
|
Best Stocks Today 12Stocks.com |
© 2024 12Stocks.com Terms & Conditions Privacy Contact Us
All Information Provided Only For Education And Not To Be Used For Investing or Trading. See Terms & Conditions


One More Thing ... Get Best Stocks Delivered Daily!
Never Ever Miss A Move With Our Top Ten Stocks Lists
Find Best Stocks In Any Market - Bull or Bear Market
Take A Peek At Our Top Ten Stocks Lists: Daily, Weekly, Year-to-Date & Top Trends
Find Best Stocks In Any Market - Bull or Bear Market
Take A Peek At Our Top Ten Stocks Lists: Daily, Weekly, Year-to-Date & Top Trends
Materials Stocks With Best Up Trends [0-bearish to 100-bullish]: Warrior Met[100], Northern Dynasty[85], Century Aluminum[83], Origin [76], ioneer [76], Agnico Eagle[71], Wheaton Precious[68], Pan American[68], U.S. Gold[66], Ivanhoe Electric[66], CONSOL Energy[64]
Best Materials Stocks Year-to-Date:
TuanChe [834.58%], Perimeter [53.65%], McEwen [53.12%], Gatos Silver[47.48%], Century Aluminum[44.32%], Harmony Gold[44.23%], Gold [42.39%], IAMGOLD [39.92%], Silvercorp Metals[37.64%], Hudbay Minerals[37.14%], Coeur [34.05%] Best Materials Stocks This Week:
Warrior Met[9.13%], ioneer [7.21%], Century Aluminum[6.31%], Arch Coal[5.76%], CONSOL Energy[5.73%], TuanChe [4.97%], Peabody Energy[4.33%], i-80 Gold[3.36%], Ramaco [2.93%], Loop Industries[2.88%], Silvercorp Metals[2.55%] Best Materials Stocks Daily:
Warrior Met[8.60%], Arch Coal[5.08%], Peabody Energy[5.01%], CONSOL Energy[4.05%], Ramaco [4.02%], Ramaco [3.39%], Loop Industries[2.88%], U.S. Gold[2.64%], Trinseo S.A[2.38%], Northern Dynasty[2.13%], SunCoke Energy[1.98%]