
 Login Sign Up


| |||||
 |  | ||||

| 12Stocks.com Market Intelligence |
Best Materials Stocks
| In a hurry? Materials Stocks Lists: Performance Trends Table, Stock Charts
Sort Materials stocks: Daily, Weekly, Year-to-Date, Market Cap & Trends. Filter Materials stocks list by size: All Materials Large Mid-Range Small |
| 12Stocks.com Materials Stocks Performances & Trends Daily | |||||||||
|
|  The overall Smart Investing & Trading Score is 61 (0-bearish to 100-bullish) which puts Materials sector in short term neutral to bullish trend. The Smart Investing & Trading Score from previous trading session is 54 and hence an improvement of trend.
| ||||||||
Here are the Smart Investing & Trading Scores of the most requested Materials stocks at 12Stocks.com (click stock name for detailed review):
|


| Consider signing up for our daily 12Stocks.com "Best Stocks Newsletter". You will never ever miss a big stock move again! |
| 12Stocks.com: Investing in Materials sector with Stocks | |
|
The following table helps investors and traders sort through current performance and trends (as measured by Smart Investing & Trading Score) of various
stocks in the Materials sector. Quick View: Move mouse or cursor over stock symbol (ticker) to view short-term Technical chart and over stock name to view long term chart. Click on  to add stock symbol to your watchlist and to add stock symbol to your watchlist and  to view watchlist. Click on any ticker or stock name for detailed market intelligence report for that stock. to view watchlist. Click on any ticker or stock name for detailed market intelligence report for that stock. |
12Stocks.com Performance of Stocks in Materials Sector
| Ticker | Stock Name | Watchlist | Category | Recent Price | Smart Investing & Trading Score | Change % | YTD Change% |
| CE | Celanese |   | Chemicals | 156.70 | 58 | 1.35 | 0.86% |
| AVD | American Vanguard | | Chemicals | 11.24 | 36 | 1.35 | 2.46% |
| AG | First Majestic | | Silver | 6.86 | 51 | 1.33 | 11.54% |
| IIIN | Insteel Industries | | Steel & Iron | 33.39 | 17 | 1.27 | -12.80% |
| CBT | Cabot | | Chemicals | 91.81 | 54 | 1.23 | 9.95% |
| MTRN | Materion | | Metals/Minerals | 121.21 | 26 | 1.22 | -6.85% |
| MOS | Mosaic | | Chemicals | 30.84 | 48 | 1.21 | -13.69% |
| EGO | Eldorado Gold | | Gold | 15.08 | 64 | 1.21 | 16.27% |
| AGI | Alamos Gold | | Gold | 15.24 | 100 | 1.20 | 13.14% |
| SA | Seabridge Gold | | Gold | 15.28 | 59 | 1.19 | 25.97% |
| ALB | Albemarle | | Chemicals | 113.12 | 20 | 1.18 | -21.71% |
| SSRM | SSR | | Gold | 5.20 | 42 | 1.17 | -51.67% |
| HL | Hecla | | Gold | 5.34 | 63 | 1.14 | 11.02% |
| HCC | Warrior Met | | Metals/Minerals | 66.90 | 73 | 1.13 | 9.73% |
| SCL | Stepan | | Chemicals | 82.97 | 10 | 1.12 | -12.24% |
| SLVM | Sylvamo | | Paper & Paper Products | 58.49 | 61 | 1.12 | 19.10% |
| CMP | Compass Minerals | | Metals/Minerals | 13.75 | 35 | 1.10 | -45.70% |
| KOP | Koppers | | Chemicals | 53.73 | 26 | 1.09 | 4.90% |
| IOSP | Innospec | | Chemicals | 122.13 | 58 | 1.08 | -0.90% |
| HWKN | Hawkins | | Chemicals | 75.50 | 26 | 1.07 | 7.21% |
| CENTA | Central Garden | | Chemicals | 34.23 | 27 | 1.03 | -22.28% |
| UUUU | Energy Fuels | | Metals/Minerals | 5.91 | 10 | 1.03 | -17.80% |
| KRO | Kronos Worldwide | | Chemicals | 11.40 | 61 | 1.02 | 14.74% |
| ROCK | Gibraltar Industries | | Steel & Iron | 71.80 | 0 | 1.01 | -9.09% |
| EMN | Eastman Chemical | | Chemicals | 96.97 | 61 | 0.99 | 7.96% |
| For chart view version of above stock list: Chart View ➞ 0 - 25 , 25 - 50 , 50 - 75 , 75 - 100 , 100 - 125 , 125 - 150 , 150 - 175 | ||
 | Click To Change The Sort Order: By Market Cap or Company Size Performance: Year-to-date, Week and Day |  |
|
Get the most comprehensive stock market coverage daily at 12Stocks.com ➞ Best Stocks Today ➞ Best Stocks Weekly ➞ Best Stocks Year-to-Date ➞ Best Stocks Trends ➞  Best Stocks Today 12Stocks.com Best Nasdaq Stocks ➞ Best S&P 500 Stocks ➞ Best Tech Stocks ➞ Best Biotech Stocks ➞ |
| Detailed Overview of Materials Stocks |
| Materials Technical Overview, Leaders & Laggards, Top Materials ETF Funds & Detailed Materials Stocks List, Charts, Trends & More |
| Materials Sector: Technical Analysis, Trends & YTD Performance | |
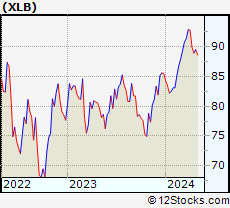
| Materials sector is composed of stocks
from mining, metals, agricultural, precious metals
and chemical subsectors. Materials sector, as represented by XLB, an exchange-traded fund [ETF] that holds basket of Materials stocks (e.g, Dow Chemical, Newmont Mining) is up by 4.66% and is currently outperforming the overall market by 0.31% year-to-date. Below is a quick view of Technical charts and trends: |
|
 XLB Weekly Chart |
|
| Long Term Trend: Very Good | |
| Medium Term Trend: Not Good | |
 XLB Daily Chart |
|
| Short Term Trend: Very Good | |
| Overall Trend Score: 61 | |
| YTD Performance: 4.66% | |
| **Trend Scores & Views Are Only For Educational Purposes And Not For Investing | |
| 12Stocks.com: Top Performing Materials Sector Stocks | ||||||||||||||||||||||||||||||||||||||||||||||||
 The top performing Materials sector stocks year to date are
Now, more recently, over last week, the top performing Materials sector stocks on the move are


|
||||||||||||||||||||||||||||||||||||||||||||||||
| 12Stocks.com: Investing in Materials Sector using Exchange Traded Funds | |
|
The following table shows list of key exchange traded funds (ETF) that
help investors track Materials Index. For detailed view, check out our ETF Funds section of our website. Quick View: Move mouse or cursor over ETF symbol (ticker) to view short-term Technical chart and over ETF name to view long term chart. Click on ticker or stock name for detailed view. Click on to add stock symbol to your watchlist and to view watchlist. |
12Stocks.com List of ETFs that track Materials Index
| Ticker | ETF Name | Watchlist | Recent Price | Smart Investing & Trading Score | Change % | Week % | Year-to-date % |
| XLB | Materials | | 89.53 | 61 | 0.56 | -0.43 | 4.66% |
| GDX | Gold Miners | | 33.95 | 83 | 0.61 | 0.58 | 9.5% |
| UYM | Basic Materials | | 26.77 | 68 | 1.06 | -1.22 | 7.34% |
| XME | Metals and Mining | | 61.35 | 56 | 0.62 | -0.08 | 2.54% |
| MOO | Agribusiness | | 71.40 | 55 | 0.15 | -0.79 | -6.27% |
| DBA | Agriculture | | 26.15 | 100 | 0.85 | 2.83 | 26.08% |
| GLD | Gold | | 220.25 | 76 | -0.04 | 1.55 | 15.21% |
| SLV | Silver | | 25.94 | 83 | 0.31 | 1.21 | 19.1% |
| SLX | Steel | | 70.61 | 44 | 0.43 | -0.82 | -4.26% |
| 12Stocks.com: Charts, Trends, Fundamental Data and Performances of Materials Stocks | |
|
We now take in-depth look at all Materials stocks including charts, multi-period performances and overall trends (as measured by Smart Investing & Trading Score). One can sort Materials stocks (click link to choose) by Daily, Weekly and by Year-to-Date performances. Also, one can sort by size of the company or by market capitalization. |
| Select Your Default Chart Type: | |||||
| |||||
| Click on stock symbol or name for detailed view. Click on to add stock symbol to your watchlist and to view watchlist. Quick View: Move mouse or cursor over "Daily" to quickly view daily Technical stock chart and over "Weekly" to view weekly Technical stock chart. | |||||

 | CE Celanese Corporation |
| Sector: Materials | |
| SubSector: Chemicals - Major Diversified | |
| MarketCap: 8521.06 Millions | |
| Recent Price: 156.70 Smart Investing & Trading Score: 58 | |
| Day Percent Change: 1.35% Day Change: 2.08 | |
| Week Change: 0.42% Year-to-date Change: 0.9% | |
| CE Links: Profile News Message Board | |
| Charts:- Daily , Weekly | |
| Add CE to Watchlist: View: Get Complete CE Trend Analysis ➞ | |
 | AVD American Vanguard Corporation |
| Sector: Materials | |
| SubSector: Agricultural Chemicals | |
| MarketCap: 419.329 Millions | |
| Recent Price: 11.24 Smart Investing & Trading Score: 36 | |
| Day Percent Change: 1.35% Day Change: 0.15 | |
| Week Change: -3.85% Year-to-date Change: 2.5% | |
| AVD Links: Profile News Message Board | |
| Charts:- Daily , Weekly | |
| Add AVD to Watchlist: View: Get Complete AVD Trend Analysis ➞ | |
 | AG First Majestic Silver Corp. |
| Sector: Materials | |
| SubSector: Silver | |
| MarketCap: 1128.56 Millions | |
| Recent Price: 6.86 Smart Investing & Trading Score: 51 | |
| Day Percent Change: 1.33% Day Change: 0.09 | |
| Week Change: -8.78% Year-to-date Change: 11.5% | |
| AG Links: Profile News Message Board | |
| Charts:- Daily , Weekly | |
| Add AG to Watchlist: View: Get Complete AG Trend Analysis ➞ | |
 | IIIN Insteel Industries, Inc. |
| Sector: Materials | |
| SubSector: Steel & Iron | |
| MarketCap: 269.488 Millions | |
| Recent Price: 33.39 Smart Investing & Trading Score: 17 | |
| Day Percent Change: 1.27% Day Change: 0.42 | |
| Week Change: -2.99% Year-to-date Change: -12.8% | |
| IIIN Links: Profile News Message Board | |
| Charts:- Daily , Weekly | |
| Add IIIN to Watchlist: View: Get Complete IIIN Trend Analysis ➞ | |
 | CBT Cabot Corporation |
| Sector: Materials | |
| SubSector: Specialty Chemicals | |
| MarketCap: 1261.47 Millions | |
| Recent Price: 91.81 Smart Investing & Trading Score: 54 | |
| Day Percent Change: 1.23% Day Change: 1.12 | |
| Week Change: -1.57% Year-to-date Change: 10.0% | |
| CBT Links: Profile News Message Board | |
| Charts:- Daily , Weekly | |
| Add CBT to Watchlist: View: Get Complete CBT Trend Analysis ➞ | |
 | MTRN Materion Corporation |
| Sector: Materials | |
| SubSector: Industrial Metals & Minerals | |
| MarketCap: 703.71 Millions | |
| Recent Price: 121.21 Smart Investing & Trading Score: 26 | |
| Day Percent Change: 1.22% Day Change: 1.46 | |
| Week Change: -3.37% Year-to-date Change: -6.9% | |
| MTRN Links: Profile News Message Board | |
| Charts:- Daily , Weekly | |
| Add MTRN to Watchlist: View: Get Complete MTRN Trend Analysis ➞ | |
 | MOS The Mosaic Company |
| Sector: Materials | |
| SubSector: Agricultural Chemicals | |
| MarketCap: 4299.59 Millions | |
| Recent Price: 30.84 Smart Investing & Trading Score: 48 | |
| Day Percent Change: 1.21% Day Change: 0.37 | |
| Week Change: -0.9% Year-to-date Change: -13.7% | |
| MOS Links: Profile News Message Board | |
| Charts:- Daily , Weekly | |
| Add MOS to Watchlist: View: Get Complete MOS Trend Analysis ➞ | |
 | EGO Eldorado Gold Corporation |
| Sector: Materials | |
| SubSector: Gold | |
| MarketCap: 982.519 Millions | |
| Recent Price: 15.08 Smart Investing & Trading Score: 64 | |
| Day Percent Change: 1.21% Day Change: 0.18 | |
| Week Change: -0.4% Year-to-date Change: 16.3% | |
| EGO Links: Profile News Message Board | |
| Charts:- Daily , Weekly | |
| Add EGO to Watchlist: View: Get Complete EGO Trend Analysis ➞ | |
 | AGI Alamos Gold Inc. |
| Sector: Materials | |
| SubSector: Gold | |
| MarketCap: 1740.39 Millions | |
| Recent Price: 15.24 Smart Investing & Trading Score: 100 | |
| Day Percent Change: 1.20% Day Change: 0.18 | |
| Week Change: 0.2% Year-to-date Change: 13.1% | |
| AGI Links: Profile News Message Board | |
| Charts:- Daily , Weekly | |
| Add AGI to Watchlist: View: Get Complete AGI Trend Analysis ➞ | |
 | SA Seabridge Gold Inc. |
| Sector: Materials | |
| SubSector: Gold | |
| MarketCap: 565.419 Millions | |
| Recent Price: 15.28 Smart Investing & Trading Score: 59 | |
| Day Percent Change: 1.19% Day Change: 0.18 | |
| Week Change: -6.37% Year-to-date Change: 26.0% | |
| SA Links: Profile News Message Board | |
| Charts:- Daily , Weekly | |
| Add SA to Watchlist: View: Get Complete SA Trend Analysis ➞ | |
 | ALB Albemarle Corporation |
| Sector: Materials | |
| SubSector: Specialty Chemicals | |
| MarketCap: 6139.27 Millions | |
| Recent Price: 113.12 Smart Investing & Trading Score: 20 | |
| Day Percent Change: 1.18% Day Change: 1.32 | |
| Week Change: -7.72% Year-to-date Change: -21.7% | |
| ALB Links: Profile News Message Board | |
| Charts:- Daily , Weekly | |
| Add ALB to Watchlist: View: Get Complete ALB Trend Analysis ➞ | |
 | SSRM SSR Mining Inc. |
| Sector: Materials | |
| SubSector: Gold | |
| MarketCap: 1546.09 Millions | |
| Recent Price: 5.20 Smart Investing & Trading Score: 42 | |
| Day Percent Change: 1.17% Day Change: 0.06 | |
| Week Change: 0.19% Year-to-date Change: -51.7% | |
| SSRM Links: Profile News Message Board | |
| Charts:- Daily , Weekly | |
| Add SSRM to Watchlist: View: Get Complete SSRM Trend Analysis ➞ | |
 | HL Hecla Mining Company |
| Sector: Materials | |
| SubSector: Gold | |
| MarketCap: 1048.49 Millions | |
| Recent Price: 5.34 Smart Investing & Trading Score: 63 | |
| Day Percent Change: 1.14% Day Change: 0.06 | |
| Week Change: -1.48% Year-to-date Change: 11.0% | |
| HL Links: Profile News Message Board | |
| Charts:- Daily , Weekly | |
| Add HL to Watchlist: View: Get Complete HL Trend Analysis ➞ | |
 | HCC Warrior Met Coal, Inc. |
| Sector: Materials | |
| SubSector: Industrial Metals & Minerals | |
| MarketCap: 748.81 Millions | |
| Recent Price: 66.90 Smart Investing & Trading Score: 73 | |
| Day Percent Change: 1.13% Day Change: 0.75 | |
| Week Change: 7.02% Year-to-date Change: 9.7% | |
| HCC Links: Profile News Message Board | |
| Charts:- Daily , Weekly | |
| Add HCC to Watchlist: View: Get Complete HCC Trend Analysis ➞ | |
 | SCL Stepan Company |
| Sector: Materials | |
| SubSector: Specialty Chemicals | |
| MarketCap: 1812.97 Millions | |
| Recent Price: 82.97 Smart Investing & Trading Score: 10 | |
| Day Percent Change: 1.12% Day Change: 0.91 | |
| Week Change: -1.34% Year-to-date Change: -12.2% | |
| SCL Links: Profile News Message Board | |
| Charts:- Daily , Weekly | |
| Add SCL to Watchlist: View: Get Complete SCL Trend Analysis ➞ | |
 | SLVM Sylvamo Corporation |
| Sector: Materials | |
| SubSector: Paper & Paper Products | |
| MarketCap: 1710 Millions | |
| Recent Price: 58.49 Smart Investing & Trading Score: 61 | |
| Day Percent Change: 1.12% Day Change: 0.65 | |
| Week Change: 0.03% Year-to-date Change: 19.1% | |
| SLVM Links: Profile News Message Board | |
| Charts:- Daily , Weekly | |
| Add SLVM to Watchlist: View: Get Complete SLVM Trend Analysis ➞ | |
 | CMP Compass Minerals International, Inc. |
| Sector: Materials | |
| SubSector: Industrial Metals & Minerals | |
| MarketCap: 1512.1 Millions | |
| Recent Price: 13.75 Smart Investing & Trading Score: 35 | |
| Day Percent Change: 1.10% Day Change: 0.15 | |
| Week Change: -3.85% Year-to-date Change: -45.7% | |
| CMP Links: Profile News Message Board | |
| Charts:- Daily , Weekly | |
| Add CMP to Watchlist: View: Get Complete CMP Trend Analysis ➞ | |
 | KOP Koppers Holdings Inc. |
| Sector: Materials | |
| SubSector: Specialty Chemicals | |
| MarketCap: 232.657 Millions | |
| Recent Price: 53.73 Smart Investing & Trading Score: 26 | |
| Day Percent Change: 1.09% Day Change: 0.58 | |
| Week Change: -2.4% Year-to-date Change: 4.9% | |
| KOP Links: Profile News Message Board | |
| Charts:- Daily , Weekly | |
| Add KOP to Watchlist: View: Get Complete KOP Trend Analysis ➞ | |
 | IOSP Innospec Inc. |
| Sector: Materials | |
| SubSector: Specialty Chemicals | |
| MarketCap: 1665.57 Millions | |
| Recent Price: 122.13 Smart Investing & Trading Score: 58 | |
| Day Percent Change: 1.08% Day Change: 1.31 | |
| Week Change: -0.43% Year-to-date Change: -0.9% | |
| IOSP Links: Profile News Message Board | |
| Charts:- Daily , Weekly | |
| Add IOSP to Watchlist: View: Get Complete IOSP Trend Analysis ➞ | |
 | HWKN Hawkins, Inc. |
| Sector: Materials | |
| SubSector: Specialty Chemicals | |
| MarketCap: 398.957 Millions | |
| Recent Price: 75.50 Smart Investing & Trading Score: 26 | |
| Day Percent Change: 1.07% Day Change: 0.80 | |
| Week Change: -2.21% Year-to-date Change: 7.2% | |
| HWKN Links: Profile News Message Board | |
| Charts:- Daily , Weekly | |
| Add HWKN to Watchlist: View: Get Complete HWKN Trend Analysis ➞ | |
 | CENTA Central Garden & Pet Company |
| Sector: Materials | |
| SubSector: Agricultural Chemicals | |
| MarketCap: 953 Millions | |
| Recent Price: 34.23 Smart Investing & Trading Score: 27 | |
| Day Percent Change: 1.03% Day Change: 0.35 | |
| Week Change: -0.26% Year-to-date Change: -22.3% | |
| CENTA Links: Profile News Message Board | |
| Charts:- Daily , Weekly | |
| Add CENTA to Watchlist: View: Get Complete CENTA Trend Analysis ➞ | |
 | UUUU Energy Fuels Inc. |
| Sector: Materials | |
| SubSector: Industrial Metals & Minerals | |
| MarketCap: 107.61 Millions | |
| Recent Price: 5.91 Smart Investing & Trading Score: 10 | |
| Day Percent Change: 1.03% Day Change: 0.06 | |
| Week Change: -4.68% Year-to-date Change: -17.8% | |
| UUUU Links: Profile News Message Board | |
| Charts:- Daily , Weekly | |
| Add UUUU to Watchlist: View: Get Complete UUUU Trend Analysis ➞ | |
 | KRO Kronos Worldwide, Inc. |
| Sector: Materials | |
| SubSector: Specialty Chemicals | |
| MarketCap: 1046.57 Millions | |
| Recent Price: 11.40 Smart Investing & Trading Score: 61 | |
| Day Percent Change: 1.02% Day Change: 0.12 | |
| Week Change: 0.13% Year-to-date Change: 14.7% | |
| KRO Links: Profile News Message Board | |
| Charts:- Daily , Weekly | |
| Add KRO to Watchlist: View: Get Complete KRO Trend Analysis ➞ | |
 | ROCK Gibraltar Industries, Inc. |
| Sector: Materials | |
| SubSector: Steel & Iron | |
| MarketCap: 1341.08 Millions | |
| Recent Price: 71.80 Smart Investing & Trading Score: 0 | |
| Day Percent Change: 1.01% Day Change: 0.72 | |
| Week Change: -3.22% Year-to-date Change: -9.1% | |
| ROCK Links: Profile News Message Board | |
| Charts:- Daily , Weekly | |
| Add ROCK to Watchlist: View: Get Complete ROCK Trend Analysis ➞ | |
 | EMN Eastman Chemical Company |
| Sector: Materials | |
| SubSector: Chemicals - Major Diversified | |
| MarketCap: 6217.06 Millions | |
| Recent Price: 96.97 Smart Investing & Trading Score: 61 | |
| Day Percent Change: 0.99% Day Change: 0.95 | |
| Week Change: -1.03% Year-to-date Change: 8.0% | |
| EMN Links: Profile News Message Board | |
| Charts:- Daily , Weekly | |
| Add EMN to Watchlist: View: Get Complete EMN Trend Analysis ➞ | |
| For tabular summary view of above stock list: Summary View ➞ 0 - 25 , 25 - 50 , 50 - 75 , 75 - 100 , 100 - 125 , 125 - 150 , 150 - 175 | ||
| Click To Change The Sort Order: By Market Cap or Company Size Performance: Year-to-date, Week and Day | |
| Select Chart Type: | ||
|
Best Stocks Today 12Stocks.com |
© 2024 12Stocks.com Terms & Conditions Privacy Contact Us
All Information Provided Only For Education And Not To Be Used For Investing or Trading. See Terms & Conditions


One More Thing ... Get Best Stocks Delivered Daily!
Never Ever Miss A Move With Our Top Ten Stocks Lists
Find Best Stocks In Any Market - Bull or Bear Market
Take A Peek At Our Top Ten Stocks Lists: Daily, Weekly, Year-to-Date & Top Trends
Find Best Stocks In Any Market - Bull or Bear Market
Take A Peek At Our Top Ten Stocks Lists: Daily, Weekly, Year-to-Date & Top Trends
Materials Stocks With Best Up Trends [0-bearish to 100-bullish]: Alamos Gold[100], Kinross Gold[93], Methanex [93], Freeport-McMoRan [93], Hudbay Minerals[93], SilverCrest Metals[93], Agnico Eagle[93], Ivanhoe Electric[93], Pan American[90], IAMGOLD [88], Sandstorm Gold[88]
Best Materials Stocks Year-to-Date:
TuanChe [873.93%], Perimeter [54.52%], McEwen [53.81%], Harmony Gold[48.05%], Century Aluminum[47.45%], IAMGOLD [47.43%], Gatos Silver[46.87%], Hudbay Minerals[43.75%], Silvercorp Metals[37.07%], Coeur [36.2%], Southern Copper[34.8%] Best Materials Stocks This Week:
TuanChe [9.39%], Century Aluminum[8.62%], Warrior Met[7.02%], SilverCrest Metals[5.34%], Peabody Energy[4.46%], Hudbay Minerals[4.13%], Arch Coal[3.89%], Origin [3.59%], Agnico Eagle[3.55%], Franco-Nevada [3.3%], Kinross Gold[3.16%] Best Materials Stocks Daily:
Origin [10.81%], TuanChe [7.61%], GrowGeneration [3.30%], Northern Dynasty[3.24%], Lavoro [3.24%], Fortuna Silver[2.88%], Lithium Americas[2.79%], Century Aluminum[2.76%], Kinross Gold[2.69%], Gold [2.65%], IAMGOLD [2.47%]