
 Login Sign Up


| |||||
 |  | ||||

| 12Stocks.com Market Intelligence |
Best Latin America Stocks
|
|
| Quick Read: Top Latin America Stocks By Performances & Trends: Daily, Weekly, Year-to-Date, Market Cap (Size) & Technical Trends | |||
| Best Latin America Views: Quick Browse View, Summary & Slide Show | |||
| 12Stocks.com Latin America Stocks Performances & Trends Daily | |||||||||
|
|  The overall market intelligence score is 32 (0-bearish to 100-bullish) which puts Latin America index in short term bearish to neutral trend. The market intelligence score from previous trading session is 0 and hence an improvement of trend.
| ||||||||
| Here are the market intelligence trend scores of the most requested Latin America stocks at 12Stocks.com (click stock name for detailed review): | |
| Scroll down this page for most comprehensive review of Latin America stocks by performance, trends, technical analysis, charts, fund plays & more | |


| 12Stocks.com: Top Performing Latin America Index Stocks | ||||||||||||||||||||||||||||||||||||||||||||||||
 The top performing Latin America Index stocks year to date are
Now, more recently, over last week, the top performing Latin America Index stocks on the move are


|
||||||||||||||||||||||||||||||||||||||||||||||||
| 12Stocks.com: Investing in Latin America Index with Stocks | |
|
The following table helps investors and traders sort through current performance and trends (as measured by market intelligence score) of various
stocks in the Latin America Index. Quick View: Move mouse or cursor over stock symbol (ticker) to view short-term technical chart and over stock name to view long term chart. Click on  to add stock symbol to your watchlist and to add stock symbol to your watchlist and  to view watchlist. Click on any ticker or stock name for detailed market intelligence report for that stock. to view watchlist. Click on any ticker or stock name for detailed market intelligence report for that stock. |
12Stocks.com Performance of Stocks in Latin America Index
| Ticker | Stock Name | Watchlist | Category | Recent Price | Market Intelligence Score | Change % | Weekly Change% |
| RBA | Ritchie Bros. |   | Services & Goods | 72.61 | 36 | 0.17% | -0.97% |
| QSR | Restaurant Brands | | Services & Goods | 71.42 | 32 | 0.08% | -1.09% |
| GIL | Gildan Activewear | | Consumer Staples | 35.20 | 41 | 0.23% | -1.10% |
| TRP | TC Energy | | Energy | 35.70 | 32 | 1.16% | -1.14% |
| WPRT | Westport Fuel | | Consumer Staples | 5.74 | 18 | 0.70% | -1.20% |
| TGB | Taseko Mines | | Materials | 2.46 | 63 | -2.77% | -1.20% |
| VTMX | Vesta Financials | | Financials | 35.24 | 25 | 0.01% | -1.26% |
| AEZS | Aeterna Zentaris | | Health Care | 1.95 | 46 | -0.36% | -1.27% |
| BEP | Brookfield Renewable | | Utilities | 20.77 | 32 | 0.92% | -1.28% |
| STKL | SunOpta | | Consumer Staples | 5.96 | 27 | 1.02% | -1.32% |
| OTEX | Open Text | | Technology | 35.05 | 32 | 0.86% | -1.32% |
| BBAR | Banco BBVA | | Financials | 8.57 | 83 | 6.20% | -1.38% |
| BSBR | Banco Santander | | Financials | 5.25 | 32 | 2.54% | -1.50% |
| VSTA | Vasta Platform | | Consumer Staples | 3.75 | 10 | 0.00% | -1.57% |
| NG | NovaGold Resources | | Materials | 3.10 | 61 | 0.98% | -1.59% |
| CP | Canadian Pacific | | Transports | 84.68 | 61 | 0.88% | -1.59% |
| TECK | Teck Resources | | Materials | 47.13 | 71 | -1.24% | -1.61% |
| RCI | Rogers | | Technology | 38.54 | 42 | 0.63% | -1.61% |
| STN | Stantec | | Services & Goods | 78.92 | 10 | -0.38% | -1.62% |
| BGI | Birks | | Services & Goods | 2.85 | 45 | -3.10% | -1.76% |
| SBS | Companhia de | | Utilities | 15.49 | 25 | -1.59% | -1.90% |
| CRESY | Cresud Sociedad | | Consumer Staples | 9.17 | 80 | 4.44% | -1.93% |
| OR | Osisko Gold | | Materials | 16.11 | 68 | -0.31% | -1.95% |
| TFPM | Triple Flag | | Materials | 15.58 | 71 | -1.95% | -2.01% |
| UGP | Ultrapar Participacoes | | Energy | 5.15 | 17 | 1.38% | -2.09% |
| To view more stocks, click on Next / Previous arrows or select different range: 0 - 25 , 25 - 50 , 50 - 75 , 75 - 100 , 100 - 125 , 125 - 150 , 150 - 175 , 175 - 200 , 200 - 225 | ||
 | Click To Change The Sort Order: By Market Cap or Company Size Performance: Year-to-date, Week and Day |  |
| Detailed Overview Of Latin America Stocks |
| Latin America Technical Overview, Leaders & Laggards, Top Latin America ETF Funds & Detailed Latin America Stocks List, Charts, Trends & More |
| Latin America: Technical Analysis, Trends & YTD Performance | |
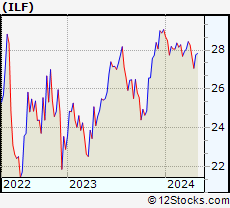
 ILF Weekly Chart |
|
| Long Term Trend: Not Good | |
| Medium Term Trend: Not Good | |
 ILF Daily Chart |
|
| Short Term Trend: Very Good | |
| Overall Trend Score: 32 | |
| YTD Performance: -6.85% | |
| **Trend Scores & Views Are Only For Educational Purposes And Not For Investing | |
| 12Stocks.com: Investing in Latin America Index using Exchange Traded Funds | |
|
The following table shows list of key exchange traded funds (ETF) that
help investors play Latin America stock market. For detailed view, check out our ETF Funds section of our website. Quick View: Move mouse or cursor over ETF symbol (ticker) to view short-term technical chart and over ETF name to view long term chart. Click on ticker or stock name for detailed view. Click on to add stock symbol to your watchlist and to view watchlist. |
12Stocks.com List of ETFs that track Latin America Index
| Ticker | ETF Name | Watchlist | Recent Price | Market Intelligence Score | Change % | Week % | Year-to-date % |
| ILF | Latin America 40 | | 27.07 | 32 | 1.20 | -2.1 | -6.85% |
| EWC | Canada | | 37.11 | 68 | 0.71 | -0.11 | 1.17% |
| FLN | Latin America AlphaDEX | | 19.22 | 10 | 0.68 | -5.78 | -7.55% |
| EWZ | Brazil | | 30.74 | 32 | 2.09 | -1.69 | -12.07% |
| EWW | Mexico | | 64.89 | 18 | -0.05 | -3.75 | -4.36% |
| ARGT | Argentina | | 53.47 | 43 | 1.06 | -3.88 | 4.15% |
| EWZS | Brazil Small-Cap | | 13.00 | 17 | 1.56 | -4.02 | -13.68% |
| BRF | Brazil Small-Cap | | 14.86 | 17 | 1.57 | -4.53 | -15.51% |
| BZQ | Short Brazil | | 12.77 | 73 | -3.70 | 3.74 | 27.32% |
| BRZU | Brazil Bull 3X | | 76.80 | 32 | 4.18 | -3.72 | -25.35% |
| FBZ | Brazil AlphaDEX | | 11.24 | 17 | 1.94 | -5.15 | -8.03% |
| 12Stocks.com: Charts, Trends, Fundamental Data and Performances of Latin America Stocks | |
|
We now take in-depth look at all Latin America stocks including charts, multi-period performances and overall trends (as measured by market intelligence score). One can sort Latin America stocks (click link to choose) by Daily, Weekly and by Year-to-Date performances. Also, one can sort by size of the company or by market capitalization. |
| Select Your Default Chart Type: | |||||
| |||||
| Click on stock symbol or name for detailed view. Click on to add stock symbol to your watchlist and to view watchlist. Quick View: Move mouse or cursor over "Daily" to quickly view daily technical stock chart and over "Weekly" to view weekly technical stock chart. | |||||

 | RBA Ritchie Bros. Auctioneers Incorporated |
| Sector: Services & Goods | |
| SubSector: Business Services | |
| MarketCap: 3491.02 Millions | |
| Recent Price: 72.61 Market Intelligence Score: 36 | |
| Day Percent Change: 0.17% Day Change: 0.12 | |
| Week Change: -0.97% Year-to-date Change: 8.6% | |
| RBA Links: Profile News Message Board | |
| Charts:- Daily , Weekly | |
| Add RBA to Watchlist: View: Get Complete RBA Trend Analysis ➞ | |
 | QSR Restaurant Brands International Inc. |
| Sector: Services & Goods | |
| SubSector: Restaurants | |
| MarketCap: 9551 Millions | |
| Recent Price: 71.42 Market Intelligence Score: 32 | |
| Day Percent Change: 0.08% Day Change: 0.06 | |
| Week Change: -1.09% Year-to-date Change: -8.6% | |
| QSR Links: Profile News Message Board | |
| Charts:- Daily , Weekly | |
| Add QSR to Watchlist: View: Get Complete QSR Trend Analysis ➞ | |
 | GIL Gildan Activewear Inc. |
| Sector: Consumer Staples | |
| SubSector: Textile - Apparel Clothing | |
| MarketCap: 2411.65 Millions | |
| Recent Price: 35.20 Market Intelligence Score: 41 | |
| Day Percent Change: 0.23% Day Change: 0.08 | |
| Week Change: -1.1% Year-to-date Change: 6.5% | |
| GIL Links: Profile News Message Board | |
| Charts:- Daily , Weekly | |
| Add GIL to Watchlist: View: Get Complete GIL Trend Analysis ➞ | |
 | TRP TC Energy Corporation |
| Sector: Energy | |
| SubSector: Oil & Gas Pipelines | |
| MarketCap: 44071.1 Millions | |
| Recent Price: 35.70 Market Intelligence Score: 32 | |
| Day Percent Change: 1.16% Day Change: 0.41 | |
| Week Change: -1.14% Year-to-date Change: -8.7% | |
| TRP Links: Profile News Message Board | |
| Charts:- Daily , Weekly | |
| Add TRP to Watchlist: View: Get Complete TRP Trend Analysis ➞ | |
 | WPRT Westport Fuel Systems Inc. |
| Sector: Consumer Staples | |
| SubSector: Auto Parts | |
| MarketCap: 108.939 Millions | |
| Recent Price: 5.74 Market Intelligence Score: 18 | |
| Day Percent Change: 0.70% Day Change: 0.04 | |
| Week Change: -1.2% Year-to-date Change: -13.3% | |
| WPRT Links: Profile News Message Board | |
| Charts:- Daily , Weekly | |
| Add WPRT to Watchlist: View: Get Complete WPRT Trend Analysis ➞ | |
 | TGB Taseko Mines Limited |
| Sector: Materials | |
| SubSector: Industrial Metals & Minerals | |
| MarketCap: 55.991 Millions | |
| Recent Price: 2.46 Market Intelligence Score: 63 | |
| Day Percent Change: -2.77% Day Change: -0.07 | |
| Week Change: -1.2% Year-to-date Change: 75.7% | |
| TGB Links: Profile News Message Board | |
| Charts:- Daily , Weekly | |
| Add TGB to Watchlist: View: Get Complete TGB Trend Analysis ➞ | |
 | VTMX Vesta Financials Corp SAB de CV |
| Sector: Financials | |
| SubSector: REIT - Industrial | |
| MarketCap: 2270 Millions | |
| Recent Price: 35.24 Market Intelligence Score: 25 | |
| Day Percent Change: 0.01% Day Change: 0.01 | |
| Week Change: -1.26% Year-to-date Change: -11.4% | |
| VTMX Links: Profile News Message Board | |
| Charts:- Daily , Weekly | |
| Add VTMX to Watchlist: View: Get Complete VTMX Trend Analysis ➞ | |
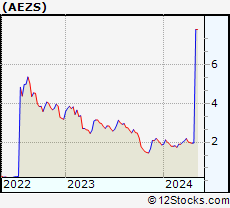 | AEZS Aeterna Zentaris Inc. |
| Sector: Health Care | |
| SubSector: Biotechnology | |
| MarketCap: 13.6785 Millions | |
| Recent Price: 1.95 Market Intelligence Score: 46 | |
| Day Percent Change: -0.36% Day Change: -0.01 | |
| Week Change: -1.27% Year-to-date Change: 4.8% | |
| AEZS Links: Profile News Message Board | |
| Charts:- Daily , Weekly | |
| Add AEZS to Watchlist: View: Get Complete AEZS Trend Analysis ➞ | |
 | BEP Brookfield Renewable Partners L.P. |
| Sector: Utilities | |
| SubSector: Diversified Utilities | |
| MarketCap: 6419.9 Millions | |
| Recent Price: 20.77 Market Intelligence Score: 32 | |
| Day Percent Change: 0.92% Day Change: 0.19 | |
| Week Change: -1.28% Year-to-date Change: -21.0% | |
| BEP Links: Profile News Message Board | |
| Charts:- Daily , Weekly | |
| Add BEP to Watchlist: View: Get Complete BEP Trend Analysis ➞ | |
 | STKL SunOpta Inc. |
| Sector: Consumer Staples | |
| SubSector: Processed & Packaged Goods | |
| MarketCap: 174.548 Millions | |
| Recent Price: 5.96 Market Intelligence Score: 27 | |
| Day Percent Change: 1.02% Day Change: 0.06 | |
| Week Change: -1.32% Year-to-date Change: 9.0% | |
| STKL Links: Profile News Message Board | |
| Charts:- Daily , Weekly | |
| Add STKL to Watchlist: View: Get Complete STKL Trend Analysis ➞ | |
 | OTEX Open Text Corporation |
| Sector: Technology | |
| SubSector: Application Software | |
| MarketCap: 9291.92 Millions | |
| Recent Price: 35.05 Market Intelligence Score: 32 | |
| Day Percent Change: 0.86% Day Change: 0.30 | |
| Week Change: -1.32% Year-to-date Change: -16.6% | |
| OTEX Links: Profile News Message Board | |
| Charts:- Daily , Weekly | |
| Add OTEX to Watchlist: View: Get Complete OTEX Trend Analysis ➞ | |
 | BBAR Banco BBVA Argentina S.A. |
| Sector: Financials | |
| SubSector: Foreign Regional Banks | |
| MarketCap: 895.479 Millions | |
| Recent Price: 8.57 Market Intelligence Score: 83 | |
| Day Percent Change: 6.20% Day Change: 0.50 | |
| Week Change: -1.38% Year-to-date Change: 57.5% | |
| BBAR Links: Profile News Message Board | |
| Charts:- Daily , Weekly | |
| Add BBAR to Watchlist: View: Get Complete BBAR Trend Analysis ➞ | |
 | BSBR Banco Santander (Brasil) S.A. |
| Sector: Financials | |
| SubSector: Foreign Regional Banks | |
| MarketCap: 21961.4 Millions | |
| Recent Price: 5.25 Market Intelligence Score: 32 | |
| Day Percent Change: 2.54% Day Change: 0.13 | |
| Week Change: -1.5% Year-to-date Change: -19.9% | |
| BSBR Links: Profile News Message Board | |
| Charts:- Daily , Weekly | |
| Add BSBR to Watchlist: View: Get Complete BSBR Trend Analysis ➞ | |
 | VSTA Vasta Platform Limited |
| Sector: Consumer Staples | |
| SubSector: Education & Training Services | |
| MarketCap: 12747 Millions | |
| Recent Price: 3.75 Market Intelligence Score: 10 | |
| Day Percent Change: 0.00% Day Change: 0.00 | |
| Week Change: -1.57% Year-to-date Change: -14.8% | |
| VSTA Links: Profile News Message Board | |
| Charts:- Daily , Weekly | |
| Add VSTA to Watchlist: View: Get Complete VSTA Trend Analysis ➞ | |
 | NG NovaGold Resources Inc. |
| Sector: Materials | |
| SubSector: Gold | |
| MarketCap: 2499.49 Millions | |
| Recent Price: 3.10 Market Intelligence Score: 61 | |
| Day Percent Change: 0.98% Day Change: 0.03 | |
| Week Change: -1.59% Year-to-date Change: -17.1% | |
| NG Links: Profile News Message Board | |
| Charts:- Daily , Weekly | |
| Add NG to Watchlist: View: Get Complete NG Trend Analysis ➞ | |
 | CP Canadian Pacific Railway Limited |
| Sector: Transports | |
| SubSector: Railroads | |
| MarketCap: 25428.5 Millions | |
| Recent Price: 84.68 Market Intelligence Score: 61 | |
| Day Percent Change: 0.88% Day Change: 0.74 | |
| Week Change: -1.59% Year-to-date Change: 7.1% | |
| CP Links: Profile News Message Board | |
| Charts:- Daily , Weekly | |
| Add CP to Watchlist: View: Get Complete CP Trend Analysis ➞ | |
 | TECK Teck Resources Limited |
| Sector: Materials | |
| SubSector: Industrial Metals & Minerals | |
| MarketCap: 4347.4 Millions | |
| Recent Price: 47.13 Market Intelligence Score: 71 | |
| Day Percent Change: -1.24% Day Change: -0.59 | |
| Week Change: -1.61% Year-to-date Change: 11.5% | |
| TECK Links: Profile News Message Board | |
| Charts:- Daily , Weekly | |
| Add TECK to Watchlist: View: Get Complete TECK Trend Analysis ➞ | |
 | RCI Rogers Communications Inc. |
| Sector: Technology | |
| SubSector: Wireless Communications | |
| MarketCap: 22111.6 Millions | |
| Recent Price: 38.54 Market Intelligence Score: 42 | |
| Day Percent Change: 0.63% Day Change: 0.24 | |
| Week Change: -1.61% Year-to-date Change: -17.7% | |
| RCI Links: Profile News Message Board | |
| Charts:- Daily , Weekly | |
| Add RCI to Watchlist: View: Get Complete RCI Trend Analysis ➞ | |
 | STN Stantec Inc. |
| Sector: Services & Goods | |
| SubSector: Business Services | |
| MarketCap: 2855.92 Millions | |
| Recent Price: 78.92 Market Intelligence Score: 10 | |
| Day Percent Change: -0.38% Day Change: -0.30 | |
| Week Change: -1.62% Year-to-date Change: -1.6% | |
| STN Links: Profile News Message Board | |
| Charts:- Daily , Weekly | |
| Add STN to Watchlist: View: Get Complete STN Trend Analysis ➞ | |
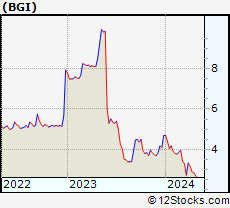 | BGI Birks Group Inc. |
| Sector: Services & Goods | |
| SubSector: Jewelry Stores | |
| MarketCap: 9 Millions | |
| Recent Price: 2.85 Market Intelligence Score: 45 | |
| Day Percent Change: -3.10% Day Change: -0.09 | |
| Week Change: -1.76% Year-to-date Change: -39.3% | |
| BGI Links: Profile News Message Board | |
| Charts:- Daily , Weekly | |
| Add BGI to Watchlist: View: Get Complete BGI Trend Analysis ➞ | |
 | SBS Companhia de Saneamento Basico do Estado de Sao Paulo - SABESP |
| Sector: Utilities | |
| SubSector: Water Utilities | |
| MarketCap: 5498.72 Millions | |
| Recent Price: 15.49 Market Intelligence Score: 25 | |
| Day Percent Change: -1.59% Day Change: -0.25 | |
| Week Change: -1.9% Year-to-date Change: 1.7% | |
| SBS Links: Profile News Message Board | |
| Charts:- Daily , Weekly | |
| Add SBS to Watchlist: View: Get Complete SBS Trend Analysis ➞ | |
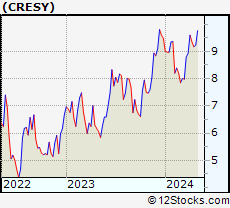 | CRESY Cresud Sociedad Anonima Comercial, Inmobiliaria, Financiera y Agropecuaria |
| Sector: Consumer Staples | |
| SubSector: Farm Products | |
| MarketCap: 224.187 Millions | |
| Recent Price: 9.17 Market Intelligence Score: 80 | |
| Day Percent Change: 4.44% Day Change: 0.39 | |
| Week Change: -1.93% Year-to-date Change: -3.3% | |
| CRESY Links: Profile News Message Board | |
| Charts:- Daily , Weekly | |
| Add CRESY to Watchlist: View: Get Complete CRESY Trend Analysis ➞ | |
 | OR Osisko Gold Royalties Ltd |
| Sector: Materials | |
| SubSector: Gold | |
| MarketCap: 1025.99 Millions | |
| Recent Price: 16.11 Market Intelligence Score: 68 | |
| Day Percent Change: -0.31% Day Change: -0.05 | |
| Week Change: -1.95% Year-to-date Change: 12.8% | |
| OR Links: Profile News Message Board | |
| Charts:- Daily , Weekly | |
| Add OR to Watchlist: View: Get Complete OR Trend Analysis ➞ | |
 | TFPM Triple Flag Precious Metals Corp. |
| Sector: Materials | |
| SubSector: Other Precious Metals & Mining | |
| MarketCap: 3640 Millions | |
| Recent Price: 15.58 Market Intelligence Score: 71 | |
| Day Percent Change: -1.95% Day Change: -0.31 | |
| Week Change: -2.01% Year-to-date Change: 17.7% | |
| TFPM Links: Profile News Message Board | |
| Charts:- Daily , Weekly | |
| Add TFPM to Watchlist: View: Get Complete TFPM Trend Analysis ➞ | |
 | UGP Ultrapar Participacoes S.A. |
| Sector: Energy | |
| SubSector: Oil & Gas Refining & Marketing | |
| MarketCap: 3473.54 Millions | |
| Recent Price: 5.15 Market Intelligence Score: 17 | |
| Day Percent Change: 1.38% Day Change: 0.07 | |
| Week Change: -2.09% Year-to-date Change: -5.0% | |
| UGP Links: Profile News Message Board | |
| Charts:- Daily , Weekly | |
| Add UGP to Watchlist: View: Get Complete UGP Trend Analysis ➞ | |
| To view more stocks, click on Next / Previous arrows or select different range: 0 - 25 , 25 - 50 , 50 - 75 , 75 - 100 , 100 - 125 , 125 - 150 , 150 - 175 , 175 - 200 , 200 - 225 | ||
| Click To Change The Sort Order: By Market Cap or Company Size Performance: Year-to-date, Week and Day | |
| Select Chart Type: | ||
 Best Stocks Today 12Stocks.com |
© 2024 12Stocks.com Terms & Conditions Privacy Contact Us
All Information Provided Only For Education And Not To Be Used For Investing or Trading. See Terms & Conditions


One More Thing ... Get Best Stocks Delivered Daily!
Never Ever Miss A Move With Our Top Ten Stocks Lists
Find Best Stocks In Any Market - Bull or Bear Market
Take A Peek At Our Top Ten Stocks Lists: Daily, Weekly, Year-to-Date & Top Trends
Find Best Stocks In Any Market - Bull or Bear Market
Take A Peek At Our Top Ten Stocks Lists: Daily, Weekly, Year-to-Date & Top Trends
Latin America Stocks With Best Up Trends [0-bearish to 100-bullish]: SilverCrest Metals[100], Alamos Gold[100], Kinross Gold[93], Methanex [93], Agnico Eagle[93], Pan American[90], Crescent Point[88], IRSA Inversiones[88], Sandstorm Gold[88], Suncor Energy[88], Cenovus Energy[88]
Best Latin America Stocks Year-to-Date:
Aurora Cannabis[1256.57%], Fusion [121.04%], D-Wave Quantum[81.22%], Banco Macro[73.59%], Grupo Financiero[64.84%], Banco BBVA[57.54%], McEwen Mining[55.62%], Canopy Growth[55.38%], IAMGOLD [44.66%], OrganiGram [43.51%], Hudbay Minerals[41.12%] Best Latin America Stocks This Week:
Controladora Vuela[10.64%], SilverCrest Metals[9.57%], TransAlta [6.44%], Canada Goose[5.84%], Lululemon Athletica[4.86%], Petroleo Brasileiro[4.77%], Kinross Gold[4.48%], IMAX [4.26%], Agnico Eagle[3.89%], Ready Capital[3.61%], Sprott Physical[3.08%] Best Latin America Stocks Daily:
Vision Marine[7.40%], Banco BBVA[6.20%], Petroleo Brasileiro[5.71%], Cresud Sociedad[4.44%], SilverCrest Metals[4.36%], Kinross Gold[3.99%], SSR Mining[3.99%], Grupo Supervielle[3.77%], Aurinia [3.74%], Companhia Siderurgica[3.68%], Ambipar Emergency[3.48%]