
 Login Sign Up


| |||||
 |  | ||||

| 12Stocks.com Market Intelligence |
Best Latin America Stocks
|
|
| Quick Read: Top Latin America Stocks By Performances & Trends: Daily, Weekly, Year-to-Date, Market Cap (Size) & Technical Trends | |||
| Best Latin America Views: Quick Browse View, Summary & Slide Show | |||
| 12Stocks.com Latin America Stocks Performances & Trends Daily | |||||||||
|
|  The overall market intelligence score is 0 (0-bearish to 100-bullish) which puts Latin America index in short term bearish trend. The market intelligence score from previous trading session is 7 and hence a deterioration of trend.
| ||||||||
| Here are the market intelligence trend scores of the most requested Latin America stocks at 12Stocks.com (click stock name for detailed review): | |
| Scroll down this page for most comprehensive review of Latin America stocks by performance, trends, technical analysis, charts, fund plays & more | |


| 12Stocks.com: Top Performing Latin America Index Stocks | ||||||||||||||||||||||||||||||||||||||||||||||||
 The top performing Latin America Index stocks year to date are
Now, more recently, over last week, the top performing Latin America Index stocks on the move are


|
||||||||||||||||||||||||||||||||||||||||||||||||
| 12Stocks.com: Investing in Latin America Index with Stocks | |
|
The following table helps investors and traders sort through current performance and trends (as measured by market intelligence score) of various
stocks in the Latin America Index. Quick View: Move mouse or cursor over stock symbol (ticker) to view short-term technical chart and over stock name to view long term chart. Click on  to add stock symbol to your watchlist and to add stock symbol to your watchlist and  to view watchlist. Click on any ticker or stock name for detailed market intelligence report for that stock. to view watchlist. Click on any ticker or stock name for detailed market intelligence report for that stock. |
12Stocks.com Performance of Stocks in Latin America Index
| Ticker | Stock Name | Watchlist | Category | Recent Price | Market Intelligence Score | Change % | Weekly Change% |
| FSI | Flexible |   | Materials | 2.03 | 51 | 0.00% | -3.79% |
| NGD | New Gold | | Materials | 1.73 | 58 | 0.00% | -3.89% |
| BSBR | Banco Santander | | Financials | 5.12 | 17 | -0.19% | -3.94% |
| KOF | Coca-Cola FEMSA | | Consumer Staples | 93.24 | 0 | 1.36% | -4.00% |
| LVRO | Lavoro | | Materials | 5.84 | 17 | 0.09% | -4.02% |
| ERF | Enerplus | | Energy | 19.83 | 51 | -1.10% | -4.06% |
| FMX | Fomento Economico | | Consumer Staples | 119.07 | 17 | 0.11% | -4.16% |
| PAC | Grupo Aeroportuario | | Transports | 155.90 | 23 | 1.04% | -4.21% |
| VET | Vermilion Energy | | Energy | 11.76 | 36 | -0.25% | -4.23% |
| NFGC | New Found | | Materials | 3.71 | 53 | 2.20% | -4.38% |
| CAE | CAE | | Industrials | 18.56 | 0 | -1.90% | -4.48% |
| DCBO | Docebo | | Technology | 44.34 | 58 | 0.28% | -4.63% |
| DNN | Denison Mines | | Materials | 2.01 | 48 | -0.50% | -4.74% |
| GROY | Gold Royalty | | Materials | 1.92 | 68 | -0.52% | -4.95% |
| TLRY | Tilray | | Health Care | 1.73 | 15 | 0.58% | -4.95% |
| ITUB | Itau Unibanco | | Financials | 6.03 | 17 | -0.33% | -5.04% |
| BBD | Banco Bradesco | | Financials | 2.63 | 10 | -0.75% | -5.05% |
| MELI | MercadoLibre | | Services & Goods | 1370.00 | 0 | -1.99% | -5.13% |
| EBR | Centrais Eletricas | | Utilities | 7.25 | 10 | -0.28% | -5.23% |
| STNE | StoneCo | | Technology | 15.26 | 10 | 0.07% | -5.33% |
| MXE | Mexico Equity | | Financials | 10.74 | 0 | 0.00% | -5.37% |
| CIGI | Colliers | | Financials | 107.04 | 10 | -1.74% | -5.41% |
| AFYA | Afya | | Services & Goods | 16.04 | 10 | -1.44% | -5.45% |
| OMAB | Grupo Aeroportuario | | Transports | 75.19 | 36 | -1.22% | -5.49% |
| CRON | Cronos | | Health Care | 2.40 | 41 | -0.83% | -5.51% |
| To view more stocks, click on Next / Previous arrows or select different range: 0 - 25 , 25 - 50 , 50 - 75 , 75 - 100 , 100 - 125 , 125 - 150 , 150 - 175 , 175 - 200 , 200 - 225 | ||
 | Click To Change The Sort Order: By Market Cap or Company Size Performance: Year-to-date, Week and Day |  |
| Detailed Overview Of Latin America Stocks |
| Latin America Technical Overview, Leaders & Laggards, Top Latin America ETF Funds & Detailed Latin America Stocks List, Charts, Trends & More |
| Latin America: Technical Analysis, Trends & YTD Performance | |
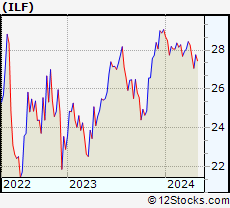
 ILF Weekly Chart |
|
| Long Term Trend: Not Good | |
| Medium Term Trend: Not Good | |
 ILF Daily Chart |
|
| Short Term Trend: Not Good | |
| Overall Trend Score: 0 | |
| YTD Performance: -7.95% | |
| **Trend Scores & Views Are Only For Educational Purposes And Not For Investing | |
| 12Stocks.com: Investing in Latin America Index using Exchange Traded Funds | |
|
The following table shows list of key exchange traded funds (ETF) that
help investors play Latin America stock market. For detailed view, check out our ETF Funds section of our website. Quick View: Move mouse or cursor over ETF symbol (ticker) to view short-term technical chart and over ETF name to view long term chart. Click on ticker or stock name for detailed view. Click on to add stock symbol to your watchlist and to view watchlist. |
12Stocks.com List of ETFs that track Latin America Index
| Ticker | ETF Name | Watchlist | Recent Price | Market Intelligence Score | Change % | Week % | Year-to-date % |
| ILF | Latin America 40 | | 26.75 | 0 | -0.22 | -3.25 | -7.95% |
| EWC | Canada | | 36.85 | 56 | 0.22 | -0.81 | 0.46% |
| FLN | Latin America AlphaDEX | | 19.07 | 10 | -0.60 | -6.52 | -8.27% |
| EWZ | Brazil | | 30.11 | 7 | -0.20 | -3.71 | -13.87% |
| EWW | Mexico | | 64.92 | 0 | 0.00 | -3.71 | -4.32% |
| ARGT | Argentina | | 53.00 | 36 | -0.06 | -4.73 | 3.23% |
| EWZS | Brazil Small-Cap | | 12.81 | 10 | -0.54 | -5.43 | -14.94% |
| BRF | Brazil Small-Cap | | 14.63 | 18 | -0.73 | -6.01 | -16.82% |
| BZQ | Short Brazil | | 13.16 | 90 | -0.38 | 6.9 | 31.21% |
| BRZU | Brazil Bull 3X | | 73.72 | 7 | -0.54 | -7.58 | -28.34% |
| FBZ | Brazil AlphaDEX | | 11.16 | 17 | 0.09 | -5.82 | -8.69% |
| 12Stocks.com: Charts, Trends, Fundamental Data and Performances of Latin America Stocks | |
|
We now take in-depth look at all Latin America stocks including charts, multi-period performances and overall trends (as measured by market intelligence score). One can sort Latin America stocks (click link to choose) by Daily, Weekly and by Year-to-Date performances. Also, one can sort by size of the company or by market capitalization. |
| Select Your Default Chart Type: | |||||
| |||||
| Click on stock symbol or name for detailed view. Click on to add stock symbol to your watchlist and to view watchlist. Quick View: Move mouse or cursor over "Daily" to quickly view daily technical stock chart and over "Weekly" to view weekly technical stock chart. | |||||

 | FSI Flexible Solutions International Inc. |
| Sector: Materials | |
| SubSector: Specialty Chemicals | |
| MarketCap: 14.3357 Millions | |
| Recent Price: 2.03 Market Intelligence Score: 51 | |
| Day Percent Change: 0.00% Day Change: 0.00 | |
| Week Change: -3.79% Year-to-date Change: 6.3% | |
| FSI Links: Profile News Message Board | |
| Charts:- Daily , Weekly | |
| Add FSI to Watchlist: View: Get Complete FSI Trend Analysis ➞ | |
 | NGD New Gold Inc. |
| Sector: Materials | |
| SubSector: Gold | |
| MarketCap: 398.119 Millions | |
| Recent Price: 1.73 Market Intelligence Score: 58 | |
| Day Percent Change: 0.00% Day Change: 0.00 | |
| Week Change: -3.89% Year-to-date Change: 18.5% | |
| NGD Links: Profile News Message Board | |
| Charts:- Daily , Weekly | |
| Add NGD to Watchlist: View: Get Complete NGD Trend Analysis ➞ | |
 | BSBR Banco Santander (Brasil) S.A. |
| Sector: Financials | |
| SubSector: Foreign Regional Banks | |
| MarketCap: 21961.4 Millions | |
| Recent Price: 5.12 Market Intelligence Score: 17 | |
| Day Percent Change: -0.19% Day Change: -0.01 | |
| Week Change: -3.94% Year-to-date Change: -21.8% | |
| BSBR Links: Profile News Message Board | |
| Charts:- Daily , Weekly | |
| Add BSBR to Watchlist: View: Get Complete BSBR Trend Analysis ➞ | |
 | KOF Coca-Cola FEMSA, S.A.B. de C.V. |
| Sector: Consumer Staples | |
| SubSector: Beverages - Soft Drinks | |
| MarketCap: 2258.9 Millions | |
| Recent Price: 93.24 Market Intelligence Score: 0 | |
| Day Percent Change: 1.36% Day Change: 1.25 | |
| Week Change: -4% Year-to-date Change: -1.5% | |
| KOF Links: Profile News Message Board | |
| Charts:- Daily , Weekly | |
| Add KOF to Watchlist: View: Get Complete KOF Trend Analysis ➞ | |
 | LVRO Lavoro Limited |
| Sector: Materials | |
| SubSector: Agricultural Inputs | |
| MarketCap: 686 Millions | |
| Recent Price: 5.84 Market Intelligence Score: 17 | |
| Day Percent Change: 0.09% Day Change: 0.00 | |
| Week Change: -4.02% Year-to-date Change: -34.2% | |
| LVRO Links: Profile News Message Board | |
| Charts:- Daily , Weekly | |
| Add LVRO to Watchlist: View: Get Complete LVRO Trend Analysis ➞ | |
 | ERF Enerplus Corporation |
| Sector: Energy | |
| SubSector: Oil & Gas Drilling & Exploration | |
| MarketCap: 372.639 Millions | |
| Recent Price: 19.83 Market Intelligence Score: 51 | |
| Day Percent Change: -1.10% Day Change: -0.22 | |
| Week Change: -4.06% Year-to-date Change: 29.3% | |
| ERF Links: Profile News Message Board | |
| Charts:- Daily , Weekly | |
| Add ERF to Watchlist: View: Get Complete ERF Trend Analysis ➞ | |
 | FMX Fomento Economico Mexicano, S.A.B. de C.V. |
| Sector: Consumer Staples | |
| SubSector: Beverages - Brewers | |
| MarketCap: 22018.7 Millions | |
| Recent Price: 119.07 Market Intelligence Score: 17 | |
| Day Percent Change: 0.11% Day Change: 0.13 | |
| Week Change: -4.16% Year-to-date Change: -8.7% | |
| FMX Links: Profile News Message Board | |
| Charts:- Daily , Weekly | |
| Add FMX to Watchlist: View: Get Complete FMX Trend Analysis ➞ | |
 | PAC Grupo Aeroportuario del Pacifico, S.A.B. de C.V. |
| Sector: Transports | |
| SubSector: Air Services, Other | |
| MarketCap: 3204.18 Millions | |
| Recent Price: 155.90 Market Intelligence Score: 23 | |
| Day Percent Change: 1.04% Day Change: 1.61 | |
| Week Change: -4.21% Year-to-date Change: -11.0% | |
| PAC Links: Profile News Message Board | |
| Charts:- Daily , Weekly | |
| Add PAC to Watchlist: View: Get Complete PAC Trend Analysis ➞ | |
 | VET Vermilion Energy Inc. |
| Sector: Energy | |
| SubSector: Oil & Gas Drilling & Exploration | |
| MarketCap: 335.839 Millions | |
| Recent Price: 11.76 Market Intelligence Score: 36 | |
| Day Percent Change: -0.25% Day Change: -0.03 | |
| Week Change: -4.23% Year-to-date Change: -2.5% | |
| VET Links: Profile News Message Board | |
| Charts:- Daily , Weekly | |
| Add VET to Watchlist: View: Get Complete VET Trend Analysis ➞ | |
 | NFGC New Found Gold Corp. |
| Sector: Materials | |
| SubSector: Gold | |
| MarketCap: 868 Millions | |
| Recent Price: 3.71 Market Intelligence Score: 53 | |
| Day Percent Change: 2.20% Day Change: 0.08 | |
| Week Change: -4.38% Year-to-date Change: 5.4% | |
| NFGC Links: Profile News Message Board | |
| Charts:- Daily , Weekly | |
| Add NFGC to Watchlist: View: Get Complete NFGC Trend Analysis ➞ | |
 | CAE CAE Inc. |
| Sector: Industrials | |
| SubSector: Aerospace/Defense Products & Services | |
| MarketCap: 3739.61 Millions | |
| Recent Price: 18.56 Market Intelligence Score: 0 | |
| Day Percent Change: -1.90% Day Change: -0.36 | |
| Week Change: -4.48% Year-to-date Change: -14.0% | |
| CAE Links: Profile News Message Board | |
| Charts:- Daily , Weekly | |
| Add CAE to Watchlist: View: Get Complete CAE Trend Analysis ➞ | |
 | DCBO Docebo Inc. |
| Sector: Technology | |
| SubSector: Software Application | |
| MarketCap: 15787 Millions | |
| Recent Price: 44.34 Market Intelligence Score: 58 | |
| Day Percent Change: 0.28% Day Change: 0.13 | |
| Week Change: -4.63% Year-to-date Change: -8.4% | |
| DCBO Links: Profile News Message Board | |
| Charts:- Daily , Weekly | |
| Add DCBO to Watchlist: View: Get Complete DCBO Trend Analysis ➞ | |
 | DNN Denison Mines Corp. |
| Sector: Materials | |
| SubSector: Industrial Metals & Minerals | |
| MarketCap: 154.11 Millions | |
| Recent Price: 2.01 Market Intelligence Score: 48 | |
| Day Percent Change: -0.50% Day Change: -0.01 | |
| Week Change: -4.74% Year-to-date Change: 13.6% | |
| DNN Links: Profile News Message Board | |
| Charts:- Daily , Weekly | |
| Add DNN to Watchlist: View: Get Complete DNN Trend Analysis ➞ | |
 | GROY Gold Royalty Corp. |
| Sector: Materials | |
| SubSector: Other Precious Metals & Mining | |
| MarketCap: 254 Millions | |
| Recent Price: 1.92 Market Intelligence Score: 68 | |
| Day Percent Change: -0.52% Day Change: -0.01 | |
| Week Change: -4.95% Year-to-date Change: 32.9% | |
| GROY Links: Profile News Message Board | |
| Charts:- Daily , Weekly | |
| Add GROY to Watchlist: View: Get Complete GROY Trend Analysis ➞ | |
 | TLRY Tilray, Inc. |
| Sector: Health Care | |
| SubSector: Drug Manufacturers - Other | |
| MarketCap: 452.533 Millions | |
| Recent Price: 1.73 Market Intelligence Score: 15 | |
| Day Percent Change: 0.58% Day Change: 0.01 | |
| Week Change: -4.95% Year-to-date Change: -24.8% | |
| TLRY Links: Profile News Message Board | |
| Charts:- Daily , Weekly | |
| Add TLRY to Watchlist: View: Get Complete TLRY Trend Analysis ➞ | |
 | ITUB Itau Unibanco Holding S.A. |
| Sector: Financials | |
| SubSector: Foreign Regional Banks | |
| MarketCap: 48121 Millions | |
| Recent Price: 6.03 Market Intelligence Score: 17 | |
| Day Percent Change: -0.33% Day Change: -0.02 | |
| Week Change: -5.04% Year-to-date Change: -13.2% | |
| ITUB Links: Profile News Message Board | |
| Charts:- Daily , Weekly | |
| Add ITUB to Watchlist: View: Get Complete ITUB Trend Analysis ➞ | |
 | BBD Banco Bradesco S.A. |
| Sector: Financials | |
| SubSector: Foreign Regional Banks | |
| MarketCap: 30281.7 Millions | |
| Recent Price: 2.63 Market Intelligence Score: 10 | |
| Day Percent Change: -0.75% Day Change: -0.02 | |
| Week Change: -5.05% Year-to-date Change: -24.9% | |
| BBD Links: Profile News Message Board | |
| Charts:- Daily , Weekly | |
| Add BBD to Watchlist: View: Get Complete BBD Trend Analysis ➞ | |
 | MELI MercadoLibre, Inc. |
| Sector: Services & Goods | |
| SubSector: Catalog & Mail Order Houses | |
| MarketCap: 24695.5 Millions | |
| Recent Price: 1370.00 Market Intelligence Score: 0 | |
| Day Percent Change: -1.99% Day Change: -27.86 | |
| Week Change: -5.13% Year-to-date Change: -12.8% | |
| MELI Links: Profile News Message Board | |
| Charts:- Daily , Weekly | |
| Add MELI to Watchlist: View: Get Complete MELI Trend Analysis ➞ | |
 | EBR Centrais Eletricas Brasileiras S.A. - Eletrobras |
| Sector: Utilities | |
| SubSector: Electric Utilities | |
| MarketCap: 5459.84 Millions | |
| Recent Price: 7.25 Market Intelligence Score: 10 | |
| Day Percent Change: -0.28% Day Change: -0.02 | |
| Week Change: -5.23% Year-to-date Change: -15.9% | |
| EBR Links: Profile News Message Board | |
| Charts:- Daily , Weekly | |
| Add EBR to Watchlist: View: Get Complete EBR Trend Analysis ➞ | |
 | STNE StoneCo Ltd. |
| Sector: Technology | |
| SubSector: Application Software | |
| MarketCap: 7347.82 Millions | |
| Recent Price: 15.26 Market Intelligence Score: 10 | |
| Day Percent Change: 0.07% Day Change: 0.01 | |
| Week Change: -5.33% Year-to-date Change: -15.4% | |
| STNE Links: Profile News Message Board | |
| Charts:- Daily , Weekly | |
| Add STNE to Watchlist: View: Get Complete STNE Trend Analysis ➞ | |
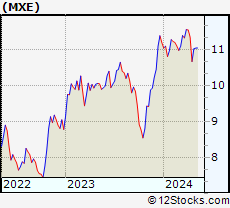 | MXE Mexico Equity & Income Fund Inc. |
| Sector: Financials | |
| SubSector: Asset Management | |
| MarketCap: 34.6203 Millions | |
| Recent Price: 10.74 Market Intelligence Score: 0 | |
| Day Percent Change: 0.00% Day Change: 0.00 | |
| Week Change: -5.37% Year-to-date Change: -4.1% | |
| MXE Links: Profile News Message Board | |
| Charts:- Daily , Weekly | |
| Add MXE to Watchlist: View: Get Complete MXE Trend Analysis ➞ | |
 | CIGI Colliers International Group Inc. |
| Sector: Financials | |
| SubSector: Property Management | |
| MarketCap: 1928.42 Millions | |
| Recent Price: 107.04 Market Intelligence Score: 10 | |
| Day Percent Change: -1.74% Day Change: -1.90 | |
| Week Change: -5.41% Year-to-date Change: -15.4% | |
| CIGI Links: Profile News Message Board | |
| Charts:- Daily , Weekly | |
| Add CIGI to Watchlist: View: Get Complete CIGI Trend Analysis ➞ | |
 | AFYA Afya Limited |
| Sector: Services & Goods | |
| SubSector: Education & Training Services | |
| MarketCap: 1559.26 Millions | |
| Recent Price: 16.04 Market Intelligence Score: 10 | |
| Day Percent Change: -1.44% Day Change: -0.23 | |
| Week Change: -5.45% Year-to-date Change: -26.9% | |
| AFYA Links: Profile News Message Board | |
| Charts:- Daily , Weekly | |
| Add AFYA to Watchlist: View: Get Complete AFYA Trend Analysis ➞ | |
 | OMAB Grupo Aeroportuario del Centro Norte, S.A.B. de C.V. |
| Sector: Transports | |
| SubSector: Air Services, Other | |
| MarketCap: 1196.38 Millions | |
| Recent Price: 75.19 Market Intelligence Score: 36 | |
| Day Percent Change: -1.22% Day Change: -0.93 | |
| Week Change: -5.49% Year-to-date Change: -11.2% | |
| OMAB Links: Profile News Message Board | |
| Charts:- Daily , Weekly | |
| Add OMAB to Watchlist: View: Get Complete OMAB Trend Analysis ➞ | |
 | CRON Cronos Group Inc. |
| Sector: Health Care | |
| SubSector: Biotechnology | |
| MarketCap: 1935.95 Millions | |
| Recent Price: 2.40 Market Intelligence Score: 41 | |
| Day Percent Change: -0.83% Day Change: -0.02 | |
| Week Change: -5.51% Year-to-date Change: 14.8% | |
| CRON Links: Profile News Message Board | |
| Charts:- Daily , Weekly | |
| Add CRON to Watchlist: View: Get Complete CRON Trend Analysis ➞ | |
| To view more stocks, click on Next / Previous arrows or select different range: 0 - 25 , 25 - 50 , 50 - 75 , 75 - 100 , 100 - 125 , 125 - 150 , 150 - 175 , 175 - 200 , 200 - 225 | ||
| Click To Change The Sort Order: By Market Cap or Company Size Performance: Year-to-date, Week and Day | |
| Select Chart Type: | ||
 Best Stocks Today 12Stocks.com |
© 2024 12Stocks.com Terms & Conditions Privacy Contact Us
All Information Provided Only For Education And Not To Be Used For Investing or Trading. See Terms & Conditions


One More Thing ... Get Best Stocks Delivered Daily!
Never Ever Miss A Move With Our Top Ten Stocks Lists
Find Best Stocks In Any Market - Bull or Bear Market
Take A Peek At Our Top Ten Stocks Lists: Daily, Weekly, Year-to-Date & Top Trends
Find Best Stocks In Any Market - Bull or Bear Market
Take A Peek At Our Top Ten Stocks Lists: Daily, Weekly, Year-to-Date & Top Trends
Latin America Stocks With Best Up Trends [0-bearish to 100-bullish]: IMAX [100], Ivanhoe Electric[93], Agnico Eagle[93], Teck Resources[88], Franco-Nevada [88], Sandstorm Gold[88], Kinross Gold[83], Suncor Energy[83], Triple Flag[83], Pan American[83], Sprott Physical[83]
Best Latin America Stocks Year-to-Date:
Aurora Cannabis[1276.52%], Fusion [121.25%], D-Wave Quantum[100.02%], Banco Macro[68.33%], Grupo Financiero[62.41%], McEwen Mining[53.12%], Canopy Growth[53.03%], Celestica [49.62%], Banco BBVA[48.35%], IAMGOLD [43.87%], OrganiGram [42.75%] Best Latin America Stocks This Week:
Controladora Vuela[11.35%], D-Wave Quantum[7.67%], TransAlta [6.11%], SilverCrest Metals[4.99%], Canada Goose[4.17%], IMAX [4.14%], Hudbay Minerals[3.41%], Lululemon Athletica[3.38%], Agnico Eagle[3.29%], Ivanhoe Electric[3.25%], Franco-Nevada [3.07%] Best Latin America Stocks Daily:
Canopy Growth[20.49%], Aurora Cannabis[13.21%], SilverCrest Metals[6.02%], D-Wave Quantum[5.09%], Controladora Vuela[4.53%], Ivanhoe Electric[3.95%], Hudbay Minerals[3.55%], TransAlta [3.38%], New Found[2.20%], OrganiGram [2.19%], Bausch +[2.03%]