
 Login Sign Up


| |||||
 |  | ||||

| 12Stocks.com Market Intelligence |
Best Latin America Stocks
|
|
| Quick Read: Top Latin America Stocks By Performances & Trends: Daily, Weekly, Year-to-Date, Market Cap (Size) & Technical Trends | |||
| Best Latin America Views: Quick Browse View, Summary & Slide Show | |||
| 12Stocks.com Latin America Stocks Performances & Trends Daily | |||||||||
|
|  The overall market intelligence score is 32 (0-bearish to 100-bullish) which puts Latin America index in short term bearish to neutral trend. The market intelligence score from previous trading session is 42 and hence a deterioration of trend.
| ||||||||
| Here are the market intelligence trend scores of the most requested Latin America stocks at 12Stocks.com (click stock name for detailed review): | |
| Scroll down this page for most comprehensive review of Latin America stocks by performance, trends, technical analysis, charts, fund plays & more | |


| 12Stocks.com: Top Performing Latin America Index Stocks | ||||||||||||||||||||||||||||||||||||||||||||||||
 The top performing Latin America Index stocks year to date are
Now, more recently, over last week, the top performing Latin America Index stocks on the move are


|
||||||||||||||||||||||||||||||||||||||||||||||||
| 12Stocks.com: Investing in Latin America Index with Stocks | |
|
The following table helps investors and traders sort through current performance and trends (as measured by market intelligence score) of various
stocks in the Latin America Index. Quick View: Move mouse or cursor over stock symbol (ticker) to view short-term technical chart and over stock name to view long term chart. Click on  to add stock symbol to your watchlist and to add stock symbol to your watchlist and  to view watchlist. Click on any ticker or stock name for detailed market intelligence report for that stock. to view watchlist. Click on any ticker or stock name for detailed market intelligence report for that stock. |
12Stocks.com Performance of Stocks in Latin America Index
| Ticker | Stock Name | Watchlist | Category | Recent Price | Market Intelligence Score | Change % | Weekly Change% |
| CSAN | Cosan S.A |   | Energy | 11.16 | 42 | -0.80% | 0.72% |
| FUSN | Fusion | | Health Care | 21.37 | 83 | -0.23% | 0.71% |
| RBA | Ritchie Bros. | | Services & Goods | 73.08 | 63 | -0.23% | 0.64% |
| TD | Toronto-Dominion Bank | | Financials | 58.46 | 59 | -0.78% | 0.64% |
| DCBO | Docebo | | Technology | 44.60 | 58 | -0.95% | 0.61% |
| AUPH | Aurinia | | Health Care | 5.02 | 50 | -1.38% | 0.60% |
| FSI | Flexible | | Materials | 2.07 | 53 | 1.97% | 0.49% |
| DOOO | BRP | | Consumer Staples | 69.77 | 66 | -0.40% | 0.48% |
| ACST | Acasti Pharma | | Health Care | 2.88 | 58 | 0.00% | 0.35% |
| MIST | Milestone | | Health Care | 1.65 | 61 | -3.24% | 0.30% |
| IAG | IAMGOLD | | Materials | 3.67 | 61 | -1.08% | 0.27% |
| MEOH | Methanex | | Materials | 48.04 | 66 | 0.19% | 0.27% |
| CNQ | Canadian Natural | | Energy | 76.75 | 61 | -0.42% | 0.26% |
| BBD | Banco Bradesco | | Financials | 2.65 | 25 | -0.56% | 0.19% |
| TU | TELUS | | Technology | 15.94 | 60 | -1.67% | 0.13% |
| LICY | Li-Cycle | | Industrials | 0.67 | 53 | -6.24% | 0.06% |
| MOGO | Mogo | | Financials | 1.84 | 63 | -1.60% | 0.00% |
| DNN | Denison Mines | | Materials | 1.99 | 25 | 0.00% | 0.00% |
| SIM | Grupo Simec | | Materials | 31.00 | 30 | -2.52% | 0.00% |
| BSBR | Banco Santander | | Financials | 5.25 | 42 | -0.76% | 0.00% |
| NVEI | Nuvei | | Technology | 32.06 | 58 | -0.02% | -0.02% |
| CM | Canadian Imperial | | Financials | 47.56 | 61 | -0.96% | -0.02% |
| TRP | TC Energy | | Energy | 35.69 | 25 | -0.94% | -0.03% |
| TCX | Tucows | | Technology | 17.50 | 47 | -0.57% | -0.06% |
| CX | CEMEX S.A.B. | | Industrials | 7.99 | 25 | -3.45% | -0.06% |
| To view more stocks, click on Next / Previous arrows or select different range: 0 - 25 , 25 - 50 , 50 - 75 , 75 - 100 , 100 - 125 , 125 - 150 , 150 - 175 , 175 - 200 | ||
 | Click To Change The Sort Order: By Market Cap or Company Size Performance: Year-to-date, Week and Day |  |
| Detailed Overview Of Latin America Stocks |
| Latin America Technical Overview, Leaders & Laggards, Top Latin America ETF Funds & Detailed Latin America Stocks List, Charts, Trends & More |
| Latin America: Technical Analysis, Trends & YTD Performance | |
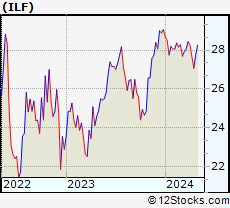
 ILF Weekly Chart |
|
| Long Term Trend: Not Good | |
| Medium Term Trend: Not Good | |
 ILF Daily Chart |
|
| Short Term Trend: Very Good | |
| Overall Trend Score: 32 | |
| YTD Performance: -6.14% | |
| **Trend Scores & Views Are Only For Educational Purposes And Not For Investing | |
| 12Stocks.com: Investing in Latin America Index using Exchange Traded Funds | |
|
The following table shows list of key exchange traded funds (ETF) that
help investors play Latin America stock market. For detailed view, check out our ETF Funds section of our website. Quick View: Move mouse or cursor over ETF symbol (ticker) to view short-term technical chart and over ETF name to view long term chart. Click on ticker or stock name for detailed view. Click on to add stock symbol to your watchlist and to view watchlist. |
12Stocks.com List of ETFs that track Latin America Index
| Ticker | ETF Name | Watchlist | Recent Price | Market Intelligence Score | Change % | Week % | Year-to-date % |
| ILF | Latin America 40 | | 27.27 | 32 | -0.78 | 0.76 | -6.14% |
| EWC | Canada | | 37.33 | 75 | -0.99 | 0.58 | 1.76% |
| EWZ | Brazil | | 30.91 | 49 | -0.80 | 0.55 | -11.58% |
| EWW | Mexico | | 65.86 | 25 | -0.96 | 1.49 | -2.94% |
| 12Stocks.com: Charts, Trends, Fundamental Data and Performances of Latin America Stocks | |
|
We now take in-depth look at all Latin America stocks including charts, multi-period performances and overall trends (as measured by market intelligence score). One can sort Latin America stocks (click link to choose) by Daily, Weekly and by Year-to-Date performances. Also, one can sort by size of the company or by market capitalization. |
| Select Your Default Chart Type: | |||||
| |||||
| Click on stock symbol or name for detailed view. Click on to add stock symbol to your watchlist and to view watchlist. Quick View: Move mouse or cursor over "Daily" to quickly view daily technical stock chart and over "Weekly" to view weekly technical stock chart. | |||||

 | CSAN Cosan S.A. |
| Sector: Energy | |
| SubSector: Oil & Gas Refining & Marketing | |
| MarketCap: 6890 Millions | |
| Recent Price: 11.16 Market Intelligence Score: 42 | |
| Day Percent Change: -0.80% Day Change: -0.09 | |
| Week Change: 0.72% Year-to-date Change: -29.2% | |
| CSAN Links: Profile News Message Board | |
| Charts:- Daily , Weekly | |
| Add CSAN to Watchlist: View: Get Complete CSAN Trend Analysis ➞ | |
 | FUSN Fusion Pharmaceuticals Inc. |
| Sector: Health Care | |
| SubSector: Biotechnology | |
| MarketCap: 52487 Millions | |
| Recent Price: 21.37 Market Intelligence Score: 83 | |
| Day Percent Change: -0.23% Day Change: -0.05 | |
| Week Change: 0.71% Year-to-date Change: 122.6% | |
| FUSN Links: Profile News Message Board | |
| Charts:- Daily , Weekly | |
| Add FUSN to Watchlist: View: Get Complete FUSN Trend Analysis ➞ | |
 | RBA Ritchie Bros. Auctioneers Incorporated |
| Sector: Services & Goods | |
| SubSector: Business Services | |
| MarketCap: 3491.02 Millions | |
| Recent Price: 73.08 Market Intelligence Score: 63 | |
| Day Percent Change: -0.23% Day Change: -0.16 | |
| Week Change: 0.64% Year-to-date Change: 9.3% | |
| RBA Links: Profile News Message Board | |
| Charts:- Daily , Weekly | |
| Add RBA to Watchlist: View: Get Complete RBA Trend Analysis ➞ | |
 | TD The Toronto-Dominion Bank |
| Sector: Financials | |
| SubSector: Money Center Banks | |
| MarketCap: 75152.4 Millions | |
| Recent Price: 58.46 Market Intelligence Score: 59 | |
| Day Percent Change: -0.78% Day Change: -0.46 | |
| Week Change: 0.64% Year-to-date Change: -9.5% | |
| TD Links: Profile News Message Board | |
| Charts:- Daily , Weekly | |
| Add TD to Watchlist: View: Get Complete TD Trend Analysis ➞ | |
 | DCBO Docebo Inc. |
| Sector: Technology | |
| SubSector: Software Application | |
| MarketCap: 15787 Millions | |
| Recent Price: 44.60 Market Intelligence Score: 58 | |
| Day Percent Change: -0.95% Day Change: -0.43 | |
| Week Change: 0.61% Year-to-date Change: -7.9% | |
| DCBO Links: Profile News Message Board | |
| Charts:- Daily , Weekly | |
| Add DCBO to Watchlist: View: Get Complete DCBO Trend Analysis ➞ | |
 | AUPH Aurinia Pharmaceuticals Inc. |
| Sector: Health Care | |
| SubSector: Biotechnology | |
| MarketCap: 1319.75 Millions | |
| Recent Price: 5.02 Market Intelligence Score: 50 | |
| Day Percent Change: -1.38% Day Change: -0.07 | |
| Week Change: 0.6% Year-to-date Change: -44.2% | |
| AUPH Links: Profile News Message Board | |
| Charts:- Daily , Weekly | |
| Add AUPH to Watchlist: View: Get Complete AUPH Trend Analysis ➞ | |
 | FSI Flexible Solutions International Inc. |
| Sector: Materials | |
| SubSector: Specialty Chemicals | |
| MarketCap: 14.3357 Millions | |
| Recent Price: 2.07 Market Intelligence Score: 53 | |
| Day Percent Change: 1.97% Day Change: 0.04 | |
| Week Change: 0.49% Year-to-date Change: 8.4% | |
| FSI Links: Profile News Message Board | |
| Charts:- Daily , Weekly | |
| Add FSI to Watchlist: View: Get Complete FSI Trend Analysis ➞ | |
 | DOOO BRP Inc. |
| Sector: Consumer Staples | |
| SubSector: Recreational Vehicles | |
| MarketCap: 638.559 Millions | |
| Recent Price: 69.77 Market Intelligence Score: 66 | |
| Day Percent Change: -0.40% Day Change: -0.28 | |
| Week Change: 0.48% Year-to-date Change: -2.7% | |
| DOOO Links: Profile News Message Board | |
| Charts:- Daily , Weekly | |
| Add DOOO to Watchlist: View: Get Complete DOOO Trend Analysis ➞ | |
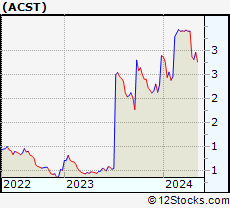 | ACST Acasti Pharma Inc. |
| Sector: Health Care | |
| SubSector: Biotechnology | |
| MarketCap: 28.2785 Millions | |
| Recent Price: 2.88 Market Intelligence Score: 58 | |
| Day Percent Change: 0.00% Day Change: 0.00 | |
| Week Change: 0.35% Year-to-date Change: -0.4% | |
| ACST Links: Profile News Message Board | |
| Charts:- Daily , Weekly | |
| Add ACST to Watchlist: View: Get Complete ACST Trend Analysis ➞ | |
 | MIST Milestone Pharmaceuticals Inc. |
| Sector: Health Care | |
| SubSector: Biotechnology | |
| MarketCap: 342.685 Millions | |
| Recent Price: 1.65 Market Intelligence Score: 61 | |
| Day Percent Change: -3.24% Day Change: -0.05 | |
| Week Change: 0.3% Year-to-date Change: -1.5% | |
| MIST Links: Profile News Message Board | |
| Charts:- Daily , Weekly | |
| Add MIST to Watchlist: View: Get Complete MIST Trend Analysis ➞ | |
 | IAG IAMGOLD Corporation |
| Sector: Materials | |
| SubSector: Gold | |
| MarketCap: 1158.09 Millions | |
| Recent Price: 3.67 Market Intelligence Score: 61 | |
| Day Percent Change: -1.08% Day Change: -0.04 | |
| Week Change: 0.27% Year-to-date Change: 45.1% | |
| IAG Links: Profile News Message Board | |
| Charts:- Daily , Weekly | |
| Add IAG to Watchlist: View: Get Complete IAG Trend Analysis ➞ | |
 | MEOH Methanex Corporation |
| Sector: Materials | |
| SubSector: Specialty Chemicals | |
| MarketCap: 894.357 Millions | |
| Recent Price: 48.04 Market Intelligence Score: 66 | |
| Day Percent Change: 0.19% Day Change: 0.09 | |
| Week Change: 0.27% Year-to-date Change: 1.4% | |
| MEOH Links: Profile News Message Board | |
| Charts:- Daily , Weekly | |
| Add MEOH to Watchlist: View: Get Complete MEOH Trend Analysis ➞ | |
 | CNQ Canadian Natural Resources Limited |
| Sector: Energy | |
| SubSector: Independent Oil & Gas | |
| MarketCap: 11925.2 Millions | |
| Recent Price: 76.75 Market Intelligence Score: 61 | |
| Day Percent Change: -0.42% Day Change: -0.32 | |
| Week Change: 0.26% Year-to-date Change: 17.1% | |
| CNQ Links: Profile News Message Board | |
| Charts:- Daily , Weekly | |
| Add CNQ to Watchlist: View: Get Complete CNQ Trend Analysis ➞ | |
 | BBD Banco Bradesco S.A. |
| Sector: Financials | |
| SubSector: Foreign Regional Banks | |
| MarketCap: 30281.7 Millions | |
| Recent Price: 2.65 Market Intelligence Score: 25 | |
| Day Percent Change: -0.56% Day Change: -0.02 | |
| Week Change: 0.19% Year-to-date Change: -24.4% | |
| BBD Links: Profile News Message Board | |
| Charts:- Daily , Weekly | |
| Add BBD to Watchlist: View: Get Complete BBD Trend Analysis ➞ | |
 | TU TELUS Corporation |
| Sector: Technology | |
| SubSector: Wireless Communications | |
| MarketCap: 10864.7 Millions | |
| Recent Price: 15.94 Market Intelligence Score: 60 | |
| Day Percent Change: -1.67% Day Change: -0.27 | |
| Week Change: 0.13% Year-to-date Change: -10.4% | |
| TU Links: Profile News Message Board | |
| Charts:- Daily , Weekly | |
| Add TU to Watchlist: View: Get Complete TU Trend Analysis ➞ | |
 | LICY Li-Cycle Holdings Corp. |
| Sector: Industrials | |
| SubSector: Waste Management | |
| MarketCap: 959 Millions | |
| Recent Price: 0.67 Market Intelligence Score: 53 | |
| Day Percent Change: -6.24% Day Change: -0.04 | |
| Week Change: 0.06% Year-to-date Change: 7.3% | |
| LICY Links: Profile News Message Board | |
| Charts:- Daily , Weekly | |
| Add LICY to Watchlist: View: Get Complete LICY Trend Analysis ➞ | |
 | MOGO Mogo Inc. |
| Sector: Financials | |
| SubSector: Credit Services | |
| MarketCap: 21.9208 Millions | |
| Recent Price: 1.84 Market Intelligence Score: 63 | |
| Day Percent Change: -1.60% Day Change: -0.03 | |
| Week Change: 0% Year-to-date Change: -0.5% | |
| MOGO Links: Profile News Message Board | |
| Charts:- Daily , Weekly | |
| Add MOGO to Watchlist: View: Get Complete MOGO Trend Analysis ➞ | |
 | DNN Denison Mines Corp. |
| Sector: Materials | |
| SubSector: Industrial Metals & Minerals | |
| MarketCap: 154.11 Millions | |
| Recent Price: 1.99 Market Intelligence Score: 25 | |
| Day Percent Change: 0.00% Day Change: 0.00 | |
| Week Change: 0% Year-to-date Change: 12.4% | |
| DNN Links: Profile News Message Board | |
| Charts:- Daily , Weekly | |
| Add DNN to Watchlist: View: Get Complete DNN Trend Analysis ➞ | |
 | SIM Grupo Simec, S.A.B. de C.V. |
| Sector: Materials | |
| SubSector: Steel & Iron | |
| MarketCap: 1418.28 Millions | |
| Recent Price: 31.00 Market Intelligence Score: 30 | |
| Day Percent Change: -2.52% Day Change: -0.80 | |
| Week Change: 0% Year-to-date Change: -0.6% | |
| SIM Links: Profile News Message Board | |
| Charts:- Daily , Weekly | |
| Add SIM to Watchlist: View: Get Complete SIM Trend Analysis ➞ | |
 | BSBR Banco Santander (Brasil) S.A. |
| Sector: Financials | |
| SubSector: Foreign Regional Banks | |
| MarketCap: 21961.4 Millions | |
| Recent Price: 5.25 Market Intelligence Score: 42 | |
| Day Percent Change: -0.76% Day Change: -0.04 | |
| Week Change: 0% Year-to-date Change: -19.9% | |
| BSBR Links: Profile News Message Board | |
| Charts:- Daily , Weekly | |
| Add BSBR to Watchlist: View: Get Complete BSBR Trend Analysis ➞ | |
 | NVEI Nuvei Corporation |
| Sector: Technology | |
| SubSector: Software - Infrastructure | |
| MarketCap: 5490 Millions | |
| Recent Price: 32.06 Market Intelligence Score: 58 | |
| Day Percent Change: -0.02% Day Change: -0.01 | |
| Week Change: -0.02% Year-to-date Change: 22.1% | |
| NVEI Links: Profile News Message Board | |
| Charts:- Daily , Weekly | |
| Add NVEI to Watchlist: View: Get Complete NVEI Trend Analysis ➞ | |
 | CM Canadian Imperial Bank of Commerce |
| Sector: Financials | |
| SubSector: Money Center Banks | |
| MarketCap: 27150.5 Millions | |
| Recent Price: 47.56 Market Intelligence Score: 61 | |
| Day Percent Change: -0.96% Day Change: -0.46 | |
| Week Change: -0.02% Year-to-date Change: -1.2% | |
| CM Links: Profile News Message Board | |
| Charts:- Daily , Weekly | |
| Add CM to Watchlist: View: Get Complete CM Trend Analysis ➞ | |
 | TRP TC Energy Corporation |
| Sector: Energy | |
| SubSector: Oil & Gas Pipelines | |
| MarketCap: 44071.1 Millions | |
| Recent Price: 35.69 Market Intelligence Score: 25 | |
| Day Percent Change: -0.94% Day Change: -0.34 | |
| Week Change: -0.03% Year-to-date Change: -8.7% | |
| TRP Links: Profile News Message Board | |
| Charts:- Daily , Weekly | |
| Add TRP to Watchlist: View: Get Complete TRP Trend Analysis ➞ | |
 | TCX Tucows Inc. |
| Sector: Technology | |
| SubSector: Internet Information Providers | |
| MarketCap: 557.78 Millions | |
| Recent Price: 17.50 Market Intelligence Score: 47 | |
| Day Percent Change: -0.57% Day Change: -0.10 | |
| Week Change: -0.06% Year-to-date Change: -35.2% | |
| TCX Links: Profile News Message Board | |
| Charts:- Daily , Weekly | |
| Add TCX to Watchlist: View: Get Complete TCX Trend Analysis ➞ | |
 | CX CEMEX, S.A.B. de C.V. |
| Sector: Industrials | |
| SubSector: Cement | |
| MarketCap: 2948.23 Millions | |
| Recent Price: 7.99 Market Intelligence Score: 25 | |
| Day Percent Change: -3.45% Day Change: -0.28 | |
| Week Change: -0.06% Year-to-date Change: 3.0% | |
| CX Links: Profile News Message Board | |
| Charts:- Daily , Weekly | |
| Add CX to Watchlist: View: Get Complete CX Trend Analysis ➞ | |
| To view more stocks, click on Next / Previous arrows or select different range: 0 - 25 , 25 - 50 , 50 - 75 , 75 - 100 , 100 - 125 , 125 - 150 , 150 - 175 , 175 - 200 | ||
| Click To Change The Sort Order: By Market Cap or Company Size Performance: Year-to-date, Week and Day | |
| Select Chart Type: | ||
 Best Stocks Today 12Stocks.com |
© 2024 12Stocks.com Terms & Conditions Privacy Contact Us
All Information Provided Only For Education And Not To Be Used For Investing or Trading. See Terms & Conditions


One More Thing ... Get Best Stocks Delivered Daily!
Never Ever Miss A Move With Our Top Ten Stocks Lists
Find Best Stocks In Any Market - Bull or Bear Market
Take A Peek At Our Top Ten Stocks Lists: Daily, Weekly, Year-to-Date & Top Trends
Find Best Stocks In Any Market - Bull or Bear Market
Take A Peek At Our Top Ten Stocks Lists: Daily, Weekly, Year-to-Date & Top Trends
Latin America Stocks With Best Up Trends [0-bearish to 100-bullish]: Controladora Vuela[100], Mercer [100], Descartes Systems[100], Grupo Aeroportuario[100], IMAX [95], BRF S.A[95], SunOpta [93], Algonquin Power[93], Grupo Aeroportuario[93], Algonquin Power[93], Grupo Supervielle[88]
Best Latin America Stocks Year-to-Date:
Fusion [122.6%], D-Wave Quantum[84.64%], Banco Macro[78.54%], Grupo Financiero[73.36%], McEwen Mining[53.12%], Celestica [49.42%], OrganiGram [48.47%], IAMGOLD [45.06%], Grupo Supervielle[44.95%], Hudbay Minerals[40.76%], Gold Royalty[39.1%] Best Latin America Stocks This Week:
Grupo Aeroportuario[12.24%], Repare [11.09%], SunOpta [10.91%], Controladora Vuela[10.51%], Grupo Aeroportuario[9.73%], Central Puerto[8.6%], Vitru [7.79%], Telecom Argentina[7.66%], Grupo Aeroportuario[7.54%], Celestica [7.41%], Grupo Supervielle[7%] Best Latin America Stocks Daily:
D-Wave Quantum[4.52%], Seabridge Gold[3.69%], AbCellera Biologics[3.64%], SilverCrest Metals[2.74%], Ambipar Emergency[2.61%], TELUS [2.36%], Vi Partners[1.75%], Controladora Vuela[1.65%], North American[1.33%], IMAX [1.15%], CI&T [1.02%]