
 Login Sign Up


| |||||
 |  | ||||

| 12Stocks.com Market Intelligence |
Best Latin America Stocks
|
|
| Quick Read: Top Latin America Stocks By Performances & Trends: Daily, Weekly, Year-to-Date, Market Cap (Size) & Technical Trends | |||
| Best Latin America Views: Quick Browse View, Summary & Slide Show | |||
| 12Stocks.com Latin America Stocks Performances & Trends Daily | |||||||||
|
|  The overall market intelligence score is 25 (0-bearish to 100-bullish) which puts Latin America index in short term bearish to neutral trend. The market intelligence score from previous trading session is 42 and hence a deterioration of trend.
| ||||||||
| Here are the market intelligence trend scores of the most requested Latin America stocks at 12Stocks.com (click stock name for detailed review): | |
| Scroll down this page for most comprehensive review of Latin America stocks by performance, trends, technical analysis, charts, fund plays & more | |


| 12Stocks.com: Top Performing Latin America Index Stocks | ||||||||||||||||||||||||||||||||||||||||||||||||
 The top performing Latin America Index stocks year to date are
Now, more recently, over last week, the top performing Latin America Index stocks on the move are


|
||||||||||||||||||||||||||||||||||||||||||||||||
| 12Stocks.com: Investing in Latin America Index with Stocks | |
|
The following table helps investors and traders sort through current performance and trends (as measured by market intelligence score) of various
stocks in the Latin America Index. Quick View: Move mouse or cursor over stock symbol (ticker) to view short-term technical chart and over stock name to view long term chart. Click on  to add stock symbol to your watchlist and to add stock symbol to your watchlist and  to view watchlist. Click on any ticker or stock name for detailed market intelligence report for that stock. to view watchlist. Click on any ticker or stock name for detailed market intelligence report for that stock. |
12Stocks.com Performance of Stocks in Latin America Index
| Ticker | Stock Name | Watchlist | Category | Recent Price | Market Intelligence Score | Change % | Weekly Change% |
| CGC | Canopy Growth |   | Health Care | 8.97 | 58 | -0.66% | 12.97% |
| PAC | Grupo Aeroportuario | | Transports | 176.15 | 100 | -1.29% | 12.81% |
| STKL | SunOpta | | Consumer Staples | 6.68 | 100 | 1.98% | 12.08% |
| ACB | Aurora Cannabis | | Health Care | 7.20 | 73 | -2.96% | 11.46% |
| VLRS | Controladora Vuela | | Transports | 8.68 | 100 | 2.36% | 11.28% |
| ASR | Grupo Aeroportuario | | Transports | 340.19 | 100 | 0.53% | 10.38% |
| FSI | Flexible | | Materials | 2.26 | 60 | 11.33% | 9.71% |
| RPTX | Repare | | Health Care | 3.30 | 42 | -1.79% | 9.27% |
| CEPU | Central Puerto | | Utilities | 9.90 | 71 | -3.60% | 8.43% |
| CLS | Celestica | | Technology | 44.10 | 63 | 0.78% | 8.27% |
| DESP | Despegar.com | | Services & Goods | 12.59 | 90 | 3.03% | 8.07% |
| OMAB | Grupo Aeroportuario | | Transports | 81.06 | 85 | -0.70% | 7.94% |
| MERC | Mercer | | Consumer Staples | 10.23 | 93 | 2.61% | 7.23% |
| ABCL | AbCellera Biologics | | Health Care | 4.13 | 47 | 3.64% | 6.72% |
| PROF | Profound Medical | | Materials | 7.99 | 18 | 3.77% | 6.39% |
| SNDL | Sundial Growers | | Health Care | 2.00 | 63 | -3.38% | 6.38% |
| TLRY | Tilray | | Health Care | 1.84 | 30 | 0.00% | 6.36% |
| TEO | Telecom Argentina | | Technology | 7.62 | 42 | -2.31% | 6.13% |
| VTRU | Vitru | | Consumer Staples | 13.04 | 35 | -2.25% | 5.76% |
| ANY | Sphere 3D | | Technology | 1.15 | 49 | -4.17% | 5.50% |
| THTX | Thera | | Health Care | 1.36 | 35 | -0.73% | 5.43% |
| TIXT | TELUS | | Technology | 8.23 | 42 | 2.36% | 5.38% |
| CRON | Cronos | | Health Care | 2.48 | 53 | 0.40% | 4.64% |
| DSGX | Descartes Systems | | Technology | 94.50 | 100 | 0.43% | 4.63% |
| TV | Grupo Televisa | | Services & Goods | 2.94 | 42 | -2.00% | 4.63% |
| To view more stocks, click on Next / Previous arrows or select different range: 0 - 25 , 25 - 50 , 50 - 75 , 75 - 100 , 100 - 125 , 125 - 150 , 150 - 175 , 175 - 200 , 200 - 225 | ||
 | Click To Change The Sort Order: By Market Cap or Company Size Performance: Year-to-date, Week and Day |  |
| Detailed Overview Of Latin America Stocks |
| Latin America Technical Overview, Leaders & Laggards, Top Latin America ETF Funds & Detailed Latin America Stocks List, Charts, Trends & More |
| Latin America: Technical Analysis, Trends & YTD Performance | |
 ILF Weekly Chart |
|
| Long Term Trend: Not Good | |
| Medium Term Trend: Not Good | |
 ILF Daily Chart |
|
| Short Term Trend: Very Good | |
| Overall Trend Score: 25 | |
| YTD Performance: -6.02% | |
| **Trend Scores & Views Are Only For Educational Purposes And Not For Investing | |
| 12Stocks.com: Investing in Latin America Index using Exchange Traded Funds | |
|
The following table shows list of key exchange traded funds (ETF) that
help investors play Latin America stock market. For detailed view, check out our ETF Funds section of our website. Quick View: Move mouse or cursor over ETF symbol (ticker) to view short-term technical chart and over ETF name to view long term chart. Click on ticker or stock name for detailed view. Click on to add stock symbol to your watchlist and to view watchlist. |
12Stocks.com List of ETFs that track Latin America Index
| Ticker | ETF Name | Watchlist | Recent Price | Market Intelligence Score | Change % | Week % | Year-to-date % |
| ILF | Latin America 40 | | 27.31 | 25 | -0.65 | 0.89 | -6.02% |
| EWC | Canada | | 37.36 | 61 | -0.90 | 0.67 | 1.85% |
| FLN | Latin America AlphaDEX | | 19.47 | 31 | -0.99 | 1.3 | -6.35% |
| EWZ | Brazil | | 30.99 | 49 | -0.55 | 0.81 | -11.36% |
| EWW | Mexico | | 65.77 | 25 | -1.08 | 1.36 | -3.07% |
| ARGT | Argentina | | 54.52 | 71 | -2.36 | 1.96 | 6.19% |
| EWZS | Brazil Small-Cap | | 13.17 | 17 | -0.75 | 1.31 | -12.55% |
| BRF | Brazil Small-Cap | | 15.02 | 10 | -0.46 | 1.08 | -14.6% |
| BZQ | Short Brazil | | 12.53 | 74 | 1.13 | -1.63 | 24.88% |
| BRZU | Brazil Bull 3X | | 78.17 | 42 | -1.03 | 1.78 | -24.02% |
| FBZ | Brazil AlphaDEX | | 11.25 | 17 | -0.88 | 0.09 | -7.95% |
| 12Stocks.com: Charts, Trends, Fundamental Data and Performances of Latin America Stocks | |
|
We now take in-depth look at all Latin America stocks including charts, multi-period performances and overall trends (as measured by market intelligence score). One can sort Latin America stocks (click link to choose) by Daily, Weekly and by Year-to-Date performances. Also, one can sort by size of the company or by market capitalization. |
| Select Your Default Chart Type: | |||||
| |||||
| Click on stock symbol or name for detailed view. Click on to add stock symbol to your watchlist and to view watchlist. Quick View: Move mouse or cursor over "Daily" to quickly view daily technical stock chart and over "Weekly" to view weekly technical stock chart. | |||||

 | CGC Canopy Growth Corporation |
| Sector: Health Care | |
| SubSector: Drug Manufacturers - Other | |
| MarketCap: 4136.33 Millions | |
| Recent Price: 8.97 Market Intelligence Score: 58 | |
| Day Percent Change: -0.66% Day Change: -0.06 | |
| Week Change: 12.97% Year-to-date Change: 75.5% | |
| CGC Links: Profile News Message Board | |
| Charts:- Daily , Weekly | |
| Add CGC to Watchlist: View: Get Complete CGC Trend Analysis ➞ | |
 | PAC Grupo Aeroportuario del Pacifico, S.A.B. de C.V. |
| Sector: Transports | |
| SubSector: Air Services, Other | |
| MarketCap: 3204.18 Millions | |
| Recent Price: 176.15 Market Intelligence Score: 100 | |
| Day Percent Change: -1.29% Day Change: -2.31 | |
| Week Change: 12.81% Year-to-date Change: 0.5% | |
| PAC Links: Profile News Message Board | |
| Charts:- Daily , Weekly | |
| Add PAC to Watchlist: View: Get Complete PAC Trend Analysis ➞ | |
 | STKL SunOpta Inc. |
| Sector: Consumer Staples | |
| SubSector: Processed & Packaged Goods | |
| MarketCap: 174.548 Millions | |
| Recent Price: 6.68 Market Intelligence Score: 100 | |
| Day Percent Change: 1.98% Day Change: 0.13 | |
| Week Change: 12.08% Year-to-date Change: 22.1% | |
| STKL Links: Profile News Message Board | |
| Charts:- Daily , Weekly | |
| Add STKL to Watchlist: View: Get Complete STKL Trend Analysis ➞ | |
 | ACB Aurora Cannabis Inc. |
| Sector: Health Care | |
| SubSector: Drug Manufacturers - Other | |
| MarketCap: 853.333 Millions | |
| Recent Price: 7.20 Market Intelligence Score: 73 | |
| Day Percent Change: -2.96% Day Change: -0.22 | |
| Week Change: 11.46% Year-to-date Change: 1,412.0% | |
| ACB Links: Profile News Message Board | |
| Charts:- Daily , Weekly | |
| Add ACB to Watchlist: View: Get Complete ACB Trend Analysis ➞ | |
 | VLRS Controladora Vuela Compania de Aviacion, S.A.B. de C.V. |
| Sector: Transports | |
| SubSector: Major Airlines | |
| MarketCap: 382 Millions | |
| Recent Price: 8.68 Market Intelligence Score: 100 | |
| Day Percent Change: 2.36% Day Change: 0.20 | |
| Week Change: 11.28% Year-to-date Change: -7.5% | |
| VLRS Links: Profile News Message Board | |
| Charts:- Daily , Weekly | |
| Add VLRS to Watchlist: View: Get Complete VLRS Trend Analysis ➞ | |
 | ASR Grupo Aeroportuario del Sureste, S. A. B. de C. V. |
| Sector: Transports | |
| SubSector: Air Services, Other | |
| MarketCap: 2739.98 Millions | |
| Recent Price: 340.19 Market Intelligence Score: 100 | |
| Day Percent Change: 0.53% Day Change: 1.81 | |
| Week Change: 10.38% Year-to-date Change: 15.6% | |
| ASR Links: Profile News Message Board | |
| Charts:- Daily , Weekly | |
| Add ASR to Watchlist: View: Get Complete ASR Trend Analysis ➞ | |
 | FSI Flexible Solutions International Inc. |
| Sector: Materials | |
| SubSector: Specialty Chemicals | |
| MarketCap: 14.3357 Millions | |
| Recent Price: 2.26 Market Intelligence Score: 60 | |
| Day Percent Change: 11.33% Day Change: 0.23 | |
| Week Change: 9.71% Year-to-date Change: 18.3% | |
| FSI Links: Profile News Message Board | |
| Charts:- Daily , Weekly | |
| Add FSI to Watchlist: View: Get Complete FSI Trend Analysis ➞ | |
 | RPTX Repare Therapeutics Inc. |
| Sector: Health Care | |
| SubSector: Biotechnology | |
| MarketCap: 13687 Millions | |
| Recent Price: 3.30 Market Intelligence Score: 42 | |
| Day Percent Change: -1.79% Day Change: -0.06 | |
| Week Change: 9.27% Year-to-date Change: -54.8% | |
| RPTX Links: Profile News Message Board | |
| Charts:- Daily , Weekly | |
| Add RPTX to Watchlist: View: Get Complete RPTX Trend Analysis ➞ | |
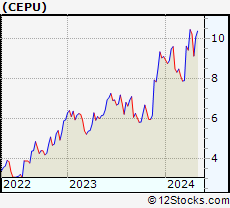 | CEPU Central Puerto S.A. |
| Sector: Utilities | |
| SubSector: Electric Utilities | |
| MarketCap: 340.114 Millions | |
| Recent Price: 9.90 Market Intelligence Score: 71 | |
| Day Percent Change: -3.60% Day Change: -0.37 | |
| Week Change: 8.43% Year-to-date Change: 8.8% | |
| CEPU Links: Profile News Message Board | |
| Charts:- Daily , Weekly | |
| Add CEPU to Watchlist: View: Get Complete CEPU Trend Analysis ➞ | |
 | CLS Celestica Inc. |
| Sector: Technology | |
| SubSector: Printed Circuit Boards | |
| MarketCap: 474.235 Millions | |
| Recent Price: 44.10 Market Intelligence Score: 63 | |
| Day Percent Change: 0.78% Day Change: 0.34 | |
| Week Change: 8.27% Year-to-date Change: 50.6% | |
| CLS Links: Profile News Message Board | |
| Charts:- Daily , Weekly | |
| Add CLS to Watchlist: View: Get Complete CLS Trend Analysis ➞ | |
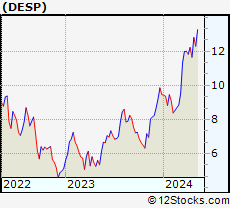 | DESP Despegar.com, Corp. |
| Sector: Services & Goods | |
| SubSector: Lodging | |
| MarketCap: 547.536 Millions | |
| Recent Price: 12.59 Market Intelligence Score: 90 | |
| Day Percent Change: 3.03% Day Change: 0.37 | |
| Week Change: 8.07% Year-to-date Change: 33.1% | |
| DESP Links: Profile News Message Board | |
| Charts:- Daily , Weekly | |
| Add DESP to Watchlist: View: Get Complete DESP Trend Analysis ➞ | |
 | OMAB Grupo Aeroportuario del Centro Norte, S.A.B. de C.V. |
| Sector: Transports | |
| SubSector: Air Services, Other | |
| MarketCap: 1196.38 Millions | |
| Recent Price: 81.06 Market Intelligence Score: 85 | |
| Day Percent Change: -0.70% Day Change: -0.57 | |
| Week Change: 7.94% Year-to-date Change: -4.2% | |
| OMAB Links: Profile News Message Board | |
| Charts:- Daily , Weekly | |
| Add OMAB to Watchlist: View: Get Complete OMAB Trend Analysis ➞ | |
 | MERC Mercer International Inc. |
| Sector: Consumer Staples | |
| SubSector: Paper & Paper Products | |
| MarketCap: 509.003 Millions | |
| Recent Price: 10.23 Market Intelligence Score: 93 | |
| Day Percent Change: 2.61% Day Change: 0.26 | |
| Week Change: 7.23% Year-to-date Change: 7.9% | |
| MERC Links: Profile News Message Board | |
| Charts:- Daily , Weekly | |
| Add MERC to Watchlist: View: Get Complete MERC Trend Analysis ➞ | |
 | ABCL AbCellera Biologics Inc. |
| Sector: Health Care | |
| SubSector: Biotechnology | |
| MarketCap: 1870 Millions | |
| Recent Price: 4.13 Market Intelligence Score: 47 | |
| Day Percent Change: 3.64% Day Change: 0.15 | |
| Week Change: 6.72% Year-to-date Change: -26.9% | |
| ABCL Links: Profile News Message Board | |
| Charts:- Daily , Weekly | |
| Add ABCL to Watchlist: View: Get Complete ABCL Trend Analysis ➞ | |
 | PROF Profound Medical Corp. |
| Sector: Materials | |
| SubSector: Industrial Metals & Minerals | |
| MarketCap: 121.41 Millions | |
| Recent Price: 7.99 Market Intelligence Score: 18 | |
| Day Percent Change: 3.77% Day Change: 0.29 | |
| Week Change: 6.39% Year-to-date Change: -5.9% | |
| PROF Links: Profile News Message Board | |
| Charts:- Daily , Weekly | |
| Add PROF to Watchlist: View: Get Complete PROF Trend Analysis ➞ | |
 | SNDL Sundial Growers Inc. |
| Sector: Health Care | |
| SubSector: Drug Manufacturers - Other | |
| MarketCap: 94.4033 Millions | |
| Recent Price: 2.00 Market Intelligence Score: 63 | |
| Day Percent Change: -3.38% Day Change: -0.07 | |
| Week Change: 6.38% Year-to-date Change: 22.0% | |
| SNDL Links: Profile News Message Board | |
| Charts:- Daily , Weekly | |
| Add SNDL to Watchlist: View: Get Complete SNDL Trend Analysis ➞ | |
 | TLRY Tilray, Inc. |
| Sector: Health Care | |
| SubSector: Drug Manufacturers - Other | |
| MarketCap: 452.533 Millions | |
| Recent Price: 1.84 Market Intelligence Score: 30 | |
| Day Percent Change: 0.00% Day Change: 0.00 | |
| Week Change: 6.36% Year-to-date Change: -20.0% | |
| TLRY Links: Profile News Message Board | |
| Charts:- Daily , Weekly | |
| Add TLRY to Watchlist: View: Get Complete TLRY Trend Analysis ➞ | |
 | TEO Telecom Argentina S.A. |
| Sector: Technology | |
| SubSector: Diversified Communication Services | |
| MarketCap: 1508.64 Millions | |
| Recent Price: 7.62 Market Intelligence Score: 42 | |
| Day Percent Change: -2.31% Day Change: -0.18 | |
| Week Change: 6.13% Year-to-date Change: 6.6% | |
| TEO Links: Profile News Message Board | |
| Charts:- Daily , Weekly | |
| Add TEO to Watchlist: View: Get Complete TEO Trend Analysis ➞ | |
 | VTRU Vitru Limited |
| Sector: Consumer Staples | |
| SubSector: Education & Training Services | |
| MarketCap: 33347 Millions | |
| Recent Price: 13.04 Market Intelligence Score: 35 | |
| Day Percent Change: -2.25% Day Change: -0.30 | |
| Week Change: 5.76% Year-to-date Change: -17.6% | |
| VTRU Links: Profile News Message Board | |
| Charts:- Daily , Weekly | |
| Add VTRU to Watchlist: View: Get Complete VTRU Trend Analysis ➞ | |
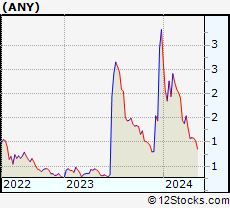 | ANY Sphere 3D Corp. |
| Sector: Technology | |
| SubSector: Application Software | |
| MarketCap: 2.57662 Millions | |
| Recent Price: 1.15 Market Intelligence Score: 49 | |
| Day Percent Change: -4.17% Day Change: -0.05 | |
| Week Change: 5.5% Year-to-date Change: -65.4% | |
| ANY Links: Profile News Message Board | |
| Charts:- Daily , Weekly | |
| Add ANY to Watchlist: View: Get Complete ANY Trend Analysis ➞ | |
 | THTX Theratechnologies Inc. |
| Sector: Health Care | |
| SubSector: Drugs - Generic | |
| MarketCap: 123.185 Millions | |
| Recent Price: 1.36 Market Intelligence Score: 35 | |
| Day Percent Change: -0.73% Day Change: -0.01 | |
| Week Change: 5.43% Year-to-date Change: -16.1% | |
| THTX Links: Profile News Message Board | |
| Charts:- Daily , Weekly | |
| Add THTX to Watchlist: View: Get Complete THTX Trend Analysis ➞ | |
 | TIXT TELUS International (Cda) Inc. |
| Sector: Technology | |
| SubSector: Software - Infrastructure | |
| MarketCap: 1470 Millions | |
| Recent Price: 8.23 Market Intelligence Score: 42 | |
| Day Percent Change: 2.36% Day Change: 0.19 | |
| Week Change: 5.38% Year-to-date Change: -3.7% | |
| TIXT Links: Profile News Message Board | |
| Charts:- Daily , Weekly | |
| Add TIXT to Watchlist: View: Get Complete TIXT Trend Analysis ➞ | |
 | CRON Cronos Group Inc. |
| Sector: Health Care | |
| SubSector: Biotechnology | |
| MarketCap: 1935.95 Millions | |
| Recent Price: 2.48 Market Intelligence Score: 53 | |
| Day Percent Change: 0.40% Day Change: 0.01 | |
| Week Change: 4.64% Year-to-date Change: 18.7% | |
| CRON Links: Profile News Message Board | |
| Charts:- Daily , Weekly | |
| Add CRON to Watchlist: View: Get Complete CRON Trend Analysis ➞ | |
 | DSGX The Descartes Systems Group Inc |
| Sector: Technology | |
| SubSector: Business Software & Services | |
| MarketCap: 2830.58 Millions | |
| Recent Price: 94.50 Market Intelligence Score: 100 | |
| Day Percent Change: 0.43% Day Change: 0.40 | |
| Week Change: 4.63% Year-to-date Change: 12.4% | |
| DSGX Links: Profile News Message Board | |
| Charts:- Daily , Weekly | |
| Add DSGX to Watchlist: View: Get Complete DSGX Trend Analysis ➞ | |
 | TV Grupo Televisa, S.A.B. |
| Sector: Services & Goods | |
| SubSector: Broadcasting - TV | |
| MarketCap: 3740.43 Millions | |
| Recent Price: 2.94 Market Intelligence Score: 42 | |
| Day Percent Change: -2.00% Day Change: -0.06 | |
| Week Change: 4.63% Year-to-date Change: -12.0% | |
| TV Links: Profile News Message Board | |
| Charts:- Daily , Weekly | |
| Add TV to Watchlist: View: Get Complete TV Trend Analysis ➞ | |
| To view more stocks, click on Next / Previous arrows or select different range: 0 - 25 , 25 - 50 , 50 - 75 , 75 - 100 , 100 - 125 , 125 - 150 , 150 - 175 , 175 - 200 , 200 - 225 | ||
| Click To Change The Sort Order: By Market Cap or Company Size Performance: Year-to-date, Week and Day | |
| Select Chart Type: | ||
 Best Stocks Today 12Stocks.com |
© 2024 12Stocks.com Terms & Conditions Privacy Contact Us
All Information Provided Only For Education And Not To Be Used For Investing or Trading. See Terms & Conditions


One More Thing ... Get Best Stocks Delivered Daily!
Never Ever Miss A Move With Our Top Ten Stocks Lists
Find Best Stocks In Any Market - Bull or Bear Market
Take A Peek At Our Top Ten Stocks Lists: Daily, Weekly, Year-to-Date & Top Trends
Find Best Stocks In Any Market - Bull or Bear Market
Take A Peek At Our Top Ten Stocks Lists: Daily, Weekly, Year-to-Date & Top Trends
Latin America Stocks With Best Up Trends [0-bearish to 100-bullish]: SilverCrest Metals[100], Controladora Vuela[100], SunOpta [100], IMAX [100], Grupo Aeroportuario[100], Descartes Systems[100], Grupo Aeroportuario[100], Mercer [93], Algonquin Power[93], Algonquin Power[93], Despegar.com [90]
Best Latin America Stocks Year-to-Date:
Aurora Cannabis[1411.97%], Fusion [122.92%], Canopy Growth[75.54%], D-Wave Quantum[72.1%], Banco Macro[70.66%], Grupo Financiero[68.38%], Banco BBVA[62.68%], McEwen Mining[51.46%], Celestica [50.61%], OrganiGram [47.33%], IAMGOLD [42.29%] Best Latin America Stocks This Week:
Canopy Growth[12.97%], Grupo Aeroportuario[12.81%], SunOpta [12.08%], Aurora Cannabis[11.46%], Controladora Vuela[11.28%], Grupo Aeroportuario[10.38%], Repare [9.27%], Central Puerto[8.43%], Celestica [8.27%], Despegar.com [8.07%], Grupo Aeroportuario[7.94%] Best Latin America Stocks Daily:
SilverCrest Metals[3.95%], AbCellera Biologics[3.64%], Seabridge Gold[3.62%], Despegar.com [3.03%], Mercer [2.61%], Controladora Vuela[2.36%], TELUS [2.36%], SunOpta [1.98%], SSR Mining[1.96%], Tucows [1.82%], Lion Electric[1.79%]