
 Login Sign Up


| |||||
 |  | ||||

| 12Stocks.com Market Intelligence |
Best Healthcare Stocks
 | "Discover best trending healthcare stocks with 12Stocks.com." |
| - Subu Vdaygiri, Founder, 12Stocks.com |
| In a hurry? Healthcare Stocks Lists: Performance Trends Table, Stock Charts
Sort Healthcare stocks: Daily, Weekly, Year-to-Date, Market Cap & Trends. Filter Healthcare stocks list by size:All Healthcare Large Mid-Range Small |
| 12Stocks.com Healthcare Stocks Performances & Trends Daily | |||||||||
|
|  The overall Smart Investing & Trading Score is 38 (0-bearish to 100-bullish) which puts Healthcare sector in short term bearish to neutral trend. The Smart Investing & Trading Score from previous trading session is 52 and hence a deterioration of trend.
| ||||||||
Here are the Smart Investing & Trading Scores of the most requested Healthcare stocks at 12Stocks.com (click stock name for detailed review):
|


| 12Stocks.com: Investing in Healthcare sector with Stocks | |
|
The following table helps investors and traders sort through current performance and trends (as measured by Smart Investing & Trading Score) of various
stocks in the Healthcare sector. Quick View: Move mouse or cursor over stock symbol (ticker) to view short-term Technical chart and over stock name to view long term chart. Click on  to add stock symbol to your watchlist and to add stock symbol to your watchlist and  to view watchlist. Click on any ticker or stock name for detailed market intelligence report for that stock. to view watchlist. Click on any ticker or stock name for detailed market intelligence report for that stock. |
12Stocks.com Performance of Stocks in Healthcare Sector
| Ticker | Stock Name | Watchlist | Category | Recent Price | Smart Investing & Trading Score | Change % | YTD Change% |
| ANGO | AngioDynamics |   | Instruments | 5.76 | 23 | -1.87% | -26.53% |
| BCRX | BioCryst | | Biotechnology | 4.09 | 10 | -2.73% | -31.64% |
| RAPT | RAPT | | Biotechnology | 7.57 | 10 | -4.18% | -69.54% |
| REPL | Replimune | | Biotechnology | 5.97 | 10 | -5.69% | -29.18% |
| DSGN | Design | | Biotechnology | 3.61 | 43 | -1.37% | 35.78% |
| SNDX | Syndax | | Biotechnology | 20.45 | 54 | -1.64% | -5.37% |
| PRTA | Prothena | | Biotechnology | 20.14 | 10 | -2.04% | -44.58% |
| ACIU | AC Immune | | Biotechnology | 2.33 | 28 | -1.90% | -53.50% |
| CRBP | Corbus | | Biotechnology | 32.88 | 36 | -7.47% | 444.45% |
| AVDL | Avadel | | Biotechnology | 17.23 | 93 | -2.43% | 22.03% |
| CUE | Cue Biopharma | | Biotechnology | 1.35 | 0 | -4.93% | -48.86% |
| AXGN | AxoGen | | Equipment | 6.60 | 35 | -3.93% | -3.37% |
| GLUE | Monte Rosa | | Biotechnology | 5.33 | 41 | -2.38% | -5.33% |
| MIST | Milestone | | Biotechnology | 1.66 | 54 | 0.00% | -0.60% |
| KRMD | Repro Med | | Instruments | 2.21 | 80 | 0.68% | -9.78% |
| AKYA | Akoya Biosciences | | Instruments | 3.85 | 23 | 0.79% | -21.37% |
| VIGL | Vigil Neuroscience | | Biotechnology | 2.77 | 46 | -1.07% | -19.24% |
| SVA | Sinovac Biotech | | Biotechnology | 6.47 | 27 | 0.00% | 0.00% |
| TMDX | TransMedics | | Equipment | 87.50 | 93 | -1.55% | 10.86% |
| SGRY | Surgery Partners | | Hospitals | 24.71 | 35 | -3.10% | -22.76% |
| CVRX | CVRx | | Medical Devices | 14.01 | 20 | -2.71% | -55.47% |
| DTIL | Precision BioSciences | | Biotechnology | 9.82 | 56 | 0.00% | NA |
| VYGR | Voyager | | Biotechnology | 7.38 | 51 | -2.51% | -12.56% |
| VAXX | Vaxxinity | | Biotechnology | 0.13 | 0 | -2.46% | -84.91% |
| MIRM | Mirum | | Biotechnology | 23.57 | 42 | -1.89% | -20.17% |
| For chart view version of above stock list: Chart View ➞ 0 - 25 , 25 - 50 , 50 - 75 , 75 - 100 , 100 - 125 , 125 - 150 , 150 - 175 , 175 - 200 , 200 - 225 , 225 - 250 , 250 - 275 , 275 - 300 , 300 - 325 , 325 - 350 , 350 - 375 , 375 - 400 , 400 - 425 , 425 - 450 , 450 - 475 , 475 - 500 , 500 - 525 , 525 - 550 , 550 - 575 , 575 - 600 , 600 - 625 , 625 - 650 | ||
 | Click To Change The Sort Order: By Market Cap or Company Size Performance: Year-to-date, Week and Day |  |
|
Get the most comprehensive stock market coverage daily at 12Stocks.com ➞ Best Stocks Today ➞ Best Stocks Weekly ➞ Best Stocks Year-to-Date ➞ Best Stocks Trends ➞  Best Stocks Today 12Stocks.com Best Nasdaq Stocks ➞ Best S&P 500 Stocks ➞ Best Tech Stocks ➞ Best Biotech Stocks ➞ |
| Detailed Overview of Healthcare Stocks |
| Healthcare Technical Overview, Leaders & Laggards, Top Healthcare ETF Funds & Detailed Healthcare Stocks List, Charts, Trends & More |
| Healthcare Sector: Technical Analysis, Trends & YTD Performance | |
| Healthcare sector is composed of stocks
from pharmaceutical, biotech, diagnostics labs, insurance providers
and healthcare services. Healthcare sector, as represented by XLV, an exchange-traded fund [ETF] that holds basket of Healthcare stocks (e.g, Merck, Amgen) is up by 2.27% and is currently underperforming the overall market by -1.98% year-to-date. Below is a quick view of Technical charts and trends: |
|
 XLV Weekly Chart |
|
| Long Term Trend: Not Good | |
| Medium Term Trend: Not Good | |
 XLV Daily Chart |
|
| Short Term Trend: Very Good | |
| Overall Trend Score: 38 | |
| YTD Performance: 2.27% | |
| **Trend Scores & Views Are Only For Educational Purposes And Not For Investing | |
| 12Stocks.com: Top Performing Healthcare Sector Stocks | ||||||||||||||||||||||||||||||||||||||||||||||||
 The top performing Healthcare sector stocks year to date are
Now, more recently, over last week, the top performing Healthcare sector stocks on the move are


|
||||||||||||||||||||||||||||||||||||||||||||||||
| 12Stocks.com: Investing in Healthcare Sector using Exchange Traded Funds | |
|
The following table shows list of key exchange traded funds (ETF) that
help investors track Healthcare Index. For detailed view, check out our ETF Funds section of our website. Quick View: Move mouse or cursor over ETF symbol (ticker) to view short-term Technical chart and over ETF name to view long term chart. Click on ticker or stock name for detailed view. Click on to add stock symbol to your watchlist and to view watchlist. |
12Stocks.com List of ETFs that track Healthcare Index
| Ticker | ETF Name | Watchlist | Recent Price | Smart Investing & Trading Score | Change % | Week % | Year-to-date % |
| XLV | Health Care | | 139.47 | 38 | -0.99 | 0.37 | 2.27% |
| IBB | Biotechnology | | 124.82 | 10 | -2.30 | 0.08 | -8.12% |
| BBH | Biotech | | 157.33 | 49 | 0.00 | 3.26 | -4.83% |
| IHF | Healthcare Providers | | 51.96 | 43 | -0.57 | -0.48 | -1.05% |
| PSCH | SmallCap Health Care | | 41.08 | 35 | -0.10 | 2.24 | -4.02% |
| XHS | Health Care Services | | 87.93 | 68 | -0.87 | 0.97 | -1.15% |
| PTH | DWA Healthcare Momentum | | 39.60 | 46 | -0.08 | 0.18 | 1.18% |
| BTEC | Principal Healthcare Innovators | | 34.21 | 32 | 0.02 | 1.04 | -5.83% |
| RXL | Health Care | | 93.89 | 38 | -2.20 | 0.72 | 2.72% |
| RXD | Short Health Care | | 11.37 | 45 | 0.19 | -2.36 | -4.7% |
| 12Stocks.com: Charts, Trends, Fundamental Data and Performances of Healthcare Stocks | |
|
We now take in-depth look at all Healthcare stocks including charts, multi-period performances and overall trends (as measured by Smart Investing & Trading Score). One can sort Healthcare stocks (click link to choose) by Daily, Weekly and by Year-to-Date performances. Also, one can sort by size of the company or by market capitalization. |
| Select Your Default Chart Type: | |||||
| |||||
| Click on stock symbol or name for detailed view. Click on to add stock symbol to your watchlist and to view watchlist. Quick View: Move mouse or cursor over "Daily" to quickly view daily Technical stock chart and over "Weekly" to view weekly Technical stock chart. | |||||

 | ANGO AngioDynamics, Inc. |
| Sector: Health Care | |
| SubSector: Medical Instruments & Supplies | |
| MarketCap: 370.86 Millions | |
| Recent Price: 5.76 Smart Investing & Trading Score: 23 | |
| Day Percent Change: -1.87% Day Change: -0.11 | |
| Week Change: -7.99% Year-to-date Change: -26.5% | |
| ANGO Links: Profile News Message Board | |
| Charts:- Daily , Weekly | |
| Add ANGO to Watchlist: View: Get Complete ANGO Trend Analysis ➞ | |
 | BCRX BioCryst Pharmaceuticals, Inc. |
| Sector: Health Care | |
| SubSector: Biotechnology | |
| MarketCap: 369.385 Millions | |
| Recent Price: 4.09 Smart Investing & Trading Score: 10 | |
| Day Percent Change: -2.73% Day Change: -0.12 | |
| Week Change: -7.56% Year-to-date Change: -31.6% | |
| BCRX Links: Profile News Message Board | |
| Charts:- Daily , Weekly | |
| Add BCRX to Watchlist: View: Get Complete BCRX Trend Analysis ➞ | |
 | RAPT RAPT Therapeutics, Inc. |
| Sector: Health Care | |
| SubSector: Biotechnology | |
| MarketCap: 368.785 Millions | |
| Recent Price: 7.57 Smart Investing & Trading Score: 10 | |
| Day Percent Change: -4.18% Day Change: -0.33 | |
| Week Change: -4.9% Year-to-date Change: -69.5% | |
| RAPT Links: Profile News Message Board | |
| Charts:- Daily , Weekly | |
| Add RAPT to Watchlist: View: Get Complete RAPT Trend Analysis ➞ | |
 | REPL Replimune Group, Inc. |
| Sector: Health Care | |
| SubSector: Biotechnology | |
| MarketCap: 367.885 Millions | |
| Recent Price: 5.97 Smart Investing & Trading Score: 10 | |
| Day Percent Change: -5.69% Day Change: -0.36 | |
| Week Change: -7.73% Year-to-date Change: -29.2% | |
| REPL Links: Profile News Message Board | |
| Charts:- Daily , Weekly | |
| Add REPL to Watchlist: View: Get Complete REPL Trend Analysis ➞ | |
 | DSGN Design Therapeutics, Inc. |
| Sector: Health Care | |
| SubSector: Biotechnology | |
| MarketCap: 367 Millions | |
| Recent Price: 3.61 Smart Investing & Trading Score: 43 | |
| Day Percent Change: -1.37% Day Change: -0.05 | |
| Week Change: -2.57% Year-to-date Change: 35.8% | |
| DSGN Links: Profile News Message Board | |
| Charts:- Daily , Weekly | |
| Add DSGN to Watchlist: View: Get Complete DSGN Trend Analysis ➞ | |
 | SNDX Syndax Pharmaceuticals, Inc. |
| Sector: Health Care | |
| SubSector: Biotechnology | |
| MarketCap: 365.985 Millions | |
| Recent Price: 20.45 Smart Investing & Trading Score: 54 | |
| Day Percent Change: -1.64% Day Change: -0.34 | |
| Week Change: -1.68% Year-to-date Change: -5.4% | |
| SNDX Links: Profile News Message Board | |
| Charts:- Daily , Weekly | |
| Add SNDX to Watchlist: View: Get Complete SNDX Trend Analysis ➞ | |
 | PRTA Prothena Corporation plc |
| Sector: Health Care | |
| SubSector: Biotechnology | |
| MarketCap: 357.985 Millions | |
| Recent Price: 20.14 Smart Investing & Trading Score: 10 | |
| Day Percent Change: -2.04% Day Change: -0.42 | |
| Week Change: -4.82% Year-to-date Change: -44.6% | |
| PRTA Links: Profile News Message Board | |
| Charts:- Daily , Weekly | |
| Add PRTA to Watchlist: View: Get Complete PRTA Trend Analysis ➞ | |
 | ACIU AC Immune SA |
| Sector: Health Care | |
| SubSector: Biotechnology | |
| MarketCap: 356.585 Millions | |
| Recent Price: 2.33 Smart Investing & Trading Score: 28 | |
| Day Percent Change: -1.90% Day Change: -0.04 | |
| Week Change: -1.48% Year-to-date Change: -53.5% | |
| ACIU Links: Profile News Message Board | |
| Charts:- Daily , Weekly | |
| Add ACIU to Watchlist: View: Get Complete ACIU Trend Analysis ➞ | |
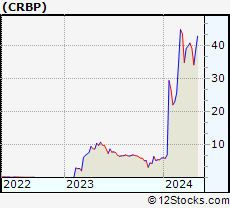 | CRBP Corbus Pharmaceuticals Holdings, Inc. |
| Sector: Health Care | |
| SubSector: Biotechnology | |
| MarketCap: 354.885 Millions | |
| Recent Price: 32.88 Smart Investing & Trading Score: 36 | |
| Day Percent Change: -7.47% Day Change: -2.66 | |
| Week Change: -16.2% Year-to-date Change: 444.5% | |
| CRBP Links: Profile News Message Board | |
| Charts:- Daily , Weekly | |
| Add CRBP to Watchlist: View: Get Complete CRBP Trend Analysis ➞ | |
 | AVDL Avadel Pharmaceuticals plc |
| Sector: Health Care | |
| SubSector: Biotechnology | |
| MarketCap: 354.485 Millions | |
| Recent Price: 17.23 Smart Investing & Trading Score: 93 | |
| Day Percent Change: -2.43% Day Change: -0.43 | |
| Week Change: -0.58% Year-to-date Change: 22.0% | |
| AVDL Links: Profile News Message Board | |
| Charts:- Daily , Weekly | |
| Add AVDL to Watchlist: View: Get Complete AVDL Trend Analysis ➞ | |
 | CUE Cue Biopharma, Inc. |
| Sector: Health Care | |
| SubSector: Biotechnology | |
| MarketCap: 352.785 Millions | |
| Recent Price: 1.35 Smart Investing & Trading Score: 0 | |
| Day Percent Change: -4.93% Day Change: -0.07 | |
| Week Change: -14.01% Year-to-date Change: -48.9% | |
| CUE Links: Profile News Message Board | |
| Charts:- Daily , Weekly | |
| Add CUE to Watchlist: View: Get Complete CUE Trend Analysis ➞ | |
 | AXGN AxoGen, Inc. |
| Sector: Health Care | |
| SubSector: Medical Appliances & Equipment | |
| MarketCap: 349.28 Millions | |
| Recent Price: 6.60 Smart Investing & Trading Score: 35 | |
| Day Percent Change: -3.93% Day Change: -0.27 | |
| Week Change: 1.54% Year-to-date Change: -3.4% | |
| AXGN Links: Profile News Message Board | |
| Charts:- Daily , Weekly | |
| Add AXGN to Watchlist: View: Get Complete AXGN Trend Analysis ➞ | |
 | GLUE Monte Rosa Therapeutics, Inc. |
| Sector: Health Care | |
| SubSector: Biotechnology | |
| MarketCap: 346 Millions | |
| Recent Price: 5.33 Smart Investing & Trading Score: 41 | |
| Day Percent Change: -2.38% Day Change: -0.13 | |
| Week Change: -8.89% Year-to-date Change: -5.3% | |
| GLUE Links: Profile News Message Board | |
| Charts:- Daily , Weekly | |
| Add GLUE to Watchlist: View: Get Complete GLUE Trend Analysis ➞ | |
 | MIST Milestone Pharmaceuticals Inc. |
| Sector: Health Care | |
| SubSector: Biotechnology | |
| MarketCap: 342.685 Millions | |
| Recent Price: 1.66 Smart Investing & Trading Score: 54 | |
| Day Percent Change: 0.00% Day Change: 0.00 | |
| Week Change: 1.22% Year-to-date Change: -0.6% | |
| MIST Links: Profile News Message Board | |
| Charts:- Daily , Weekly | |
| Add MIST to Watchlist: View: Get Complete MIST Trend Analysis ➞ | |
 | KRMD Repro Med Systems, Inc. |
| Sector: Health Care | |
| SubSector: Medical Instruments & Supplies | |
| MarketCap: 340.06 Millions | |
| Recent Price: 2.21 Smart Investing & Trading Score: 80 | |
| Day Percent Change: 0.68% Day Change: 0.01 | |
| Week Change: 7.52% Year-to-date Change: -9.8% | |
| KRMD Links: Profile News Message Board | |
| Charts:- Daily , Weekly | |
| Add KRMD to Watchlist: View: Get Complete KRMD Trend Analysis ➞ | |
 | AKYA Akoya Biosciences, Inc. |
| Sector: Health Care | |
| SubSector: Medical Instruments & Supplies | |
| MarketCap: 340 Millions | |
| Recent Price: 3.85 Smart Investing & Trading Score: 23 | |
| Day Percent Change: 0.79% Day Change: 0.03 | |
| Week Change: 1.18% Year-to-date Change: -21.4% | |
| AKYA Links: Profile News Message Board | |
| Charts:- Daily , Weekly | |
| Add AKYA to Watchlist: View: Get Complete AKYA Trend Analysis ➞ | |
 | VIGL Vigil Neuroscience, Inc. |
| Sector: Health Care | |
| SubSector: Biotechnology | |
| MarketCap: 339 Millions | |
| Recent Price: 2.77 Smart Investing & Trading Score: 46 | |
| Day Percent Change: -1.07% Day Change: -0.03 | |
| Week Change: -1.77% Year-to-date Change: -19.2% | |
| VIGL Links: Profile News Message Board | |
| Charts:- Daily , Weekly | |
| Add VIGL to Watchlist: View: Get Complete VIGL Trend Analysis ➞ | |
 | SVA Sinovac Biotech Ltd. |
| Sector: Health Care | |
| SubSector: Biotechnology | |
| MarketCap: 336.88 Millions | |
| Recent Price: 6.47 Smart Investing & Trading Score: 27 | |
| Day Percent Change: 0.00% Day Change: 0.00 | |
| Week Change: 0% Year-to-date Change: 0.0% | |
| SVA Links: Profile News Message Board | |
| Charts:- Daily , Weekly | |
| Add SVA to Watchlist: View: Get Complete SVA Trend Analysis ➞ | |
 | TMDX TransMedics Group, Inc. |
| Sector: Health Care | |
| SubSector: Medical Appliances & Equipment | |
| MarketCap: 331.68 Millions | |
| Recent Price: 87.50 Smart Investing & Trading Score: 93 | |
| Day Percent Change: -1.55% Day Change: -1.38 | |
| Week Change: 3.94% Year-to-date Change: 10.9% | |
| TMDX Links: Profile News Message Board | |
| Charts:- Daily , Weekly | |
| Add TMDX to Watchlist: View: Get Complete TMDX Trend Analysis ➞ | |
 | SGRY Surgery Partners, Inc. |
| Sector: Health Care | |
| SubSector: Hospitals | |
| MarketCap: 328.446 Millions | |
| Recent Price: 24.71 Smart Investing & Trading Score: 35 | |
| Day Percent Change: -3.10% Day Change: -0.79 | |
| Week Change: 3.69% Year-to-date Change: -22.8% | |
| SGRY Links: Profile News Message Board | |
| Charts:- Daily , Weekly | |
| Add SGRY to Watchlist: View: Get Complete SGRY Trend Analysis ➞ | |
 | CVRX CVRx, Inc. |
| Sector: Health Care | |
| SubSector: Medical Devices | |
| MarketCap: 327 Millions | |
| Recent Price: 14.01 Smart Investing & Trading Score: 20 | |
| Day Percent Change: -2.71% Day Change: -0.39 | |
| Week Change: -5.97% Year-to-date Change: -55.5% | |
| CVRX Links: Profile News Message Board | |
| Charts:- Daily , Weekly | |
| Add CVRX to Watchlist: View: Get Complete CVRX Trend Analysis ➞ | |
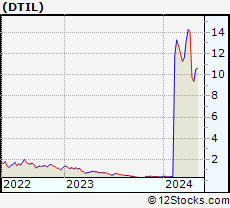 | DTIL Precision BioSciences, Inc. |
| Sector: Health Care | |
| SubSector: Biotechnology | |
| MarketCap: 326.285 Millions | |
| Recent Price: 9.82 Smart Investing & Trading Score: 56 | |
| Day Percent Change: 0.00% Day Change: 0.00 | |
| Week Change: 0.72% Year-to-date Change: 2,590.4% | |
| DTIL Links: Profile News Message Board | |
| Charts:- Daily , Weekly | |
| Add DTIL to Watchlist: View: Get Complete DTIL Trend Analysis ➞ | |
 | VYGR Voyager Therapeutics, Inc. |
| Sector: Health Care | |
| SubSector: Biotechnology | |
| MarketCap: 321.085 Millions | |
| Recent Price: 7.38 Smart Investing & Trading Score: 51 | |
| Day Percent Change: -2.51% Day Change: -0.19 | |
| Week Change: -1.6% Year-to-date Change: -12.6% | |
| VYGR Links: Profile News Message Board | |
| Charts:- Daily , Weekly | |
| Add VYGR to Watchlist: View: Get Complete VYGR Trend Analysis ➞ | |
 | VAXX Vaxxinity, Inc. |
| Sector: Health Care | |
| SubSector: Biotechnology | |
| MarketCap: 320 Millions | |
| Recent Price: 0.13 Smart Investing & Trading Score: 0 | |
| Day Percent Change: -2.46% Day Change: 0.00 | |
| Week Change: -73.37% Year-to-date Change: -84.9% | |
| VAXX Links: Profile News Message Board | |
| Charts:- Daily , Weekly | |
| Add VAXX to Watchlist: View: Get Complete VAXX Trend Analysis ➞ | |
 | MIRM Mirum Pharmaceuticals, Inc. |
| Sector: Health Care | |
| SubSector: Biotechnology | |
| MarketCap: 309.585 Millions | |
| Recent Price: 23.57 Smart Investing & Trading Score: 42 | |
| Day Percent Change: -1.89% Day Change: -0.45 | |
| Week Change: -1.11% Year-to-date Change: -20.2% | |
| MIRM Links: Profile News Message Board | |
| Charts:- Daily , Weekly | |
| Add MIRM to Watchlist: View: Get Complete MIRM Trend Analysis ➞ | |
| For tabular summary view of above stock list: Summary View ➞ 0 - 25 , 25 - 50 , 50 - 75 , 75 - 100 , 100 - 125 , 125 - 150 , 150 - 175 , 175 - 200 , 200 - 225 , 225 - 250 , 250 - 275 , 275 - 300 , 300 - 325 , 325 - 350 , 350 - 375 , 375 - 400 , 400 - 425 , 425 - 450 , 450 - 475 , 475 - 500 , 500 - 525 , 525 - 550 , 550 - 575 , 575 - 600 , 600 - 625 , 625 - 650 | ||
| Click To Change The Sort Order: By Market Cap or Company Size Performance: Year-to-date, Week and Day | |
| Select Chart Type: | ||
|
Best Stocks Today 12Stocks.com |
© 2024 12Stocks.com Terms & Conditions Privacy Contact Us
All Information Provided Only For Education And Not To Be Used For Investing or Trading. See Terms & Conditions


One More Thing ... Get Best Stocks Delivered Daily!
Never Ever Miss A Move With Our Top Ten Stocks Lists
Find Best Stocks In Any Market - Bull or Bear Market
Take A Peek At Our Top Ten Stocks Lists: Daily, Weekly, Year-to-Date & Top Trends
Find Best Stocks In Any Market - Bull or Bear Market
Take A Peek At Our Top Ten Stocks Lists: Daily, Weekly, Year-to-Date & Top Trends
Healthcare Stocks With Best Up Trends [0-bearish to 100-bullish]: AstraZeneca [100], Annovis Bio[100], Merck [100], Boston Scientific[100], Agios [100], Quest Diagnostics[100], Haemonetics [100], Agenus [95], Mesoblast [95], Centene [93], TransMedics [93]
Best Healthcare Stocks Year-to-Date:
Precision BioSciences[2590.41%], Inovio [1849.02%], Assembly Biosciences[1543.7%], Aurora Cannabis[1348.97%], NuCana [1198.17%], Agenus [856.64%], CareMax [572.16%], Corbus [444.45%], Mesoblast [440%], Janux [333.88%], GeneDx [318.75%] Best Healthcare Stocks This Week:
Agenus [49.15%], Seres [38.35%], BeyondSpring [35%], Annovis Bio[30%], CareMax [26.85%], ProKidney [25.74%], Cullinan Oncology[21.1%], OptiNose [18.42%], GeneDx [18.15%], BeiGene [15.29%], Hutchison China[14.55%] Best Healthcare Stocks Daily:
OptiNose [14.56%], ADiTx [10.57%], LENSAR [6.92%], Zura Bio[6.75%], Agenus [6.74%], Community Health[6.44%], Seres [6.18%], AstraZeneca [5.79%], Sanofi [5.43%], Galera [4.98%], Sana Biotechnology[4.00%]