
 Login Sign Up


| |||||
 |  | ||||

| 12Stocks.com Market Intelligence |
Best Financial Stocks
| In a hurry? Financial Stocks Lists: Performance Trends Table, Stock Charts
Sort Financial stocks: Daily, Weekly, Year-to-Date, Market Cap & Trends. Filter Financial stocks list by size:All Financial Large Mid-Range Small & MicroCap |
| 12Stocks.com Financial Stocks Performances & Trends Daily | |||||||||
|
|  The overall Smart Investing & Trading Score is 90 (0-bearish to 100-bullish) which puts Financial sector in short term bullish trend. The Smart Investing & Trading Score from previous trading session is 60 and hence an improvement of trend.
| ||||||||
Here are the Smart Investing & Trading Scores of the most requested Financial stocks at 12Stocks.com (click stock name for detailed review):
|


| 12Stocks.com: Investing in Financial sector with Stocks | |
|
The following table helps investors and traders sort through current performance and trends (as measured by Smart Investing & Trading Score) of various
stocks in the Financial sector. Quick View: Move mouse or cursor over stock symbol (ticker) to view short-term Technical chart and over stock name to view long term chart. Click on  to add stock symbol to your watchlist and to add stock symbol to your watchlist and  to view watchlist. Click on any ticker or stock name for detailed market intelligence report for that stock. to view watchlist. Click on any ticker or stock name for detailed market intelligence report for that stock. |
12Stocks.com Performance of Stocks in Financial Sector
| Ticker | Stock Name | Watchlist | Category | Recent Price | Trend Score | Change % | YTD Change% |
| TRCB | Two River |   | Regional Banks | 14.23 | 40 | 0.49% | 0.00% |
| MMAC | MMA Capital | | Mortgage | 19.98 | 0 | -1.96% | 0.00% |
| GRX | Gabelli Healthcare | | Closed-End Fund - Equity | 9.16 | 0 | 0.00% | -5.18% |
| ALCYU | Alchemy s | | SPAC | 10.96 | 36 | 0.00% | -100.00% |
| AIF | Apollo Tactical | | Asset Mgmt | 14.82 | 50 | -0.27% | 0.00% |
| BWG | BrandywineGLOBAL - | | Closed-End Fund - Debt | 8.91 | 100 | 0.45% | 18.49% |
| DMF | BNY | | Asset Mgmt | 6.93 | 20 | 0.00% | -3.48% |
| KCAP | KCAP | | Investments | 21.47 | 60 | -0.14% | 0.00% |
| SUNS | Sunrise Realty | | REIT - Mortgage | 11.44 | 100 | 2.05% | -15.08% |
| FCAP | First Capital | | Banks - Regional | 44.29 | 90 | -0.96% | 37.01% |
| GECC | Great Elm | | Asset Mgmt | 11.17 | 30 | 2.38% | 9.55% |
| NSL | Nuveen Senior | | Closed-End Fund - Debt | 4.60 | 30 | 0.00% | 0.00% |
| FCCY | 1st Constitution | | Regional Banks | 20.66 | 0 | 0.54% | 0.00% |
| IVH | Ivy Funds | | Asset Mgmt | 6.92 | 20 | 0.00% | 0.00% |
| TGE | Generation Essentials | | Asset Mgmt | 2.76 | 30 | 6.56% | -72.37% |
| GGT | Gabelli Multimedia | | Closed-End Fund - Equity | 4.22 | 30 | -0.47% | 5.45% |
| GPMT | Granite Point | | REIT - Mortgage | 2.99 | 70 | 1.36% | 11.53% |
| MPA | BlackRock MuniYield | | Closed-End Fund - Debt | 11.37 | 60 | 0.26% | 0.37% |
| EVBS | Eastern Virginia | | Regional Banks | 3.52 | 10 | -0.56% | 0.00% |
| HYB | New America | | Closed-End Fund - Debt | 8.20 | 10 | 0.00% | 0.12% |
| CMFN | CM Finance | | Asset Mgmt | 20.42 | 60 | 0.79% | 0.00% |
| DNBF | DNB | | Regional Banks | 20.05 | 90 | 5.80% | 0.00% |
| SBFG | SB | | Banks - Regional | 20.74 | 60 | 1.12% | 1.38% |
| EBMT | Eagle Bancorp | | Banks - Regional | 17.35 | 60 | 0.84% | 19.47% |
| FDEU | First Trust | | Asset Mgmt | 12.59 | 50 | 0.00% | 0.00% |
| For chart view version of above stock list: Chart View ➞ 0 - 25 , 25 - 50 , 50 - 75 , 75 - 100 , 100 - 125 , 125 - 150 , 150 - 175 , 175 - 200 , 200 - 225 , 225 - 250 , 250 - 275 , 275 - 300 , 300 - 325 , 325 - 350 , 350 - 375 , 375 - 400 , 400 - 425 , 425 - 450 , 450 - 475 , 475 - 500 , 500 - 525 , 525 - 550 , 550 - 575 , 575 - 600 , 600 - 625 , 625 - 650 , 650 - 675 , 675 - 700 , 700 - 725 , 725 - 750 , 750 - 775 , 775 - 800 , 800 - 825 , 825 - 850 , 850 - 875 , 875 - 900 , 900 - 925 , 925 - 950 , 950 - 975 , 975 - 1000 , 1000 - 1025 , 1025 - 1050 , 1050 - 1075 , 1075 - 1100 , 1100 - 1125 , 1125 - 1150 , 1150 - 1175 , 1175 - 1200 , 1200 - 1225 , 1225 - 1250 , 1250 - 1275 , 1275 - 1300 , 1300 - 1325 , 1325 - 1350 , 1350 - 1375 , 1375 - 1400 , 1400 - 1425 , 1425 - 1450 , 1450 - 1475 , 1475 - 1500 , 1500 - 1525 , 1525 - 1550 | ||
 | Click To Change The Sort Order: By Market Cap or Company Size Performance: Year-to-date, Week and Day |  |
|
Get the most comprehensive stock market coverage daily at 12Stocks.com ➞ Best Stocks Today ➞ Best Stocks Weekly ➞ Best Stocks Year-to-Date ➞ Best Stocks Trends ➞  Best Stocks Today 12Stocks.com Best Nasdaq Stocks ➞ Best S&P 500 Stocks ➞ Best Tech Stocks ➞ Best Biotech Stocks ➞ |
| Detailed Overview of Financial Stocks |
| Financial Technical Overview, Leaders & Laggards, Top Financial ETF Funds & Detailed Financial Stocks List, Charts, Trends & More |
| Financial Sector: Technical Analysis, Trends & YTD Performance | |
| Financial sector is composed of stocks
from banks, brokers, insurance, REITs
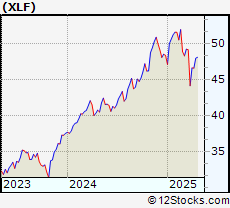
and services subsectors. Financial sector, as represented by XLF, an exchange-traded fund [ETF] that holds basket of Financial stocks (e.g, Bank of America, Goldman Sachs) is up by 12.9691% and is currently underperforming the overall market by -0.1777% year-to-date. Below is a quick view of Technical charts and trends: |
|
 XLF Weekly Chart |
|
| Long Term Trend: Good | |
| Medium Term Trend: Good | |
 XLF Daily Chart |
|
| Short Term Trend: Very Good | |
| Overall Trend Score: 90 | |
| YTD Performance: 12.9691% | |
| **Trend Scores & Views Are Only For Educational Purposes And Not For Investing | |
| 12Stocks.com: Top Performing Financial Sector Stocks | |||||||||||||||||||||||||||||||||||||||||||||||
 The top performing Financial sector stocks year to date are
Now, more recently, over last week, the top performing Financial sector stocks on the move are


|
|||||||||||||||||||||||||||||||||||||||||||||||
| 12Stocks.com: Investing in Financial Sector using Exchange Traded Funds | |
|
The following table shows list of key exchange traded funds (ETF) that
help investors track Financial Index. For detailed view, check out our ETF Funds section of our website. Quick View: Move mouse or cursor over ETF symbol (ticker) to view short-term Technical chart and over ETF name to view long term chart. Click on ticker or stock name for detailed view. Click on to add stock symbol to your watchlist and to view watchlist. |
12Stocks.com List of ETFs that track Financial Index
| Ticker | ETF Name | Watchlist | Recent Price | Smart Investing & Trading Score | Change % | Week % | Year-to-date % |
| CHIX | China Financials | | 10.57 | 20 | 0 | 0 | 0% |
| 12Stocks.com: Charts, Trends, Fundamental Data and Performances of Financial Stocks | |
|
We now take in-depth look at all Financial stocks including charts, multi-period performances and overall trends (as measured by Smart Investing & Trading Score). One can sort Financial stocks (click link to choose) by Daily, Weekly and by Year-to-Date performances. Also, one can sort by size of the company or by market capitalization. |
| Select Your Default Chart Type: | |||||
| |||||
| Click on stock symbol or name for detailed view. Click on to add stock symbol to your watchlist and to view watchlist. Quick View: Move mouse or cursor over "Daily" to quickly view daily Technical stock chart and over "Weekly" to view weekly Technical stock chart. | |||||

 | TRCB Two River Bancorp |
| Sector: Financials | |
| SubSector: Regional - Northeast Banks | |
| MarketCap: 148.09 Millions | |
| Recent Price: 14.23 Smart Investing & Trading Score: 40 | |
| Day Percent Change: 0.49435% Day Change: -9999 | |
| Week Change: -19.6045% Year-to-date Change: 0.0% | |
| TRCB Links: Profile News Message Board | |
| Charts:- Daily , Weekly | |
| Add TRCB to Watchlist: View: Get Complete TRCB Trend Analysis ➞ | |
 | MMAC MMA Capital Holdings, Inc. |
| Sector: Financials | |
| SubSector: Mortgage Investment | |
| MarketCap: 147.939 Millions | |
| Recent Price: 19.98 Smart Investing & Trading Score: 0 | |
| Day Percent Change: -1.96271% Day Change: -9999 | |
| Week Change: -28.0519% Year-to-date Change: 0.0% | |
| MMAC Links: Profile News Message Board | |
| Charts:- Daily , Weekly | |
| Add MMAC to Watchlist: View: Get Complete MMAC Trend Analysis ➞ | |
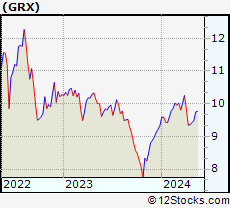 | GRX Gabelli Healthcare & WellnessRx Trust |
| Sector: Financials | |
| SubSector: Closed-End Fund - Equity | |
| MarketCap: 147.31 Millions | |
| Recent Price: 9.16 Smart Investing & Trading Score: 0 | |
| Day Percent Change: 0% Day Change: 0.03 | |
| Week Change: -3.47734% Year-to-date Change: -5.2% | |
| GRX Links: Profile News Message Board | |
| Charts:- Daily , Weekly | |
| Add GRX to Watchlist: View: Get Complete GRX Trend Analysis ➞ | |
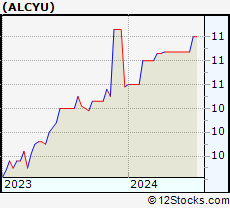 | ALCYU Alchemy Investments Acquisition Corp 1 |
| Sector: Financials | |
| SubSector: SPAC | |
| MarketCap: 147 Millions | |
| Recent Price: 10.96 Smart Investing & Trading Score: 36 | |
| Day Percent Change: 0% Day Change: -9999 | |
| Week Change: -100% Year-to-date Change: -100.0% | |
| ALCYU Links: Profile News Message Board | |
| Charts:- Daily , Weekly | |
| Add ALCYU to Watchlist: View: Get Complete ALCYU Trend Analysis ➞ | |
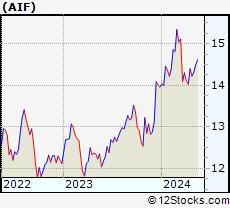 | AIF Apollo Tactical Income Fund Inc. |
| Sector: Financials | |
| SubSector: Asset Management | |
| MarketCap: 146.803 Millions | |
| Recent Price: 14.82 Smart Investing & Trading Score: 50 | |
| Day Percent Change: -0.269179% Day Change: -9999 | |
| Week Change: -0.0674309% Year-to-date Change: 0.0% | |
| AIF Links: Profile News Message Board | |
| Charts:- Daily , Weekly | |
| Add AIF to Watchlist: View: Get Complete AIF Trend Analysis ➞ | |
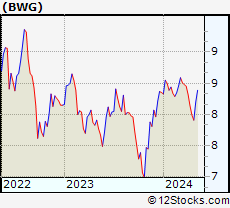 | BWG BrandywineGLOBAL - Global Income Opportunities Fund Inc |
| Sector: Financials | |
| SubSector: Closed-End Fund - Debt | |
| MarketCap: 146.76 Millions | |
| Recent Price: 8.91 Smart Investing & Trading Score: 100 | |
| Day Percent Change: 0.450958% Day Change: -0.01 | |
| Week Change: 1.59635% Year-to-date Change: 18.5% | |
| BWG Links: Profile News Message Board | |
| Charts:- Daily , Weekly | |
| Add BWG to Watchlist: View: Get Complete BWG Trend Analysis ➞ | |
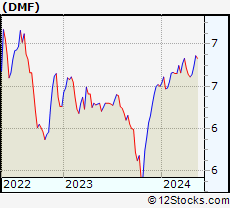 | DMF BNY Mellon Municipal Income, Inc. |
| Sector: Financials | |
| SubSector: Asset Management | |
| MarketCap: 146.403 Millions | |
| Recent Price: 6.93 Smart Investing & Trading Score: 20 | |
| Day Percent Change: 0% Day Change: -9999 | |
| Week Change: 0.434783% Year-to-date Change: -3.5% | |
| DMF Links: Profile News Message Board | |
| Charts:- Daily , Weekly | |
| Add DMF to Watchlist: View: Get Complete DMF Trend Analysis ➞ | |
 | KCAP KCAP Financial, Inc. |
| Sector: Financials | |
| SubSector: Diversified Investments | |
| MarketCap: 146.11 Millions | |
| Recent Price: 21.47 Smart Investing & Trading Score: 60 | |
| Day Percent Change: -0.139535% Day Change: -9999 | |
| Week Change: 5.60748% Year-to-date Change: 0.0% | |
| KCAP Links: Profile News Message Board | |
| Charts:- Daily , Weekly | |
| Add KCAP to Watchlist: View: Get Complete KCAP Trend Analysis ➞ | |
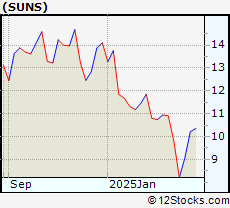 | SUNS Sunrise Realty Trust Inc |
| Sector: Financials | |
| SubSector: REIT - Mortgage | |
| MarketCap: 145.48 Millions | |
| Recent Price: 11.44 Smart Investing & Trading Score: 100 | |
| Day Percent Change: 2.05174% Day Change: -0.24 | |
| Week Change: 3.62319% Year-to-date Change: -15.1% | |
| SUNS Links: Profile News Message Board | |
| Charts:- Daily , Weekly | |
| Add SUNS to Watchlist: View: Get Complete SUNS Trend Analysis ➞ | |
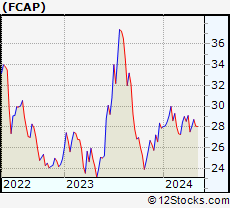 | FCAP First Capital Inc |
| Sector: Financials | |
| SubSector: Banks - Regional | |
| MarketCap: 145.34 Millions | |
| Recent Price: 44.29 Smart Investing & Trading Score: 90 | |
| Day Percent Change: -0.961538% Day Change: -0.01 | |
| Week Change: 2.61817% Year-to-date Change: 37.0% | |
| FCAP Links: Profile News Message Board | |
| Charts:- Daily , Weekly | |
| Add FCAP to Watchlist: View: Get Complete FCAP Trend Analysis ➞ | |
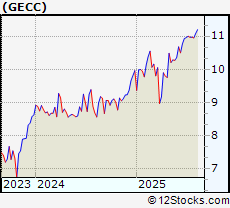 | GECC Great Elm Capital Corp |
| Sector: Financials | |
| SubSector: Asset Management | |
| MarketCap: 145.17 Millions | |
| Recent Price: 11.17 Smart Investing & Trading Score: 30 | |
| Day Percent Change: 2.38313% Day Change: 0 | |
| Week Change: -0.711111% Year-to-date Change: 9.6% | |
| GECC Links: Profile News Message Board | |
| Charts:- Daily , Weekly | |
| Add GECC to Watchlist: View: Get Complete GECC Trend Analysis ➞ | |
 | NSL Nuveen Senior Income Fund |
| Sector: Financials | |
| SubSector: Closed-End Fund - Debt | |
| MarketCap: 145.107 Millions | |
| Recent Price: 4.60 Smart Investing & Trading Score: 30 | |
| Day Percent Change: 0% Day Change: -9999 | |
| Week Change: 0% Year-to-date Change: 0.0% | |
| NSL Links: Profile News Message Board | |
| Charts:- Daily , Weekly | |
| Add NSL to Watchlist: View: Get Complete NSL Trend Analysis ➞ | |
 | FCCY 1st Constitution Bancorp |
| Sector: Financials | |
| SubSector: Regional - Northeast Banks | |
| MarketCap: 144.399 Millions | |
| Recent Price: 20.66 Smart Investing & Trading Score: 0 | |
| Day Percent Change: 0.53528% Day Change: -9999 | |
| Week Change: -25.6567% Year-to-date Change: 0.0% | |
| FCCY Links: Profile News Message Board | |
| Charts:- Daily , Weekly | |
| Add FCCY to Watchlist: View: Get Complete FCCY Trend Analysis ➞ | |
 | IVH Ivy Funds - Ivy High Income Opportunities Fund |
| Sector: Financials | |
| SubSector: Asset Management | |
| MarketCap: 143.103 Millions | |
| Recent Price: 6.92 Smart Investing & Trading Score: 20 | |
| Day Percent Change: 0% Day Change: -9999 | |
| Week Change: 0% Year-to-date Change: 0.0% | |
| IVH Links: Profile News Message Board | |
| Charts:- Daily , Weekly | |
| Add IVH to Watchlist: View: Get Complete IVH Trend Analysis ➞ | |
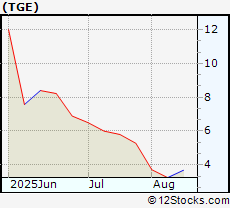 | TGE Generation Essentials Group |
| Sector: Financials | |
| SubSector: Asset Management | |
| MarketCap: 142.96 Millions | |
| Recent Price: 2.76 Smart Investing & Trading Score: 30 | |
| Day Percent Change: 6.56371% Day Change: -0.07 | |
| Week Change: -7.69231% Year-to-date Change: -72.4% | |
| TGE Links: Profile News Message Board | |
| Charts:- Daily , Weekly | |
| Add TGE to Watchlist: View: Get Complete TGE Trend Analysis ➞ | |
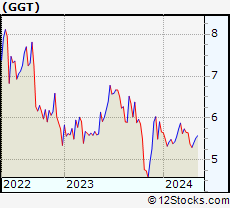 | GGT Gabelli Multimedia Trust Inc |
| Sector: Financials | |
| SubSector: Closed-End Fund - Equity | |
| MarketCap: 142.93 Millions | |
| Recent Price: 4.22 Smart Investing & Trading Score: 30 | |
| Day Percent Change: -0.471698% Day Change: 0.03 | |
| Week Change: -1.86047% Year-to-date Change: 5.5% | |
| GGT Links: Profile News Message Board | |
| Charts:- Daily , Weekly | |
| Add GGT to Watchlist: View: Get Complete GGT Trend Analysis ➞ | |
 | GPMT Granite Point Mortgage Trust Inc |
| Sector: Financials | |
| SubSector: REIT - Mortgage | |
| MarketCap: 142.66 Millions | |
| Recent Price: 2.99 Smart Investing & Trading Score: 70 | |
| Day Percent Change: 1.35593% Day Change: -0.11 | |
| Week Change: -1.32013% Year-to-date Change: 11.5% | |
| GPMT Links: Profile News Message Board | |
| Charts:- Daily , Weekly | |
| Add GPMT to Watchlist: View: Get Complete GPMT Trend Analysis ➞ | |
 | MPA BlackRock MuniYield Pennsylvania Quality Fund |
| Sector: Financials | |
| SubSector: Closed-End Fund - Debt | |
| MarketCap: 142.32 Millions | |
| Recent Price: 11.37 Smart Investing & Trading Score: 60 | |
| Day Percent Change: 0.26455% Day Change: -0.01 | |
| Week Change: 2.43243% Year-to-date Change: 0.4% | |
| MPA Links: Profile News Message Board | |
| Charts:- Daily , Weekly | |
| Add MPA to Watchlist: View: Get Complete MPA Trend Analysis ➞ | |
 | EVBS Eastern Virginia Bankshares, Inc. |
| Sector: Financials | |
| SubSector: Regional - Southeast Banks | |
| MarketCap: 141.64 Millions | |
| Recent Price: 3.52 Smart Investing & Trading Score: 10 | |
| Day Percent Change: -0.564972% Day Change: -9999 | |
| Week Change: -64.7295% Year-to-date Change: 0.0% | |
| EVBS Links: Profile News Message Board | |
| Charts:- Daily , Weekly | |
| Add EVBS to Watchlist: View: Get Complete EVBS Trend Analysis ➞ | |
 | HYB The New America High Income Fund Inc. |
| Sector: Financials | |
| SubSector: Closed-End Fund - Debt | |
| MarketCap: 141.107 Millions | |
| Recent Price: 8.20 Smart Investing & Trading Score: 10 | |
| Day Percent Change: 0% Day Change: -9999 | |
| Week Change: 0% Year-to-date Change: 0.1% | |
| HYB Links: Profile News Message Board | |
| Charts:- Daily , Weekly | |
| Add HYB to Watchlist: View: Get Complete HYB Trend Analysis ➞ | |
 | CMFN CM Finance Inc. |
| Sector: Financials | |
| SubSector: Asset Management | |
| MarketCap: 140.99 Millions | |
| Recent Price: 20.42 Smart Investing & Trading Score: 60 | |
| Day Percent Change: 0.789733% Day Change: -9999 | |
| Week Change: 0.442696% Year-to-date Change: 0.0% | |
| CMFN Links: Profile News Message Board | |
| Charts:- Daily , Weekly | |
| Add CMFN to Watchlist: View: Get Complete CMFN Trend Analysis ➞ | |
 | DNBF DNB Financial Corporation |
| Sector: Financials | |
| SubSector: Regional - Mid-Atlantic Banks | |
| MarketCap: 140.17 Millions | |
| Recent Price: 20.05 Smart Investing & Trading Score: 90 | |
| Day Percent Change: 5.80475% Day Change: -9999 | |
| Week Change: 44.7653% Year-to-date Change: 0.0% | |
| DNBF Links: Profile News Message Board | |
| Charts:- Daily , Weekly | |
| Add DNBF to Watchlist: View: Get Complete DNBF Trend Analysis ➞ | |
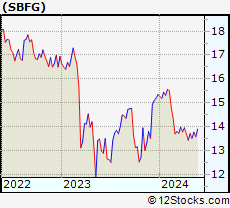 | SBFG SB Financial Group Inc |
| Sector: Financials | |
| SubSector: Banks - Regional | |
| MarketCap: 139.91 Millions | |
| Recent Price: 20.74 Smart Investing & Trading Score: 60 | |
| Day Percent Change: 1.1214% Day Change: -0.05 | |
| Week Change: -4.15897% Year-to-date Change: 1.4% | |
| SBFG Links: Profile News Message Board | |
| Charts:- Daily , Weekly | |
| Add SBFG to Watchlist: View: Get Complete SBFG Trend Analysis ➞ | |
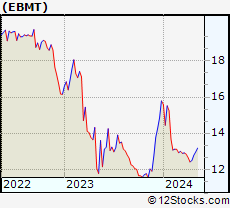 | EBMT Eagle Bancorp Montana Inc |
| Sector: Financials | |
| SubSector: Banks - Regional | |
| MarketCap: 139.56 Millions | |
| Recent Price: 17.35 Smart Investing & Trading Score: 60 | |
| Day Percent Change: 0.842778% Day Change: -0.17 | |
| Week Change: -0.458979% Year-to-date Change: 19.5% | |
| EBMT Links: Profile News Message Board | |
| Charts:- Daily , Weekly | |
| Add EBMT to Watchlist: View: Get Complete EBMT Trend Analysis ➞ | |
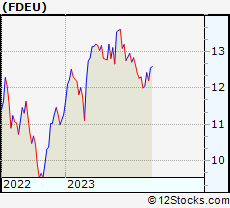 | FDEU First Trust Dynamic Europe Equity Income Fund |
| Sector: Financials | |
| SubSector: Asset Management | |
| MarketCap: 139.503 Millions | |
| Recent Price: 12.59 Smart Investing & Trading Score: 50 | |
| Day Percent Change: 0% Day Change: -9999 | |
| Week Change: 2.35772% Year-to-date Change: 0.0% | |
| FDEU Links: Profile News Message Board | |
| Charts:- Daily , Weekly | |
| Add FDEU to Watchlist: View: Get Complete FDEU Trend Analysis ➞ | |
| For tabular summary view of above stock list: Summary View ➞ 0 - 25 , 25 - 50 , 50 - 75 , 75 - 100 , 100 - 125 , 125 - 150 , 150 - 175 , 175 - 200 , 200 - 225 , 225 - 250 , 250 - 275 , 275 - 300 , 300 - 325 , 325 - 350 , 350 - 375 , 375 - 400 , 400 - 425 , 425 - 450 , 450 - 475 , 475 - 500 , 500 - 525 , 525 - 550 , 550 - 575 , 575 - 600 , 600 - 625 , 625 - 650 , 650 - 675 , 675 - 700 , 700 - 725 , 725 - 750 , 750 - 775 , 775 - 800 , 800 - 825 , 825 - 850 , 850 - 875 , 875 - 900 , 900 - 925 , 925 - 950 , 950 - 975 , 975 - 1000 , 1000 - 1025 , 1025 - 1050 , 1050 - 1075 , 1075 - 1100 , 1100 - 1125 , 1125 - 1150 , 1150 - 1175 , 1175 - 1200 , 1200 - 1225 , 1225 - 1250 , 1250 - 1275 , 1275 - 1300 , 1300 - 1325 , 1325 - 1350 , 1350 - 1375 , 1375 - 1400 , 1400 - 1425 , 1425 - 1450 , 1450 - 1475 , 1475 - 1500 , 1500 - 1525 , 1525 - 1550 | ||
| Click To Change The Sort Order: By Market Cap or Company Size Performance: Year-to-date, Week and Day | |
| Select Chart Type: | ||
|
Best Stocks Today 12Stocks.com |
© 2025 12Stocks.com Terms & Conditions Privacy Contact Us
All Information Provided Only For Education And Not To Be Used For Investing or Trading. See Terms & Conditions


One More Thing ... Get Best Stocks Delivered Daily!
Never Ever Miss A Move With Our Top Ten Stocks Lists
Find Best Stocks In Any Market - Bull or Bear Market
Take A Peek At Our Top Ten Stocks Lists: Daily, Weekly, Year-to-Date & Top Trends
Find Best Stocks In Any Market - Bull or Bear Market
Take A Peek At Our Top Ten Stocks Lists: Daily, Weekly, Year-to-Date & Top Trends
Financial Stocks With Best Up Trends [0-bearish to 100-bullish]: PIMCO California[100], Torchmark [100], B. Riley[100], PIMCO California[100], Better Home[100], Triumph Bancorp[100], Cipher Mining[100], PIMCO Municipal[100], PIMCO Municipal[100], SuRo Capital[100], Front Yard[100]
Best Financial Stocks Year-to-Date:
Insight Select[12384.6%], Oxford Lane[292.029%], Better Home[209.081%], Robinhood Markets[200.811%], Metalpha Technology[196.46%], Cipher Mining[156.315%], Mr. Cooper[135%], LoanDepot [133.846%], Banco Santander[129.354%], Deutsche Bank[117.764%], IHS Holding[117.61%] Best Financial Stocks This Week:
Colony Starwood[15929900%], Blackhawk Network[91300%], Macquarie Global[81662.9%], Credit Suisse[63241.6%], Pennsylvania Real[23823%], First Republic[22570.9%], Select ome[14000%], CorEnergy Infrastructure[6797.78%], FedNat Holding[5525%], BlackRock Municipal[5340%], BlackRock MuniYield[3379.04%] Best Financial Stocks Daily:
Offerpad [12.3487%], PIMCO California[11.9545%], Torchmark [11.8363%], B. Riley[11.5556%], PIMCO California[11.4754%], BlackRock Muni[10.8108%], Blackrock MuniYield[10.72%], Better Home[10.5675%], Triumph Bancorp[10.2661%], BlackRock MuniYield[8.15348%], Summit [7.79817%]