
 Login Sign Up


| |||||
 |  | ||||

| 12Stocks.com Market Intelligence |
Best Financial Stocks
| In a hurry? Financial Stocks Lists: Performance Trends Table, Stock Charts
Sort Financial stocks: Daily, Weekly, Year-to-Date, Market Cap & Trends. Filter Financial stocks list by size:All Financial Large Mid-Range Small & MicroCap |
| 12Stocks.com Financial Stocks Performances & Trends Daily | |||||||||
|
|  The overall Smart Investing & Trading Score is 90 (0-bearish to 100-bullish) which puts Financial sector in short term bullish trend. The Smart Investing & Trading Score from previous trading session is 60 and hence an improvement of trend.
| ||||||||
Here are the Smart Investing & Trading Scores of the most requested Financial stocks at 12Stocks.com (click stock name for detailed review):
|


| 12Stocks.com: Investing in Financial sector with Stocks | |
|
The following table helps investors and traders sort through current performance and trends (as measured by Smart Investing & Trading Score) of various
stocks in the Financial sector. Quick View: Move mouse or cursor over stock symbol (ticker) to view short-term Technical chart and over stock name to view long term chart. Click on  to add stock symbol to your watchlist and to add stock symbol to your watchlist and  to view watchlist. Click on any ticker or stock name for detailed market intelligence report for that stock. to view watchlist. Click on any ticker or stock name for detailed market intelligence report for that stock. |
12Stocks.com Performance of Stocks in Financial Sector
| Ticker | Stock Name | Watchlist | Category | Recent Price | Trend Score | Change % | YTD Change% |
| FNHC | FedNat Holding |   | Insurance | 0.09 | 100 | 3.45% | 0.00% |
| OPAD | Offerpad | | Real Estate Services | 4.64 | 70 | 12.35% | 73.13% |
| LARK | Landmark Bancorp | | Banks - Regional | 27.11 | 90 | -0.48% | 14.71% |
| SWIN | Solowin | | Capital Markets | 2.87 | 50 | 7.49% | 43.86% |
| STRS | Stratus Properties | | Real Estate - | 19.78 | 90 | -1.54% | -3.37% |
| BFIN | Bank Corp | | Banks - Regional | 12.14 | 40 | 0.41% | 1.42% |
| AJX | Great Ajax | | Mortgage | 3.00 | 40 | -0.66% | 0.00% |
| BGIO | BlackRock 2022 | | Asset Mgmt | 2.63 | 20 | 0.00% | 0.00% |
| SBCP | Sunshine Bancorp | | Regional Banks | 0.17 | 10 | 0.00% | 0.00% |
| PFBI | Premier | | Regional Banks | 10.30 | 30 | 1.08% | 0.00% |
| NNY | Nuveen New | | Closed-End Fund - Debt | 8.36 | 80 | -0.24% | 5.60% |
| EVG | Eaton Vance | | Closed-End Fund - Debt | 11.30 | 20 | -0.18% | 7.82% |
| PWOD | Penns Woods | | Regional Banks | 30.00 | 10 | -1.64% | 2.90% |
| MSD | Morgan Stanley | | Closed-End Fund - Debt | 7.64 | 80 | 0.00% | 5.48% |
| BKCC | BlackRock Capital | | Asset Mgmt | 64.86 | 90 | 1.63% | 0.00% |
| RILY | B. Riley | | Financial Conglomerates | 7.53 | 100 | 11.56% | 65.13% |
| ECF | Ellsworth Growth | | Closed-End Fund - Equity | 11.53 | 60 | 0.35% | 20.35% |
| IGA | Voya Global | | Closed-End Fund - Foreign | 9.96 | 50 | -0.10% | 15.07% |
| BCBP | BCB Bancorp | | Banks - Regional | 8.63 | 30 | -0.12% | -20.90% |
| BANX | ArrowMark | | Closed-End Fund - Debt | 21.30 | 100 | 0.90% | 5.43% |
| PFD | Flaherty & Crumrine Preferred and ome Fund | | Closed-End Fund - Debt | 12.04 | 100 | 1.09% | 11.23% |
| VTN | Invesco Trust | | Closed-End Fund - Debt | 10.84 | 90 | 0.46% | 6.13% |
| LHC | Leo | | SPAC | 11.87 | 20 | 0.00% | 0.00% |
| ENFC | Entegra | | Regional Banks | 8.85 | 40 | 1.14% | 0.00% |
| SLCT | Select Bancorp | | Regional Banks | 7.01 | 10 | 0.14% | 0.00% |
| For chart view version of above stock list: Chart View ➞ 0 - 25 , 25 - 50 , 50 - 75 , 75 - 100 , 100 - 125 , 125 - 150 , 150 - 175 , 175 - 200 , 200 - 225 , 225 - 250 , 250 - 275 , 275 - 300 , 300 - 325 , 325 - 350 , 350 - 375 , 375 - 400 , 400 - 425 , 425 - 450 , 450 - 475 , 475 - 500 , 500 - 525 , 525 - 550 , 550 - 575 , 575 - 600 , 600 - 625 , 625 - 650 , 650 - 675 , 675 - 700 , 700 - 725 , 725 - 750 , 750 - 775 , 775 - 800 , 800 - 825 , 825 - 850 , 850 - 875 , 875 - 900 , 900 - 925 , 925 - 950 , 950 - 975 , 975 - 1000 , 1000 - 1025 , 1025 - 1050 , 1050 - 1075 , 1075 - 1100 , 1100 - 1125 , 1125 - 1150 , 1150 - 1175 , 1175 - 1200 , 1200 - 1225 , 1225 - 1250 , 1250 - 1275 , 1275 - 1300 , 1300 - 1325 , 1325 - 1350 , 1350 - 1375 , 1375 - 1400 , 1400 - 1425 , 1425 - 1450 , 1450 - 1475 , 1475 - 1500 , 1500 - 1525 , 1525 - 1550 | ||
 | Click To Change The Sort Order: By Market Cap or Company Size Performance: Year-to-date, Week and Day |  |
|
Get the most comprehensive stock market coverage daily at 12Stocks.com ➞ Best Stocks Today ➞ Best Stocks Weekly ➞ Best Stocks Year-to-Date ➞ Best Stocks Trends ➞  Best Stocks Today 12Stocks.com Best Nasdaq Stocks ➞ Best S&P 500 Stocks ➞ Best Tech Stocks ➞ Best Biotech Stocks ➞ |
| Detailed Overview of Financial Stocks |
| Financial Technical Overview, Leaders & Laggards, Top Financial ETF Funds & Detailed Financial Stocks List, Charts, Trends & More |
| Financial Sector: Technical Analysis, Trends & YTD Performance | |
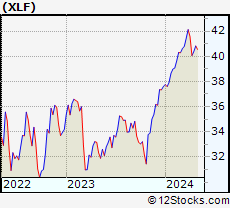
| Financial sector is composed of stocks
from banks, brokers, insurance, REITs
and services subsectors. Financial sector, as represented by XLF, an exchange-traded fund [ETF] that holds basket of Financial stocks (e.g, Bank of America, Goldman Sachs) is up by 12.9691% and is currently underperforming the overall market by -0.1777% year-to-date. Below is a quick view of Technical charts and trends: |
|
 XLF Weekly Chart |
|
| Long Term Trend: Good | |
| Medium Term Trend: Good | |
 XLF Daily Chart |
|
| Short Term Trend: Very Good | |
| Overall Trend Score: 90 | |
| YTD Performance: 12.9691% | |
| **Trend Scores & Views Are Only For Educational Purposes And Not For Investing | |
| 12Stocks.com: Top Performing Financial Sector Stocks | |||||||||||||||||||||||||||||||||||||||||||||||
 The top performing Financial sector stocks year to date are
Now, more recently, over last week, the top performing Financial sector stocks on the move are


|
|||||||||||||||||||||||||||||||||||||||||||||||
| 12Stocks.com: Investing in Financial Sector using Exchange Traded Funds | |
|
The following table shows list of key exchange traded funds (ETF) that
help investors track Financial Index. For detailed view, check out our ETF Funds section of our website. Quick View: Move mouse or cursor over ETF symbol (ticker) to view short-term Technical chart and over ETF name to view long term chart. Click on ticker or stock name for detailed view. Click on to add stock symbol to your watchlist and to view watchlist. |
12Stocks.com List of ETFs that track Financial Index
| Ticker | ETF Name | Watchlist | Recent Price | Smart Investing & Trading Score | Change % | Week % | Year-to-date % |
| CHIX | China Financials | | 10.57 | 20 | 0 | 0 | 0% |
| 12Stocks.com: Charts, Trends, Fundamental Data and Performances of Financial Stocks | |
|
We now take in-depth look at all Financial stocks including charts, multi-period performances and overall trends (as measured by Smart Investing & Trading Score). One can sort Financial stocks (click link to choose) by Daily, Weekly and by Year-to-Date performances. Also, one can sort by size of the company or by market capitalization. |
| Select Your Default Chart Type: | |||||
| |||||
| Click on stock symbol or name for detailed view. Click on to add stock symbol to your watchlist and to view watchlist. Quick View: Move mouse or cursor over "Daily" to quickly view daily Technical stock chart and over "Weekly" to view weekly Technical stock chart. | |||||

 | FNHC FedNat Holding Company |
| Sector: Financials | |
| SubSector: Property & Casualty Insurance | |
| MarketCap: 158.512 Millions | |
| Recent Price: 0.09 Smart Investing & Trading Score: 100 | |
| Day Percent Change: 3.44828% Day Change: -9999 | |
| Week Change: 5525% Year-to-date Change: 0.0% | |
| FNHC Links: Profile News Message Board | |
| Charts:- Daily , Weekly | |
| Add FNHC to Watchlist: View: Get Complete FNHC Trend Analysis ➞ | |
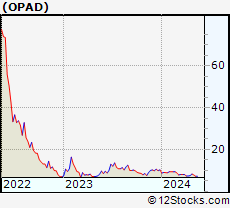 | OPAD Offerpad Solutions Inc |
| Sector: Financials | |
| SubSector: Real Estate Services | |
| MarketCap: 156.28 Millions | |
| Recent Price: 4.64 Smart Investing & Trading Score: 70 | |
| Day Percent Change: 12.3487% Day Change: 0.03 | |
| Week Change: 10.2138% Year-to-date Change: 73.1% | |
| OPAD Links: Profile News Message Board | |
| Charts:- Daily , Weekly | |
| Add OPAD to Watchlist: View: Get Complete OPAD Trend Analysis ➞ | |
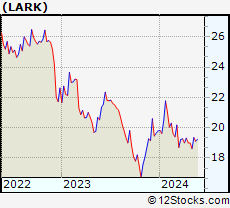 | LARK Landmark Bancorp Inc |
| Sector: Financials | |
| SubSector: Banks - Regional | |
| MarketCap: 155.4 Millions | |
| Recent Price: 27.11 Smart Investing & Trading Score: 90 | |
| Day Percent Change: -0.477239% Day Change: -0.25 | |
| Week Change: 1.08128% Year-to-date Change: 14.7% | |
| LARK Links: Profile News Message Board | |
| Charts:- Daily , Weekly | |
| Add LARK to Watchlist: View: Get Complete LARK Trend Analysis ➞ | |
 | SWIN Solowin Holdings |
| Sector: Financials | |
| SubSector: Capital Markets | |
| MarketCap: 155.27 Millions | |
| Recent Price: 2.87 Smart Investing & Trading Score: 50 | |
| Day Percent Change: 7.49064% Day Change: -0.09 | |
| Week Change: 7.89474% Year-to-date Change: 43.9% | |
| SWIN Links: Profile News Message Board | |
| Charts:- Daily , Weekly | |
| Add SWIN to Watchlist: View: Get Complete SWIN Trend Analysis ➞ | |
 | STRS Stratus Properties Inc |
| Sector: Financials | |
| SubSector: Real Estate - Diversified | |
| MarketCap: 154.95 Millions | |
| Recent Price: 19.78 Smart Investing & Trading Score: 90 | |
| Day Percent Change: -1.54306% Day Change: -0.32 | |
| Week Change: 4.10526% Year-to-date Change: -3.4% | |
| STRS Links: Profile News Message Board | |
| Charts:- Daily , Weekly | |
| Add STRS to Watchlist: View: Get Complete STRS Trend Analysis ➞ | |
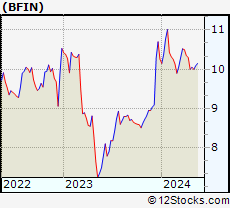 | BFIN Bankfinancial Corp |
| Sector: Financials | |
| SubSector: Banks - Regional | |
| MarketCap: 154.76 Millions | |
| Recent Price: 12.14 Smart Investing & Trading Score: 40 | |
| Day Percent Change: 0.413565% Day Change: 0.06 | |
| Week Change: -0.573301% Year-to-date Change: 1.4% | |
| BFIN Links: Profile News Message Board | |
| Charts:- Daily , Weekly | |
| Add BFIN to Watchlist: View: Get Complete BFIN Trend Analysis ➞ | |
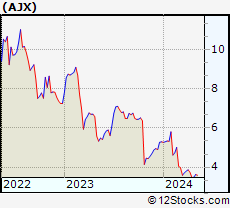 | AJX Great Ajax Corp. |
| Sector: Financials | |
| SubSector: Mortgage Investment | |
| MarketCap: 154.539 Millions | |
| Recent Price: 3.00 Smart Investing & Trading Score: 40 | |
| Day Percent Change: -0.662252% Day Change: -9999 | |
| Week Change: 0.334448% Year-to-date Change: 0.0% | |
| AJX Links: Profile News Message Board | |
| Charts:- Daily , Weekly | |
| Add AJX to Watchlist: View: Get Complete AJX Trend Analysis ➞ | |
 | BGIO BlackRock 2022 Global Income Opportunity Trust |
| Sector: Financials | |
| SubSector: Asset Management | |
| MarketCap: 154.403 Millions | |
| Recent Price: 2.63 Smart Investing & Trading Score: 20 | |
| Day Percent Change: 0% Day Change: -9999 | |
| Week Change: 0% Year-to-date Change: 0.0% | |
| BGIO Links: Profile News Message Board | |
| Charts:- Daily , Weekly | |
| Add BGIO to Watchlist: View: Get Complete BGIO Trend Analysis ➞ | |
 | SBCP Sunshine Bancorp, Inc. |
| Sector: Financials | |
| SubSector: Regional - Mid-Atlantic Banks | |
| MarketCap: 154.09 Millions | |
| Recent Price: 0.17 Smart Investing & Trading Score: 10 | |
| Day Percent Change: 0% Day Change: -9999 | |
| Week Change: -93.3594% Year-to-date Change: 0.0% | |
| SBCP Links: Profile News Message Board | |
| Charts:- Daily , Weekly | |
| Add SBCP to Watchlist: View: Get Complete SBCP Trend Analysis ➞ | |
 | PFBI Premier Financial Bancorp, Inc. |
| Sector: Financials | |
| SubSector: Regional - Southeast Banks | |
| MarketCap: 154.035 Millions | |
| Recent Price: 10.30 Smart Investing & Trading Score: 30 | |
| Day Percent Change: 1.07949% Day Change: -9999 | |
| Week Change: -42.1023% Year-to-date Change: 0.0% | |
| PFBI Links: Profile News Message Board | |
| Charts:- Daily , Weekly | |
| Add PFBI to Watchlist: View: Get Complete PFBI Trend Analysis ➞ | |
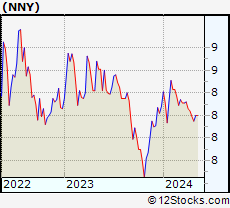 | NNY Nuveen New York Municipal Value Fund |
| Sector: Financials | |
| SubSector: Closed-End Fund - Debt | |
| MarketCap: 153.54 Millions | |
| Recent Price: 8.36 Smart Investing & Trading Score: 80 | |
| Day Percent Change: -0.238663% Day Change: -0.01 | |
| Week Change: 1.95122% Year-to-date Change: 5.6% | |
| NNY Links: Profile News Message Board | |
| Charts:- Daily , Weekly | |
| Add NNY to Watchlist: View: Get Complete NNY Trend Analysis ➞ | |
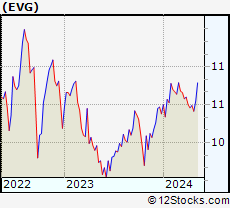 | EVG Eaton Vance Short Duration Diversified Income Fund |
| Sector: Financials | |
| SubSector: Closed-End Fund - Debt | |
| MarketCap: 153.36 Millions | |
| Recent Price: 11.30 Smart Investing & Trading Score: 20 | |
| Day Percent Change: -0.176678% Day Change: -0.07 | |
| Week Change: -0.964067% Year-to-date Change: 7.8% | |
| EVG Links: Profile News Message Board | |
| Charts:- Daily , Weekly | |
| Add EVG to Watchlist: View: Get Complete EVG Trend Analysis ➞ | |
 | PWOD Penns Woods Bancorp, Inc. |
| Sector: Financials | |
| SubSector: Regional - Mid-Atlantic Banks | |
| MarketCap: 152.559 Millions | |
| Recent Price: 30.00 Smart Investing & Trading Score: 10 | |
| Day Percent Change: -1.63934% Day Change: -9999 | |
| Week Change: -6.30856% Year-to-date Change: 2.9% | |
| PWOD Links: Profile News Message Board | |
| Charts:- Daily , Weekly | |
| Add PWOD to Watchlist: View: Get Complete PWOD Trend Analysis ➞ | |
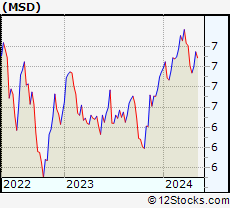 | MSD Morgan Stanley Emerging Markets Debt Fund Inc |
| Sector: Financials | |
| SubSector: Closed-End Fund - Debt | |
| MarketCap: 152.19 Millions | |
| Recent Price: 7.64 Smart Investing & Trading Score: 80 | |
| Day Percent Change: 0% Day Change: -0.04 | |
| Week Change: 1.46082% Year-to-date Change: 5.5% | |
| MSD Links: Profile News Message Board | |
| Charts:- Daily , Weekly | |
| Add MSD to Watchlist: View: Get Complete MSD Trend Analysis ➞ | |
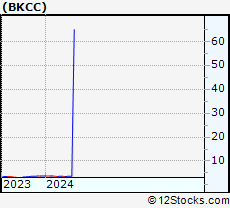 | BKCC BlackRock Capital Investment Corporation |
| Sector: Financials | |
| SubSector: Asset Management | |
| MarketCap: 152.103 Millions | |
| Recent Price: 64.86 Smart Investing & Trading Score: 90 | |
| Day Percent Change: 1.62958% Day Change: -9999 | |
| Week Change: 1652.97% Year-to-date Change: 0.0% | |
| BKCC Links: Profile News Message Board | |
| Charts:- Daily , Weekly | |
| Add BKCC to Watchlist: View: Get Complete BKCC Trend Analysis ➞ | |
 | RILY B. Riley Financial Inc |
| Sector: Financials | |
| SubSector: Financial Conglomerates | |
| MarketCap: 151.72 Millions | |
| Recent Price: 7.53 Smart Investing & Trading Score: 100 | |
| Day Percent Change: 11.5556% Day Change: -0.38 | |
| Week Change: 41.9416% Year-to-date Change: 65.1% | |
| RILY Links: Profile News Message Board | |
| Charts:- Daily , Weekly | |
| Add RILY to Watchlist: View: Get Complete RILY Trend Analysis ➞ | |
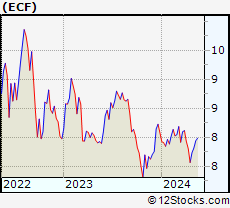 | ECF Ellsworth Growth and Income Fund Ltd |
| Sector: Financials | |
| SubSector: Closed-End Fund - Equity | |
| MarketCap: 151.68 Millions | |
| Recent Price: 11.53 Smart Investing & Trading Score: 60 | |
| Day Percent Change: 0.348129% Day Change: 0.06 | |
| Week Change: 1.94518% Year-to-date Change: 20.4% | |
| ECF Links: Profile News Message Board | |
| Charts:- Daily , Weekly | |
| Add ECF to Watchlist: View: Get Complete ECF Trend Analysis ➞ | |
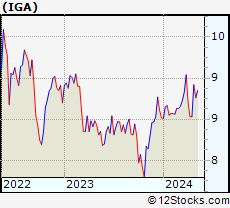 | IGA Voya Global Advantage and Premium Opportunity Fund |
| Sector: Financials | |
| SubSector: Closed-End Fund - Foreign | |
| MarketCap: 151.42 Millions | |
| Recent Price: 9.96 Smart Investing & Trading Score: 50 | |
| Day Percent Change: -0.100301% Day Change: -0.02 | |
| Week Change: 0.809717% Year-to-date Change: 15.1% | |
| IGA Links: Profile News Message Board | |
| Charts:- Daily , Weekly | |
| Add IGA to Watchlist: View: Get Complete IGA Trend Analysis ➞ | |
 | BCBP BCB Bancorp Inc (NJ) |
| Sector: Financials | |
| SubSector: Banks - Regional | |
| MarketCap: 150.28 Millions | |
| Recent Price: 8.63 Smart Investing & Trading Score: 30 | |
| Day Percent Change: -0.115741% Day Change: -0.14 | |
| Week Change: -0.690449% Year-to-date Change: -20.9% | |
| BCBP Links: Profile News Message Board | |
| Charts:- Daily , Weekly | |
| Add BCBP to Watchlist: View: Get Complete BCBP Trend Analysis ➞ | |
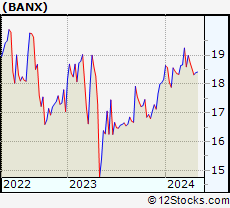 | BANX ArrowMark Financial Corp |
| Sector: Financials | |
| SubSector: Closed-End Fund - Debt | |
| MarketCap: 149.83 Millions | |
| Recent Price: 21.30 Smart Investing & Trading Score: 100 | |
| Day Percent Change: 0.900047% Day Change: 0.14 | |
| Week Change: 2.79923% Year-to-date Change: 5.4% | |
| BANX Links: Profile News Message Board | |
| Charts:- Daily , Weekly | |
| Add BANX to Watchlist: View: Get Complete BANX Trend Analysis ➞ | |
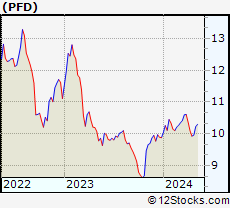 | PFD Flaherty & Crumrine Preferred and Income Fund Inc |
| Sector: Financials | |
| SubSector: Closed-End Fund - Debt | |
| MarketCap: 149.6 Millions | |
| Recent Price: 12.04 Smart Investing & Trading Score: 100 | |
| Day Percent Change: 1.09152% Day Change: 0 | |
| Week Change: 2.55537% Year-to-date Change: 11.2% | |
| PFD Links: Profile News Message Board | |
| Charts:- Daily , Weekly | |
| Add PFD to Watchlist: View: Get Complete PFD Trend Analysis ➞ | |
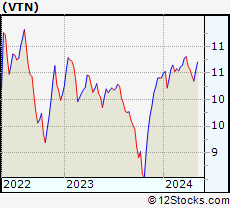 | VTN Invesco Trust For Investment Grade New York Municipals |
| Sector: Financials | |
| SubSector: Closed-End Fund - Debt | |
| MarketCap: 149.3 Millions | |
| Recent Price: 10.84 Smart Investing & Trading Score: 90 | |
| Day Percent Change: 0.463392% Day Change: -0.06 | |
| Week Change: 3.73206% Year-to-date Change: 6.1% | |
| VTN Links: Profile News Message Board | |
| Charts:- Daily , Weekly | |
| Add VTN to Watchlist: View: Get Complete VTN Trend Analysis ➞ | |
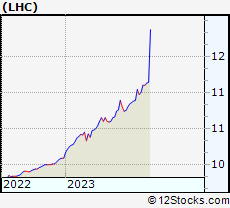 | LHC Leo Holdings Corp. II |
| Sector: Financials | |
| SubSector: SPAC | |
| MarketCap: 149 Millions | |
| Recent Price: 11.87 Smart Investing & Trading Score: 20 | |
| Day Percent Change: 0% Day Change: -9999 | |
| Week Change: 0% Year-to-date Change: 0.0% | |
| LHC Links: Profile News Message Board | |
| Charts:- Daily , Weekly | |
| Add LHC to Watchlist: View: Get Complete LHC Trend Analysis ➞ | |
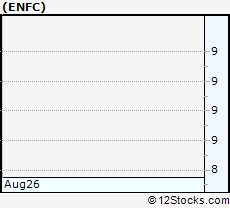 | ENFC Entegra Financial Corp. |
| Sector: Financials | |
| SubSector: Regional - Southeast Banks | |
| MarketCap: 148.81 Millions | |
| Recent Price: 8.85 Smart Investing & Trading Score: 40 | |
| Day Percent Change: 1.14286% Day Change: -9999 | |
| Week Change: -71.4792% Year-to-date Change: 0.0% | |
| ENFC Links: Profile News Message Board | |
| Charts:- Daily , Weekly | |
| Add ENFC to Watchlist: View: Get Complete ENFC Trend Analysis ➞ | |
 | SLCT Select Bancorp, Inc. |
| Sector: Financials | |
| SubSector: Regional - Mid-Atlantic Banks | |
| MarketCap: 148.259 Millions | |
| Recent Price: 7.01 Smart Investing & Trading Score: 10 | |
| Day Percent Change: 0.142857% Day Change: -9999 | |
| Week Change: -62.8708% Year-to-date Change: 0.0% | |
| SLCT Links: Profile News Message Board | |
| Charts:- Daily , Weekly | |
| Add SLCT to Watchlist: View: Get Complete SLCT Trend Analysis ➞ | |
| For tabular summary view of above stock list: Summary View ➞ 0 - 25 , 25 - 50 , 50 - 75 , 75 - 100 , 100 - 125 , 125 - 150 , 150 - 175 , 175 - 200 , 200 - 225 , 225 - 250 , 250 - 275 , 275 - 300 , 300 - 325 , 325 - 350 , 350 - 375 , 375 - 400 , 400 - 425 , 425 - 450 , 450 - 475 , 475 - 500 , 500 - 525 , 525 - 550 , 550 - 575 , 575 - 600 , 600 - 625 , 625 - 650 , 650 - 675 , 675 - 700 , 700 - 725 , 725 - 750 , 750 - 775 , 775 - 800 , 800 - 825 , 825 - 850 , 850 - 875 , 875 - 900 , 900 - 925 , 925 - 950 , 950 - 975 , 975 - 1000 , 1000 - 1025 , 1025 - 1050 , 1050 - 1075 , 1075 - 1100 , 1100 - 1125 , 1125 - 1150 , 1150 - 1175 , 1175 - 1200 , 1200 - 1225 , 1225 - 1250 , 1250 - 1275 , 1275 - 1300 , 1300 - 1325 , 1325 - 1350 , 1350 - 1375 , 1375 - 1400 , 1400 - 1425 , 1425 - 1450 , 1450 - 1475 , 1475 - 1500 , 1500 - 1525 , 1525 - 1550 | ||
| Click To Change The Sort Order: By Market Cap or Company Size Performance: Year-to-date, Week and Day | |
| Select Chart Type: | ||
|
Best Stocks Today 12Stocks.com |
© 2025 12Stocks.com Terms & Conditions Privacy Contact Us
All Information Provided Only For Education And Not To Be Used For Investing or Trading. See Terms & Conditions


One More Thing ... Get Best Stocks Delivered Daily!
Never Ever Miss A Move With Our Top Ten Stocks Lists
Find Best Stocks In Any Market - Bull or Bear Market
Take A Peek At Our Top Ten Stocks Lists: Daily, Weekly, Year-to-Date & Top Trends
Find Best Stocks In Any Market - Bull or Bear Market
Take A Peek At Our Top Ten Stocks Lists: Daily, Weekly, Year-to-Date & Top Trends
Financial Stocks With Best Up Trends [0-bearish to 100-bullish]: PIMCO California[100], Torchmark [100], B. Riley[100], PIMCO California[100], Better Home[100], Triumph Bancorp[100], Cipher Mining[100], PIMCO Municipal[100], PIMCO Municipal[100], SuRo Capital[100], Front Yard[100]
Best Financial Stocks Year-to-Date:
Insight Select[12384.6%], Oxford Lane[292.029%], Better Home[209.081%], Robinhood Markets[200.811%], Metalpha Technology[196.46%], Cipher Mining[156.315%], Mr. Cooper[135%], LoanDepot [133.846%], Banco Santander[129.354%], Deutsche Bank[117.764%], IHS Holding[117.61%] Best Financial Stocks This Week:
Colony Starwood[15929900%], Blackhawk Network[91300%], Macquarie Global[81662.9%], Credit Suisse[63241.6%], Pennsylvania Real[23823%], First Republic[22570.9%], Select ome[14000%], CorEnergy Infrastructure[6797.78%], FedNat Holding[5525%], BlackRock Municipal[5340%], BlackRock MuniYield[3379.04%] Best Financial Stocks Daily:
Offerpad [12.3487%], PIMCO California[11.9545%], Torchmark [11.8363%], B. Riley[11.5556%], PIMCO California[11.4754%], BlackRock Muni[10.8108%], Blackrock MuniYield[10.72%], Better Home[10.5675%], Triumph Bancorp[10.2661%], BlackRock MuniYield[8.15348%], Summit [7.79817%]