
 Login Sign Up


| |||||
 |  | ||||

| 12Stocks.com Market Intelligence |
Best Financial Stocks
| In a hurry? Financial Stocks Lists: Performance Trends Table, Stock Charts
Sort Financial stocks: Daily, Weekly, Year-to-Date, Market Cap & Trends. Filter Financial stocks list by size:All Financial Large Mid-Range Small & MicroCap |
| 12Stocks.com Financial Stocks Performances & Trends Daily | |||||||||
|
|  The overall Smart Investing & Trading Score is 90 (0-bearish to 100-bullish) which puts Financial sector in short term bullish trend. The Smart Investing & Trading Score from previous trading session is 60 and hence an improvement of trend.
| ||||||||
Here are the Smart Investing & Trading Scores of the most requested Financial stocks at 12Stocks.com (click stock name for detailed review):
|


| 12Stocks.com: Investing in Financial sector with Stocks | |
|
The following table helps investors and traders sort through current performance and trends (as measured by Smart Investing & Trading Score) of various
stocks in the Financial sector. Quick View: Move mouse or cursor over stock symbol (ticker) to view short-term Technical chart and over stock name to view long term chart. Click on  to add stock symbol to your watchlist and to add stock symbol to your watchlist and  to view watchlist. Click on any ticker or stock name for detailed market intelligence report for that stock. to view watchlist. Click on any ticker or stock name for detailed market intelligence report for that stock. |
12Stocks.com Performance of Stocks in Financial Sector
| Ticker | Stock Name | Watchlist | Category | Recent Price | Trend Score | Change % | YTD Change% |
| MQT | BlackRock MuniYield |   | Closed-End Fund - Debt | 10.14 | 80 | 0.20% | 5.07% |
| OPOF | Old Point | | Banks - Regional | 42.10 | 90 | 2.28% | 63.95% |
| MFM | MFS Municipal | | Closed-End Fund - Debt | 5.38 | 90 | 0.94% | 3.03% |
| INBK | First Internet | | Banks - Regional | 24.10 | 20 | 1.01% | -31.42% |
| MUE | BlackRock Muni | | Closed-End Fund - Debt | 10.06 | 90 | 0.40% | 3.10% |
| FCCO | First Community | | Banks - Regional | 28.41 | 100 | 0.82% | 21.56% |
| EARN | Ellington Credit | | Asset Mgmt | 5.70 | 30 | 0.53% | -6.11% |
| SRG | Seritage Growth | | Real Estate Services | 4.10 | 60 | 0.99% | -1.44% |
| HBMD | Howard Bancorp | | Regional Banks | 44.34 | 100 | 0.02% | 0.00% |
| MPV | Barings Participation | | Closed-End Fund - Debt | 20.31 | 100 | 0.30% | 18.70% |
| OPP | RiverNorth/DoubleLine Strategic | | Closed-End Fund - Debt | 8.61 | 20 | -0.23% | 10.38% |
| AGM.A | Federal Agricultural | | N/A | 95.40 | 20 | 0.00% | 0.00% |
| ISRLU | Israel Acquisitions | | SPAC | 12.47 | 43 | 0.00% | 10.26% |
| NRO | Neuberger Berman | | Closed-End Fund - Equity | 3.26 | 20 | 0.62% | 3.54% |
| NPV | Nuveen Virginia | | Closed-End Fund - Debt | 11.61 | 80 | 0.17% | -4.24% |
| SSSS | SuRo Capital | | Asset Mgmt | 9.27 | 100 | 6.19% | 63.03% |
| ETX | Eaton Vance | | Closed-End Fund - Debt | 19.35 | 100 | 1.31% | 13.06% |
| BIOS | BioPlus Acquisition | | SPAC | 1.07 | 0 | 0.00% | 0.00% |
| BLFY | Blue Foundry | | Banks - Regional | 9.31 | 60 | -0.11% | -1.79% |
| KED | Kayne Anderson | | Asset Mgmt | 395.17 | 70 | 0.80% | 0.00% |
| MHI | Pioneer Municipal | | Closed-End Fund - Debt | 8.95 | 60 | 0.56% | -2.41% |
| WHF | WhiteHorse Finance | | Asset Mgmt | 8.76 | 60 | -0.79% | -4.76% |
| BHR | Braemar Hotels | | REIT - Hotel & Motel | 2.97 | 80 | 0.00% | 2.56% |
| GRIF | Griffin Industrial | | Property Mgmt | 19.00 | 50 | 0.58% | 0.00% |
| NEN | New England | | Real Estate Services | 72.50 | 70 | 0.69% | -8.38% |
| For chart view version of above stock list: Chart View ➞ 0 - 25 , 25 - 50 , 50 - 75 , 75 - 100 , 100 - 125 , 125 - 150 , 150 - 175 , 175 - 200 , 200 - 225 , 225 - 250 , 250 - 275 , 275 - 300 , 300 - 325 , 325 - 350 , 350 - 375 , 375 - 400 , 400 - 425 , 425 - 450 , 450 - 475 , 475 - 500 , 500 - 525 , 525 - 550 , 550 - 575 , 575 - 600 , 600 - 625 , 625 - 650 , 650 - 675 , 675 - 700 , 700 - 725 , 725 - 750 , 750 - 775 , 775 - 800 , 800 - 825 , 825 - 850 , 850 - 875 , 875 - 900 , 900 - 925 , 925 - 950 , 950 - 975 , 975 - 1000 , 1000 - 1025 , 1025 - 1050 , 1050 - 1075 , 1075 - 1100 , 1100 - 1125 , 1125 - 1150 , 1150 - 1175 , 1175 - 1200 , 1200 - 1225 , 1225 - 1250 , 1250 - 1275 , 1275 - 1300 , 1300 - 1325 , 1325 - 1350 , 1350 - 1375 , 1375 - 1400 , 1400 - 1425 , 1425 - 1450 , 1450 - 1475 , 1475 - 1500 , 1500 - 1525 , 1525 - 1550 | ||
 | Click To Change The Sort Order: By Market Cap or Company Size Performance: Year-to-date, Week and Day |  |
|
Get the most comprehensive stock market coverage daily at 12Stocks.com ➞ Best Stocks Today ➞ Best Stocks Weekly ➞ Best Stocks Year-to-Date ➞ Best Stocks Trends ➞  Best Stocks Today 12Stocks.com Best Nasdaq Stocks ➞ Best S&P 500 Stocks ➞ Best Tech Stocks ➞ Best Biotech Stocks ➞ |
| Detailed Overview of Financial Stocks |
| Financial Technical Overview, Leaders & Laggards, Top Financial ETF Funds & Detailed Financial Stocks List, Charts, Trends & More |
| Financial Sector: Technical Analysis, Trends & YTD Performance | |
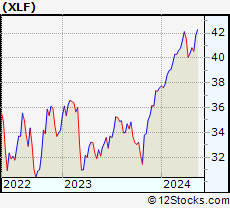
| Financial sector is composed of stocks
from banks, brokers, insurance, REITs
and services subsectors. Financial sector, as represented by XLF, an exchange-traded fund [ETF] that holds basket of Financial stocks (e.g, Bank of America, Goldman Sachs) is up by 12.9691% and is currently underperforming the overall market by -0.1777% year-to-date. Below is a quick view of Technical charts and trends: |
|
 XLF Weekly Chart |
|
| Long Term Trend: Good | |
| Medium Term Trend: Good | |
 XLF Daily Chart |
|
| Short Term Trend: Very Good | |
| Overall Trend Score: 90 | |
| YTD Performance: 12.9691% | |
| **Trend Scores & Views Are Only For Educational Purposes And Not For Investing | |
| 12Stocks.com: Top Performing Financial Sector Stocks | |||||||||||||||||||||||||||||||||||||||||||||||
 The top performing Financial sector stocks year to date are
Now, more recently, over last week, the top performing Financial sector stocks on the move are


|
|||||||||||||||||||||||||||||||||||||||||||||||
| 12Stocks.com: Investing in Financial Sector using Exchange Traded Funds | |
|
The following table shows list of key exchange traded funds (ETF) that
help investors track Financial Index. For detailed view, check out our ETF Funds section of our website. Quick View: Move mouse or cursor over ETF symbol (ticker) to view short-term Technical chart and over ETF name to view long term chart. Click on ticker or stock name for detailed view. Click on to add stock symbol to your watchlist and to view watchlist. |
12Stocks.com List of ETFs that track Financial Index
| Ticker | ETF Name | Watchlist | Recent Price | Smart Investing & Trading Score | Change % | Week % | Year-to-date % |
| CHIX | China Financials | | 10.57 | 20 | 0 | 0 | 0% |
| 12Stocks.com: Charts, Trends, Fundamental Data and Performances of Financial Stocks | |
|
We now take in-depth look at all Financial stocks including charts, multi-period performances and overall trends (as measured by Smart Investing & Trading Score). One can sort Financial stocks (click link to choose) by Daily, Weekly and by Year-to-Date performances. Also, one can sort by size of the company or by market capitalization. |
| Select Your Default Chart Type: | |||||
| |||||
| Click on stock symbol or name for detailed view. Click on to add stock symbol to your watchlist and to view watchlist. Quick View: Move mouse or cursor over "Daily" to quickly view daily Technical stock chart and over "Weekly" to view weekly Technical stock chart. | |||||

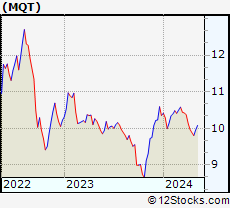 | MQT BlackRock MuniYield Quality Fund II Inc |
| Sector: Financials | |
| SubSector: Closed-End Fund - Debt | |
| MarketCap: 215.57 Millions | |
| Recent Price: 10.14 Smart Investing & Trading Score: 80 | |
| Day Percent Change: 0.197628% Day Change: -0.02 | |
| Week Change: 2.63158% Year-to-date Change: 5.1% | |
| MQT Links: Profile News Message Board | |
| Charts:- Daily , Weekly | |
| Add MQT to Watchlist: View: Get Complete MQT Trend Analysis ➞ | |
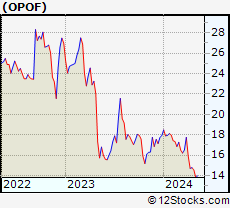 | OPOF Old Point Financial Corp |
| Sector: Financials | |
| SubSector: Banks - Regional | |
| MarketCap: 214.8 Millions | |
| Recent Price: 42.10 Smart Investing & Trading Score: 90 | |
| Day Percent Change: 2.28377% Day Change: -0.07 | |
| Week Change: 3.51611% Year-to-date Change: 63.9% | |
| OPOF Links: Profile News Message Board | |
| Charts:- Daily , Weekly | |
| Add OPOF to Watchlist: View: Get Complete OPOF Trend Analysis ➞ | |
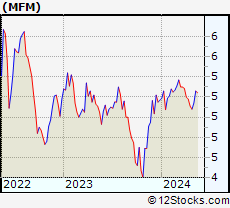 | MFM MFS Municipal Income Trust |
| Sector: Financials | |
| SubSector: Closed-End Fund - Debt | |
| MarketCap: 212.94 Millions | |
| Recent Price: 5.38 Smart Investing & Trading Score: 90 | |
| Day Percent Change: 0.938086% Day Change: -0.03 | |
| Week Change: 2.28137% Year-to-date Change: 3.0% | |
| MFM Links: Profile News Message Board | |
| Charts:- Daily , Weekly | |
| Add MFM to Watchlist: View: Get Complete MFM Trend Analysis ➞ | |
 | INBK First Internet Bancorp |
| Sector: Financials | |
| SubSector: Banks - Regional | |
| MarketCap: 212.86 Millions | |
| Recent Price: 24.10 Smart Investing & Trading Score: 20 | |
| Day Percent Change: 1.00587% Day Change: -0.2 | |
| Week Change: -0.124327% Year-to-date Change: -31.4% | |
| INBK Links: Profile News Message Board | |
| Charts:- Daily , Weekly | |
| Add INBK to Watchlist: View: Get Complete INBK Trend Analysis ➞ | |
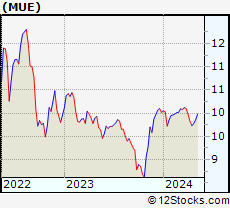 | MUE BlackRock MuniHoldings Quality Fund II Inc |
| Sector: Financials | |
| SubSector: Closed-End Fund - Debt | |
| MarketCap: 212.61 Millions | |
| Recent Price: 10.06 Smart Investing & Trading Score: 90 | |
| Day Percent Change: 0.399202% Day Change: -0.02 | |
| Week Change: 2.23577% Year-to-date Change: 3.1% | |
| MUE Links: Profile News Message Board | |
| Charts:- Daily , Weekly | |
| Add MUE to Watchlist: View: Get Complete MUE Trend Analysis ➞ | |
 | FCCO First Community Corp |
| Sector: Financials | |
| SubSector: Banks - Regional | |
| MarketCap: 212.36 Millions | |
| Recent Price: 28.41 Smart Investing & Trading Score: 100 | |
| Day Percent Change: 0.816182% Day Change: -0.09 | |
| Week Change: 1.68218% Year-to-date Change: 21.6% | |
| FCCO Links: Profile News Message Board | |
| Charts:- Daily , Weekly | |
| Add FCCO to Watchlist: View: Get Complete FCCO Trend Analysis ➞ | |
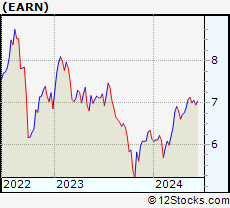 | EARN Ellington Credit Co |
| Sector: Financials | |
| SubSector: Asset Management | |
| MarketCap: 211.83 Millions | |
| Recent Price: 5.70 Smart Investing & Trading Score: 30 | |
| Day Percent Change: 0.529101% Day Change: 0.08 | |
| Week Change: 1.06383% Year-to-date Change: -6.1% | |
| EARN Links: Profile News Message Board | |
| Charts:- Daily , Weekly | |
| Add EARN to Watchlist: View: Get Complete EARN Trend Analysis ➞ | |
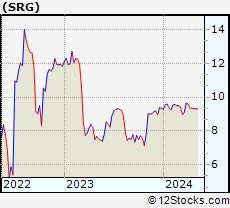 | SRG Seritage Growth Properties |
| Sector: Financials | |
| SubSector: Real Estate Services | |
| MarketCap: 210.65 Millions | |
| Recent Price: 4.10 Smart Investing & Trading Score: 60 | |
| Day Percent Change: 0.985222% Day Change: -0.01 | |
| Week Change: -8.48214% Year-to-date Change: -1.4% | |
| SRG Links: Profile News Message Board | |
| Charts:- Daily , Weekly | |
| Add SRG to Watchlist: View: Get Complete SRG Trend Analysis ➞ | |
 | HBMD Howard Bancorp, Inc. |
| Sector: Financials | |
| SubSector: Regional - Mid-Atlantic Banks | |
| MarketCap: 209.959 Millions | |
| Recent Price: 44.34 Smart Investing & Trading Score: 100 | |
| Day Percent Change: 0.0225581% Day Change: -9999 | |
| Week Change: 90.3004% Year-to-date Change: 0.0% | |
| HBMD Links: Profile News Message Board | |
| Charts:- Daily , Weekly | |
| Add HBMD to Watchlist: View: Get Complete HBMD Trend Analysis ➞ | |
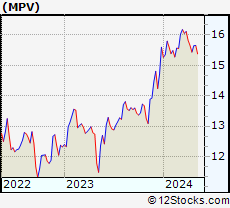 | MPV Barings Participation Investors |
| Sector: Financials | |
| SubSector: Closed-End Fund - Debt | |
| MarketCap: 208.94 Millions | |
| Recent Price: 20.31 Smart Investing & Trading Score: 100 | |
| Day Percent Change: 0.296296% Day Change: -0.12 | |
| Week Change: 5.01551% Year-to-date Change: 18.7% | |
| MPV Links: Profile News Message Board | |
| Charts:- Daily , Weekly | |
| Add MPV to Watchlist: View: Get Complete MPV Trend Analysis ➞ | |
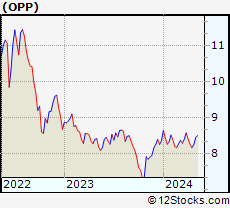 | OPP RiverNorth/DoubleLine Strategic opportunity fund Inc |
| Sector: Financials | |
| SubSector: Closed-End Fund - Debt | |
| MarketCap: 208.33 Millions | |
| Recent Price: 8.61 Smart Investing & Trading Score: 20 | |
| Day Percent Change: -0.23175% Day Change: -0.03 | |
| Week Change: -1.63934% Year-to-date Change: 10.4% | |
| OPP Links: Profile News Message Board | |
| Charts:- Daily , Weekly | |
| Add OPP to Watchlist: View: Get Complete OPP Trend Analysis ➞ | |
 | AGM.A Federal Agricultural Mtge A |
| Sector: Financials | |
| SubSector: N/A | |
| MarketCap: 208.327 Millions | |
| Recent Price: 95.40 Smart Investing & Trading Score: 20 | |
| Day Percent Change: 0% Day Change: -9999 | |
| Week Change: 2.58065% Year-to-date Change: 0.0% | |
| AGM.A Links: Profile News Message Board | |
| Charts:- Daily , Weekly | |
| Add AGM.A to Watchlist: View: Get Complete AGM.A Trend Analysis ➞ | |
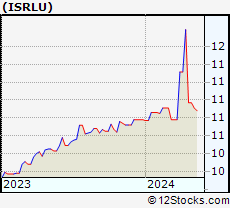 | ISRLU Israel Acquisitions Corp |
| Sector: Financials | |
| SubSector: SPAC | |
| MarketCap: 208 Millions | |
| Recent Price: 12.47 Smart Investing & Trading Score: 43 | |
| Day Percent Change: 0% Day Change: -9986.53 | |
| Week Change: -6.24% Year-to-date Change: 10.3% | |
| ISRLU Links: Profile News Message Board | |
| Charts:- Daily , Weekly | |
| Add ISRLU to Watchlist: View: Get Complete ISRLU Trend Analysis ➞ | |
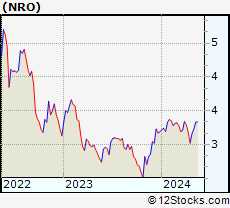 | NRO Neuberger Berman Real Estate Securities Income Fund Inc |
| Sector: Financials | |
| SubSector: Closed-End Fund - Equity | |
| MarketCap: 207.83 Millions | |
| Recent Price: 3.26 Smart Investing & Trading Score: 20 | |
| Day Percent Change: 0.617284% Day Change: -0.01 | |
| Week Change: -0.911854% Year-to-date Change: 3.5% | |
| NRO Links: Profile News Message Board | |
| Charts:- Daily , Weekly | |
| Add NRO to Watchlist: View: Get Complete NRO Trend Analysis ➞ | |
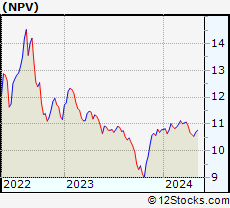 | NPV Nuveen Virginia Quality Municipal Income Fund |
| Sector: Financials | |
| SubSector: Closed-End Fund - Debt | |
| MarketCap: 207.45 Millions | |
| Recent Price: 11.61 Smart Investing & Trading Score: 80 | |
| Day Percent Change: 0.172563% Day Change: 0.02 | |
| Week Change: 0.78125% Year-to-date Change: -4.2% | |
| NPV Links: Profile News Message Board | |
| Charts:- Daily , Weekly | |
| Add NPV to Watchlist: View: Get Complete NPV Trend Analysis ➞ | |
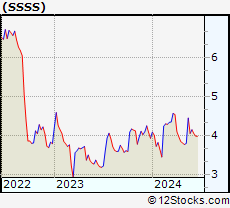 | SSSS SuRo Capital Corp |
| Sector: Financials | |
| SubSector: Asset Management | |
| MarketCap: 206.63 Millions | |
| Recent Price: 9.27 Smart Investing & Trading Score: 100 | |
| Day Percent Change: 6.18557% Day Change: 0.06 | |
| Week Change: 9.70414% Year-to-date Change: 63.0% | |
| SSSS Links: Profile News Message Board | |
| Charts:- Daily , Weekly | |
| Add SSSS to Watchlist: View: Get Complete SSSS Trend Analysis ➞ | |
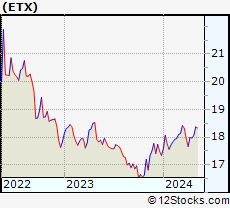 | ETX Eaton Vance Municipal Income 2028 Term Trust |
| Sector: Financials | |
| SubSector: Closed-End Fund - Debt | |
| MarketCap: 206.01 Millions | |
| Recent Price: 19.35 Smart Investing & Trading Score: 100 | |
| Day Percent Change: 1.3089% Day Change: 0.04 | |
| Week Change: 0.88634% Year-to-date Change: 13.1% | |
| ETX Links: Profile News Message Board | |
| Charts:- Daily , Weekly | |
| Add ETX to Watchlist: View: Get Complete ETX Trend Analysis ➞ | |
 | BIOS BioPlus Acquisition Corp. |
| Sector: Financials | |
| SubSector: SPAC | |
| MarketCap: 206 Millions | |
| Recent Price: 1.07 Smart Investing & Trading Score: 0 | |
| Day Percent Change: 0% Day Change: -9999 | |
| Week Change: -90.088% Year-to-date Change: 0.0% | |
| BIOS Links: Profile News Message Board | |
| Charts:- Daily , Weekly | |
| Add BIOS to Watchlist: View: Get Complete BIOS Trend Analysis ➞ | |
 | BLFY Blue Foundry Bancorp |
| Sector: Financials | |
| SubSector: Banks - Regional | |
| MarketCap: 204.21 Millions | |
| Recent Price: 9.31 Smart Investing & Trading Score: 60 | |
| Day Percent Change: -0.107296% Day Change: -0.09 | |
| Week Change: 0.648649% Year-to-date Change: -1.8% | |
| BLFY Links: Profile News Message Board | |
| Charts:- Daily , Weekly | |
| Add BLFY to Watchlist: View: Get Complete BLFY Trend Analysis ➞ | |
 | KED Kayne Anderson Energy Development Company |
| Sector: Financials | |
| SubSector: Asset Management | |
| MarketCap: 203.97 Millions | |
| Recent Price: 395.17 Smart Investing & Trading Score: 70 | |
| Day Percent Change: 0.795817% Day Change: -9999 | |
| Week Change: 1734.59% Year-to-date Change: 0.0% | |
| KED Links: Profile News Message Board | |
| Charts:- Daily , Weekly | |
| Add KED to Watchlist: View: Get Complete KED Trend Analysis ➞ | |
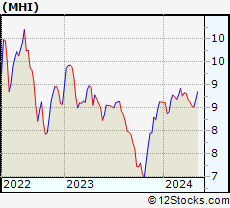 | MHI Pioneer Municipal High Income Fund Inc |
| Sector: Financials | |
| SubSector: Closed-End Fund - Debt | |
| MarketCap: 203.69 Millions | |
| Recent Price: 8.95 Smart Investing & Trading Score: 60 | |
| Day Percent Change: 0.561798% Day Change: 0.01 | |
| Week Change: 0.561798% Year-to-date Change: -2.4% | |
| MHI Links: Profile News Message Board | |
| Charts:- Daily , Weekly | |
| Add MHI to Watchlist: View: Get Complete MHI Trend Analysis ➞ | |
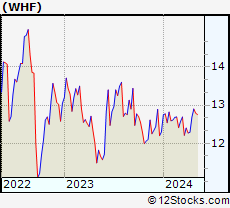 | WHF WhiteHorse Finance Inc |
| Sector: Financials | |
| SubSector: Asset Management | |
| MarketCap: 203.61 Millions | |
| Recent Price: 8.76 Smart Investing & Trading Score: 60 | |
| Day Percent Change: -0.792752% Day Change: 0.04 | |
| Week Change: 0.343643% Year-to-date Change: -4.8% | |
| WHF Links: Profile News Message Board | |
| Charts:- Daily , Weekly | |
| Add WHF to Watchlist: View: Get Complete WHF Trend Analysis ➞ | |
 | BHR Braemar Hotels & Resorts Inc |
| Sector: Financials | |
| SubSector: REIT - Hotel & Motel | |
| MarketCap: 203.29 Millions | |
| Recent Price: 2.97 Smart Investing & Trading Score: 80 | |
| Day Percent Change: 0% Day Change: -0.03 | |
| Week Change: 2.06186% Year-to-date Change: 2.6% | |
| BHR Links: Profile News Message Board | |
| Charts:- Daily , Weekly | |
| Add BHR to Watchlist: View: Get Complete BHR Trend Analysis ➞ | |
 | GRIF Griffin Industrial Realty, Inc. |
| Sector: Financials | |
| SubSector: Property Management | |
| MarketCap: 202.042 Millions | |
| Recent Price: 19.00 Smart Investing & Trading Score: 50 | |
| Day Percent Change: 0.582319% Day Change: -9999 | |
| Week Change: 705.085% Year-to-date Change: 0.0% | |
| GRIF Links: Profile News Message Board | |
| Charts:- Daily , Weekly | |
| Add GRIF to Watchlist: View: Get Complete GRIF Trend Analysis ➞ | |
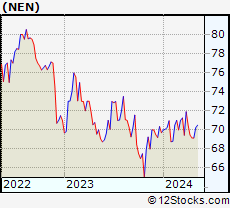 | NEN New England Realty Associates LP |
| Sector: Financials | |
| SubSector: Real Estate Services | |
| MarketCap: 201.6 Millions | |
| Recent Price: 72.50 Smart Investing & Trading Score: 70 | |
| Day Percent Change: 0.694444% Day Change: -9927.94 | |
| Week Change: 2.02646% Year-to-date Change: -8.4% | |
| NEN Links: Profile News Message Board | |
| Charts:- Daily , Weekly | |
| Add NEN to Watchlist: View: Get Complete NEN Trend Analysis ➞ | |
| For tabular summary view of above stock list: Summary View ➞ 0 - 25 , 25 - 50 , 50 - 75 , 75 - 100 , 100 - 125 , 125 - 150 , 150 - 175 , 175 - 200 , 200 - 225 , 225 - 250 , 250 - 275 , 275 - 300 , 300 - 325 , 325 - 350 , 350 - 375 , 375 - 400 , 400 - 425 , 425 - 450 , 450 - 475 , 475 - 500 , 500 - 525 , 525 - 550 , 550 - 575 , 575 - 600 , 600 - 625 , 625 - 650 , 650 - 675 , 675 - 700 , 700 - 725 , 725 - 750 , 750 - 775 , 775 - 800 , 800 - 825 , 825 - 850 , 850 - 875 , 875 - 900 , 900 - 925 , 925 - 950 , 950 - 975 , 975 - 1000 , 1000 - 1025 , 1025 - 1050 , 1050 - 1075 , 1075 - 1100 , 1100 - 1125 , 1125 - 1150 , 1150 - 1175 , 1175 - 1200 , 1200 - 1225 , 1225 - 1250 , 1250 - 1275 , 1275 - 1300 , 1300 - 1325 , 1325 - 1350 , 1350 - 1375 , 1375 - 1400 , 1400 - 1425 , 1425 - 1450 , 1450 - 1475 , 1475 - 1500 , 1500 - 1525 , 1525 - 1550 | ||
| Click To Change The Sort Order: By Market Cap or Company Size Performance: Year-to-date, Week and Day | |
| Select Chart Type: | ||
|
Best Stocks Today 12Stocks.com |
© 2025 12Stocks.com Terms & Conditions Privacy Contact Us
All Information Provided Only For Education And Not To Be Used For Investing or Trading. See Terms & Conditions


One More Thing ... Get Best Stocks Delivered Daily!
Never Ever Miss A Move With Our Top Ten Stocks Lists
Find Best Stocks In Any Market - Bull or Bear Market
Take A Peek At Our Top Ten Stocks Lists: Daily, Weekly, Year-to-Date & Top Trends
Find Best Stocks In Any Market - Bull or Bear Market
Take A Peek At Our Top Ten Stocks Lists: Daily, Weekly, Year-to-Date & Top Trends
Financial Stocks With Best Up Trends [0-bearish to 100-bullish]: PIMCO California[100], Torchmark [100], B. Riley[100], PIMCO California[100], Better Home[100], Triumph Bancorp[100], Cipher Mining[100], PIMCO Municipal[100], PIMCO Municipal[100], SuRo Capital[100], Front Yard[100]
Best Financial Stocks Year-to-Date:
Insight Select[12384.6%], Oxford Lane[292.029%], Better Home[209.081%], Robinhood Markets[200.811%], Metalpha Technology[196.46%], Cipher Mining[156.315%], Mr. Cooper[135%], LoanDepot [133.846%], Banco Santander[129.354%], Deutsche Bank[117.764%], IHS Holding[117.61%] Best Financial Stocks This Week:
Colony Starwood[15929900%], Blackhawk Network[91300%], Macquarie Global[81662.9%], Credit Suisse[63241.6%], Pennsylvania Real[23823%], First Republic[22570.9%], Select ome[14000%], CorEnergy Infrastructure[6797.78%], FedNat Holding[5525%], BlackRock Municipal[5340%], BlackRock MuniYield[3379.04%] Best Financial Stocks Daily:
Offerpad [12.3487%], PIMCO California[11.9545%], Torchmark [11.8363%], B. Riley[11.5556%], PIMCO California[11.4754%], BlackRock Muni[10.8108%], Blackrock MuniYield[10.72%], Better Home[10.5675%], Triumph Bancorp[10.2661%], BlackRock MuniYield[8.15348%], Summit [7.79817%]