
 Login Sign Up


| |||||
 |  | ||||

| 12Stocks.com Market Intelligence |
Best Financial Stocks
| In a hurry? Financial Stocks Lists: Performance Trends Table, Stock Charts
Sort Financial stocks: Daily, Weekly, Year-to-Date, Market Cap & Trends. Filter Financial stocks list by size:All Financial Large Mid-Range Small & MicroCap |
| 12Stocks.com Financial Stocks Performances & Trends Daily | |||||||||
|
|  The overall Smart Investing & Trading Score is 90 (0-bearish to 100-bullish) which puts Financial sector in short term bullish trend. The Smart Investing & Trading Score from previous trading session is 60 and hence an improvement of trend.
| ||||||||
Here are the Smart Investing & Trading Scores of the most requested Financial stocks at 12Stocks.com (click stock name for detailed review):
|


| 12Stocks.com: Investing in Financial sector with Stocks | |
|
The following table helps investors and traders sort through current performance and trends (as measured by Smart Investing & Trading Score) of various
stocks in the Financial sector. Quick View: Move mouse or cursor over stock symbol (ticker) to view short-term Technical chart and over stock name to view long term chart. Click on  to add stock symbol to your watchlist and to add stock symbol to your watchlist and  to view watchlist. Click on any ticker or stock name for detailed market intelligence report for that stock. to view watchlist. Click on any ticker or stock name for detailed market intelligence report for that stock. |
12Stocks.com Performance of Stocks in Financial Sector
| Ticker | Stock Name | Watchlist | Category | Recent Price | Trend Score | Change % | YTD Change% |
| OZ | Belpointe PREP |   | Real Estate - Development | 64.26 | 73 | 0.61% | -19.90% |
| LMRK | Landmark Infrastructure | | Property Mgmt | 12.61 | 10 | 0.24% | 0.00% |
| MFIN | Medallion | | Credit Services | 10.33 | 20 | -0.96% | 15.30% |
| BLMT | BSB Bancorp | | Banks | 64.69 | 60 | -1.37% | 0.00% |
| NWFL | Norwood | | Banks - Regional | 26.31 | 20 | -0.23% | 2.92% |
| OVLY | Oak Valley | | Banks - Regional | 27.87 | 30 | -0.96% | 3.58% |
| FUND | Sprott Focus | | Closed-End Fund - Equity | 8.21 | 30 | -1.44% | 15.80% |
| MITT | AG Mortgage | | REIT - Mortgage | 7.75 | 60 | -0.26% | 22.25% |
| NUO | Nuveen Ohio | | Asset Mgmt | 60.98 | 70 | 0.03% | 0.00% |
| NUM | Nuveen Michigan | | Asset Mgmt | 60.69 | 10 | -0.93% | 0.00% |
| PSF | Cohen & Steers Select Preferred and ome Fund | | Closed-End Fund - Debt | 20.96 | 100 | 0.58% | 10.46% |
| EOD | Allspring Global | | Closed-End Fund - Equity | 5.61 | 20 | -1.06% | 16.63% |
| PHT | Pioneer High | | Closed-End Fund - Debt | 8.34 | 80 | 0.00% | 11.61% |
| NXQ | Nuveen Select | | Closed-End Fund - Debt | 15.59 | 80 | 3.66% | 0.00% |
| WMC | Western Asset | | Mortgage | 9.18 | 90 | 4.44% | 0.00% |
| ACV | Virtus Diversified | | Closed-End Fund - Equity | 24.05 | 90 | 0.00% | 16.78% |
| GLO | Clough Global | | Closed-End Fund - Equity | 5.64 | 50 | -0.53% | 18.65% |
| FUNC | First United | | Banks - Regional | 36.52 | 50 | 1.07% | 11.61% |
| HTBI | HomeTrust Bancshares | | Regional Banks | 36.55 | 0 | -1.75% | 10.62% |
| AOMR | Angel Oak | | REIT - Mortgage | 9.73 | 40 | 0.52% | 11.48% |
| TSI | TCW Strategic | | Closed-End Fund - Debt | 5.00 | 80 | 0.10% | 6.42% |
| JRS | Nuveen Real | | Closed-End Fund - Debt | 8.17 | 50 | -0.24% | -3.77% |
| FRGE | Forge Global | | Capital Markets | 16.03 | 10 | 1.84% | 13.09% |
| BNY | BlackRock New | | Closed-End Fund - Debt | 10.19 | 90 | 0.39% | 2.65% |
| PCK | PIMCO California | | Closed-End Fund - Debt | 5.90 | 100 | 11.95% | 5.51% |
| For chart view version of above stock list: Chart View ➞ 0 - 25 , 25 - 50 , 50 - 75 , 75 - 100 , 100 - 125 , 125 - 150 , 150 - 175 , 175 - 200 , 200 - 225 , 225 - 250 , 250 - 275 , 275 - 300 , 300 - 325 , 325 - 350 , 350 - 375 , 375 - 400 , 400 - 425 , 425 - 450 , 450 - 475 , 475 - 500 , 500 - 525 , 525 - 550 , 550 - 575 , 575 - 600 , 600 - 625 , 625 - 650 , 650 - 675 , 675 - 700 , 700 - 725 , 725 - 750 , 750 - 775 , 775 - 800 , 800 - 825 , 825 - 850 , 850 - 875 , 875 - 900 , 900 - 925 , 925 - 950 , 950 - 975 , 975 - 1000 , 1000 - 1025 , 1025 - 1050 , 1050 - 1075 , 1075 - 1100 , 1100 - 1125 , 1125 - 1150 , 1150 - 1175 , 1175 - 1200 , 1200 - 1225 , 1225 - 1250 , 1250 - 1275 , 1275 - 1300 , 1300 - 1325 , 1325 - 1350 , 1350 - 1375 , 1375 - 1400 , 1400 - 1425 , 1425 - 1450 , 1450 - 1475 , 1475 - 1500 , 1500 - 1525 , 1525 - 1550 | ||
 | Click To Change The Sort Order: By Market Cap or Company Size Performance: Year-to-date, Week and Day |  |
|
Get the most comprehensive stock market coverage daily at 12Stocks.com ➞ Best Stocks Today ➞ Best Stocks Weekly ➞ Best Stocks Year-to-Date ➞ Best Stocks Trends ➞  Best Stocks Today 12Stocks.com Best Nasdaq Stocks ➞ Best S&P 500 Stocks ➞ Best Tech Stocks ➞ Best Biotech Stocks ➞ |
| Detailed Overview of Financial Stocks |
| Financial Technical Overview, Leaders & Laggards, Top Financial ETF Funds & Detailed Financial Stocks List, Charts, Trends & More |
| Financial Sector: Technical Analysis, Trends & YTD Performance | |
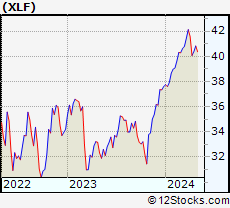
| Financial sector is composed of stocks
from banks, brokers, insurance, REITs
and services subsectors. Financial sector, as represented by XLF, an exchange-traded fund [ETF] that holds basket of Financial stocks (e.g, Bank of America, Goldman Sachs) is up by 12.9691% and is currently underperforming the overall market by -0.1777% year-to-date. Below is a quick view of Technical charts and trends: |
|
 XLF Weekly Chart |
|
| Long Term Trend: Good | |
| Medium Term Trend: Good | |
 XLF Daily Chart |
|
| Short Term Trend: Very Good | |
| Overall Trend Score: 90 | |
| YTD Performance: 12.9691% | |
| **Trend Scores & Views Are Only For Educational Purposes And Not For Investing | |
| 12Stocks.com: Top Performing Financial Sector Stocks | |||||||||||||||||||||||||||||||||||||||||||||||
 The top performing Financial sector stocks year to date are
Now, more recently, over last week, the top performing Financial sector stocks on the move are


|
|||||||||||||||||||||||||||||||||||||||||||||||
| 12Stocks.com: Investing in Financial Sector using Exchange Traded Funds | |
|
The following table shows list of key exchange traded funds (ETF) that
help investors track Financial Index. For detailed view, check out our ETF Funds section of our website. Quick View: Move mouse or cursor over ETF symbol (ticker) to view short-term Technical chart and over ETF name to view long term chart. Click on ticker or stock name for detailed view. Click on to add stock symbol to your watchlist and to view watchlist. |
12Stocks.com List of ETFs that track Financial Index
| Ticker | ETF Name | Watchlist | Recent Price | Smart Investing & Trading Score | Change % | Week % | Year-to-date % |
| CHIX | China Financials | | 10.57 | 20 | 0 | 0 | 0% |
| 12Stocks.com: Charts, Trends, Fundamental Data and Performances of Financial Stocks | |
|
We now take in-depth look at all Financial stocks including charts, multi-period performances and overall trends (as measured by Smart Investing & Trading Score). One can sort Financial stocks (click link to choose) by Daily, Weekly and by Year-to-Date performances. Also, one can sort by size of the company or by market capitalization. |
| Select Your Default Chart Type: | |||||
| |||||
| Click on stock symbol or name for detailed view. Click on to add stock symbol to your watchlist and to view watchlist. Quick View: Move mouse or cursor over "Daily" to quickly view daily Technical stock chart and over "Weekly" to view weekly Technical stock chart. | |||||

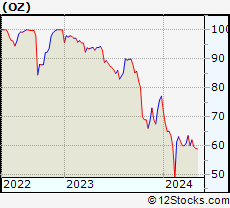 | OZ Belpointe PREP LLC |
| Sector: Financials | |
| SubSector: Real Estate - Development | |
| MarketCap: 249.14 Millions | |
| Recent Price: 64.26 Smart Investing & Trading Score: 73 | |
| Day Percent Change: 0.61% Day Change: 0.38 | |
| Week Change: 2.05% Year-to-date Change: -19.9% | |
| OZ Links: Profile News Message Board | |
| Charts:- Daily , Weekly | |
| Add OZ to Watchlist: View: Get Complete OZ Trend Analysis ➞ | |
 | LMRK Landmark Infrastructure Partners LP |
| Sector: Financials | |
| SubSector: Property Management | |
| MarketCap: 249.042 Millions | |
| Recent Price: 12.61 Smart Investing & Trading Score: 10 | |
| Day Percent Change: 0.238474% Day Change: -9999 | |
| Week Change: -23.5294% Year-to-date Change: 0.0% | |
| LMRK Links: Profile News Message Board | |
| Charts:- Daily , Weekly | |
| Add LMRK to Watchlist: View: Get Complete LMRK Trend Analysis ➞ | |
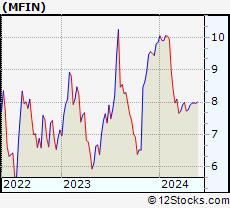 | MFIN Medallion Financial Corp |
| Sector: Financials | |
| SubSector: Credit Services | |
| MarketCap: 248.97 Millions | |
| Recent Price: 10.33 Smart Investing & Trading Score: 20 | |
| Day Percent Change: -0.958773% Day Change: -0.06 | |
| Week Change: -3.54809% Year-to-date Change: 15.3% | |
| MFIN Links: Profile News Message Board | |
| Charts:- Daily , Weekly | |
| Add MFIN to Watchlist: View: Get Complete MFIN Trend Analysis ➞ | |
 | BLMT BSB Bancorp, Inc. (Massachusetts) |
| Sector: Financials | |
| SubSector: Money Center Banks | |
| MarketCap: 248.78 Millions | |
| Recent Price: 64.69 Smart Investing & Trading Score: 60 | |
| Day Percent Change: -1.37216% Day Change: -9999 | |
| Week Change: 335.623% Year-to-date Change: 0.0% | |
| BLMT Links: Profile News Message Board | |
| Charts:- Daily , Weekly | |
| Add BLMT to Watchlist: View: Get Complete BLMT Trend Analysis ➞ | |
 | NWFL Norwood Financial Corp |
| Sector: Financials | |
| SubSector: Banks - Regional | |
| MarketCap: 248.21 Millions | |
| Recent Price: 26.31 Smart Investing & Trading Score: 20 | |
| Day Percent Change: -0.227531% Day Change: -0.12 | |
| Week Change: -1.23874% Year-to-date Change: 2.9% | |
| NWFL Links: Profile News Message Board | |
| Charts:- Daily , Weekly | |
| Add NWFL to Watchlist: View: Get Complete NWFL Trend Analysis ➞ | |
 | OVLY Oak Valley Bancorp |
| Sector: Financials | |
| SubSector: Banks - Regional | |
| MarketCap: 247.44 Millions | |
| Recent Price: 27.87 Smart Investing & Trading Score: 30 | |
| Day Percent Change: -0.959488% Day Change: -0.29 | |
| Week Change: -3.89655% Year-to-date Change: 3.6% | |
| OVLY Links: Profile News Message Board | |
| Charts:- Daily , Weekly | |
| Add OVLY to Watchlist: View: Get Complete OVLY Trend Analysis ➞ | |
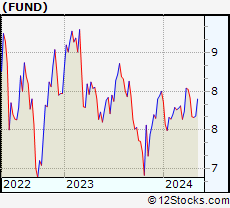 | FUND Sprott Focus Trust Inc |
| Sector: Financials | |
| SubSector: Closed-End Fund - Equity | |
| MarketCap: 246.92 Millions | |
| Recent Price: 8.21 Smart Investing & Trading Score: 30 | |
| Day Percent Change: -1.44058% Day Change: 0.01 | |
| Week Change: 0.366748% Year-to-date Change: 15.8% | |
| FUND Links: Profile News Message Board | |
| Charts:- Daily , Weekly | |
| Add FUND to Watchlist: View: Get Complete FUND Trend Analysis ➞ | |
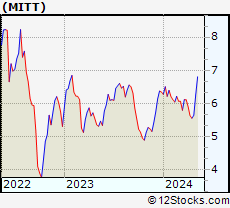 | MITT AG Mortgage Investment Trust Inc |
| Sector: Financials | |
| SubSector: REIT - Mortgage | |
| MarketCap: 246.88 Millions | |
| Recent Price: 7.75 Smart Investing & Trading Score: 60 | |
| Day Percent Change: -0.2574% Day Change: -0.12 | |
| Week Change: 0% Year-to-date Change: 22.3% | |
| MITT Links: Profile News Message Board | |
| Charts:- Daily , Weekly | |
| Add MITT to Watchlist: View: Get Complete MITT Trend Analysis ➞ | |
 | NUO Nuveen Ohio Quality Municipal Income Fund |
| Sector: Financials | |
| SubSector: Asset Management | |
| MarketCap: 246.503 Millions | |
| Recent Price: 60.98 Smart Investing & Trading Score: 70 | |
| Day Percent Change: 0.0328084% Day Change: -9999 | |
| Week Change: 381.675% Year-to-date Change: 0.0% | |
| NUO Links: Profile News Message Board | |
| Charts:- Daily , Weekly | |
| Add NUO to Watchlist: View: Get Complete NUO Trend Analysis ➞ | |
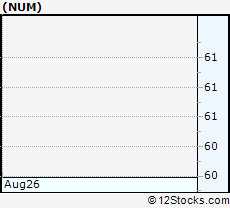 | NUM Nuveen Michigan Quality Municipal Income Fund |
| Sector: Financials | |
| SubSector: Asset Management | |
| MarketCap: 246.103 Millions | |
| Recent Price: 60.69 Smart Investing & Trading Score: 10 | |
| Day Percent Change: -0.93046% Day Change: -9999 | |
| Week Change: -63.1646% Year-to-date Change: 0.0% | |
| NUM Links: Profile News Message Board | |
| Charts:- Daily , Weekly | |
| Add NUM to Watchlist: View: Get Complete NUM Trend Analysis ➞ | |
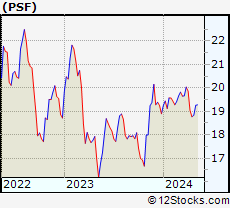 | PSF Cohen & Steers Select Preferred and Income Fund Inc |
| Sector: Financials | |
| SubSector: Closed-End Fund - Debt | |
| MarketCap: 246.1 Millions | |
| Recent Price: 20.96 Smart Investing & Trading Score: 100 | |
| Day Percent Change: 0.576296% Day Change: -0.09 | |
| Week Change: 2.43427% Year-to-date Change: 10.5% | |
| PSF Links: Profile News Message Board | |
| Charts:- Daily , Weekly | |
| Add PSF to Watchlist: View: Get Complete PSF Trend Analysis ➞ | |
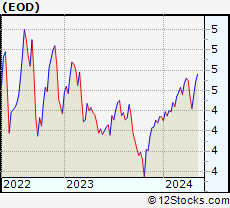 | EOD Allspring Global Dividend Opportunity Fund |
| Sector: Financials | |
| SubSector: Closed-End Fund - Equity | |
| MarketCap: 245.91 Millions | |
| Recent Price: 5.61 Smart Investing & Trading Score: 20 | |
| Day Percent Change: -1.0582% Day Change: -0.03 | |
| Week Change: -2.09424% Year-to-date Change: 16.6% | |
| EOD Links: Profile News Message Board | |
| Charts:- Daily , Weekly | |
| Add EOD to Watchlist: View: Get Complete EOD Trend Analysis ➞ | |
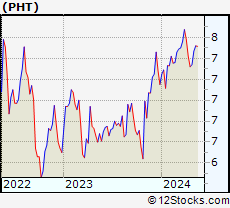 | PHT Pioneer High Income Fund Inc |
| Sector: Financials | |
| SubSector: Closed-End Fund - Debt | |
| MarketCap: 244.12 Millions | |
| Recent Price: 8.34 Smart Investing & Trading Score: 80 | |
| Day Percent Change: 0% Day Change: 0.04 | |
| Week Change: -0.239234% Year-to-date Change: 11.6% | |
| PHT Links: Profile News Message Board | |
| Charts:- Daily , Weekly | |
| Add PHT to Watchlist: View: Get Complete PHT Trend Analysis ➞ | |
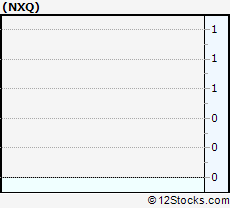 | NXQ Nuveen Select Tax-Free Income Portfolio 2 |
| Sector: Financials | |
| SubSector: Closed-End Fund - Debt | |
| MarketCap: 243.707 Millions | |
| Recent Price: 15.59 Smart Investing & Trading Score: 80 | |
| Day Percent Change: 3.65691% Day Change: -9999 | |
| Week Change: 2.12772% Year-to-date Change: 0.0% | |
| NXQ Links: Profile News Message Board | |
| Charts:- Daily , Weekly | |
| Add NXQ to Watchlist: View: Get Complete NXQ Trend Analysis ➞ | |
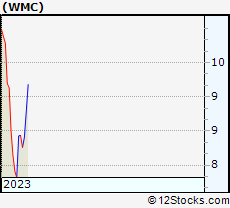 | WMC Western Asset Mortgage Capital Corporation |
| Sector: Financials | |
| SubSector: Mortgage Investment | |
| MarketCap: 243.339 Millions | |
| Recent Price: 9.18 Smart Investing & Trading Score: 90 | |
| Day Percent Change: 4.43686% Day Change: -9999 | |
| Week Change: 11.1555% Year-to-date Change: 0.0% | |
| WMC Links: Profile News Message Board | |
| Charts:- Daily , Weekly | |
| Add WMC to Watchlist: View: Get Complete WMC Trend Analysis ➞ | |
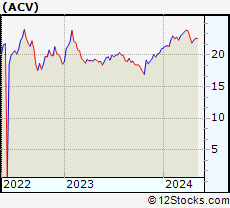 | ACV Virtus Diversified Income & Convertible Fund |
| Sector: Financials | |
| SubSector: Closed-End Fund - Equity | |
| MarketCap: 243.17 Millions | |
| Recent Price: 24.05 Smart Investing & Trading Score: 90 | |
| Day Percent Change: 0% Day Change: -0.13 | |
| Week Change: 1.7774% Year-to-date Change: 16.8% | |
| ACV Links: Profile News Message Board | |
| Charts:- Daily , Weekly | |
| Add ACV to Watchlist: View: Get Complete ACV Trend Analysis ➞ | |
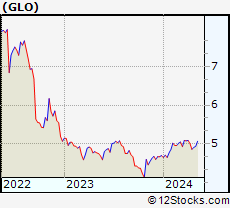 | GLO Clough Global Opportunities Fund |
| Sector: Financials | |
| SubSector: Closed-End Fund - Equity | |
| MarketCap: 240.35 Millions | |
| Recent Price: 5.64 Smart Investing & Trading Score: 50 | |
| Day Percent Change: -0.529101% Day Change: -0.01 | |
| Week Change: -0.353357% Year-to-date Change: 18.6% | |
| GLO Links: Profile News Message Board | |
| Charts:- Daily , Weekly | |
| Add GLO to Watchlist: View: Get Complete GLO Trend Analysis ➞ | |
 | FUNC First United Corp |
| Sector: Financials | |
| SubSector: Banks - Regional | |
| MarketCap: 239.91 Millions | |
| Recent Price: 36.52 Smart Investing & Trading Score: 50 | |
| Day Percent Change: 1.0653% Day Change: -0.25 | |
| Week Change: -0.962581% Year-to-date Change: 11.6% | |
| FUNC Links: Profile News Message Board | |
| Charts:- Daily , Weekly | |
| Add FUNC to Watchlist: View: Get Complete FUNC Trend Analysis ➞ | |
 | HTBI HomeTrust Bancshares, Inc. |
| Sector: Financials | |
| SubSector: Regional - Northeast Banks | |
| MarketCap: 238.899 Millions | |
| Recent Price: 36.55 Smart Investing & Trading Score: 0 | |
| Day Percent Change: -1.74731% Day Change: -9999 | |
| Week Change: -0.921659% Year-to-date Change: 10.6% | |
| HTBI Links: Profile News Message Board | |
| Charts:- Daily , Weekly | |
| Add HTBI to Watchlist: View: Get Complete HTBI Trend Analysis ➞ | |
 | AOMR Angel Oak Mortgage REIT Inc |
| Sector: Financials | |
| SubSector: REIT - Mortgage | |
| MarketCap: 238.84 Millions | |
| Recent Price: 9.73 Smart Investing & Trading Score: 40 | |
| Day Percent Change: 0.516529% Day Change: -0.08 | |
| Week Change: -0.815494% Year-to-date Change: 11.5% | |
| AOMR Links: Profile News Message Board | |
| Charts:- Daily , Weekly | |
| Add AOMR to Watchlist: View: Get Complete AOMR Trend Analysis ➞ | |
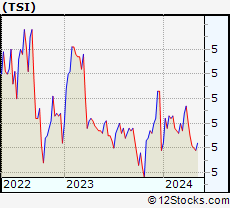 | TSI TCW Strategic Income Fund Inc |
| Sector: Financials | |
| SubSector: Closed-End Fund - Debt | |
| MarketCap: 237.97 Millions | |
| Recent Price: 5.00 Smart Investing & Trading Score: 80 | |
| Day Percent Change: 0.1002% Day Change: -0.01 | |
| Week Change: 0.200602% Year-to-date Change: 6.4% | |
| TSI Links: Profile News Message Board | |
| Charts:- Daily , Weekly | |
| Add TSI to Watchlist: View: Get Complete TSI Trend Analysis ➞ | |
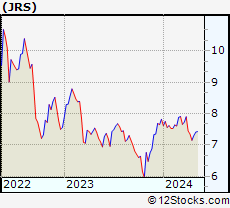 | JRS Nuveen Real Estate Income Fund |
| Sector: Financials | |
| SubSector: Closed-End Fund - Debt | |
| MarketCap: 236.34 Millions | |
| Recent Price: 8.17 Smart Investing & Trading Score: 50 | |
| Day Percent Change: -0.2442% Day Change: -0.04 | |
| Week Change: 1.87032% Year-to-date Change: -3.8% | |
| JRS Links: Profile News Message Board | |
| Charts:- Daily , Weekly | |
| Add JRS to Watchlist: View: Get Complete JRS Trend Analysis ➞ | |
 | FRGE Forge Global Holdings Inc |
| Sector: Financials | |
| SubSector: Capital Markets | |
| MarketCap: 235.58 Millions | |
| Recent Price: 16.03 Smart Investing & Trading Score: 10 | |
| Day Percent Change: 1.84244% Day Change: -0.56 | |
| Week Change: -10.3468% Year-to-date Change: 13.1% | |
| FRGE Links: Profile News Message Board | |
| Charts:- Daily , Weekly | |
| Add FRGE to Watchlist: View: Get Complete FRGE Trend Analysis ➞ | |
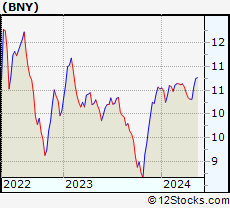 | BNY BlackRock New York Municipal Income Trust |
| Sector: Financials | |
| SubSector: Closed-End Fund - Debt | |
| MarketCap: 234.66 Millions | |
| Recent Price: 10.19 Smart Investing & Trading Score: 90 | |
| Day Percent Change: 0.394089% Day Change: 0.01 | |
| Week Change: 2.82543% Year-to-date Change: 2.6% | |
| BNY Links: Profile News Message Board | |
| Charts:- Daily , Weekly | |
| Add BNY to Watchlist: View: Get Complete BNY Trend Analysis ➞ | |
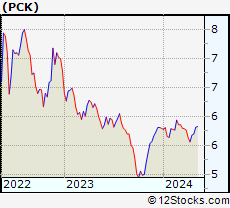 | PCK PIMCO California Municipal Income Fund II |
| Sector: Financials | |
| SubSector: Closed-End Fund - Debt | |
| MarketCap: 231.307 Millions | |
| Recent Price: 5.90 Smart Investing & Trading Score: 100 | |
| Day Percent Change: 11.9545% Day Change: -9999 | |
| Week Change: 12.5954% Year-to-date Change: 5.5% | |
| PCK Links: Profile News Message Board | |
| Charts:- Daily , Weekly | |
| Add PCK to Watchlist: View: Get Complete PCK Trend Analysis ➞ | |
| For tabular summary view of above stock list: Summary View ➞ 0 - 25 , 25 - 50 , 50 - 75 , 75 - 100 , 100 - 125 , 125 - 150 , 150 - 175 , 175 - 200 , 200 - 225 , 225 - 250 , 250 - 275 , 275 - 300 , 300 - 325 , 325 - 350 , 350 - 375 , 375 - 400 , 400 - 425 , 425 - 450 , 450 - 475 , 475 - 500 , 500 - 525 , 525 - 550 , 550 - 575 , 575 - 600 , 600 - 625 , 625 - 650 , 650 - 675 , 675 - 700 , 700 - 725 , 725 - 750 , 750 - 775 , 775 - 800 , 800 - 825 , 825 - 850 , 850 - 875 , 875 - 900 , 900 - 925 , 925 - 950 , 950 - 975 , 975 - 1000 , 1000 - 1025 , 1025 - 1050 , 1050 - 1075 , 1075 - 1100 , 1100 - 1125 , 1125 - 1150 , 1150 - 1175 , 1175 - 1200 , 1200 - 1225 , 1225 - 1250 , 1250 - 1275 , 1275 - 1300 , 1300 - 1325 , 1325 - 1350 , 1350 - 1375 , 1375 - 1400 , 1400 - 1425 , 1425 - 1450 , 1450 - 1475 , 1475 - 1500 , 1500 - 1525 , 1525 - 1550 | ||
| Click To Change The Sort Order: By Market Cap or Company Size Performance: Year-to-date, Week and Day | |
| Select Chart Type: | ||
|
Best Stocks Today 12Stocks.com |
© 2025 12Stocks.com Terms & Conditions Privacy Contact Us
All Information Provided Only For Education And Not To Be Used For Investing or Trading. See Terms & Conditions


One More Thing ... Get Best Stocks Delivered Daily!
Never Ever Miss A Move With Our Top Ten Stocks Lists
Find Best Stocks In Any Market - Bull or Bear Market
Take A Peek At Our Top Ten Stocks Lists: Daily, Weekly, Year-to-Date & Top Trends
Find Best Stocks In Any Market - Bull or Bear Market
Take A Peek At Our Top Ten Stocks Lists: Daily, Weekly, Year-to-Date & Top Trends
Financial Stocks With Best Up Trends [0-bearish to 100-bullish]: PIMCO California[100], Torchmark [100], B. Riley[100], PIMCO California[100], Better Home[100], Triumph Bancorp[100], Cipher Mining[100], PIMCO Municipal[100], PIMCO Municipal[100], SuRo Capital[100], Front Yard[100]
Best Financial Stocks Year-to-Date:
Insight Select[12384.6%], Oxford Lane[292.029%], Better Home[209.081%], Robinhood Markets[200.811%], Metalpha Technology[196.46%], Cipher Mining[156.315%], Mr. Cooper[135%], LoanDepot [133.846%], Banco Santander[129.354%], Deutsche Bank[117.764%], IHS Holding[117.61%] Best Financial Stocks This Week:
Colony Starwood[15929900%], Blackhawk Network[91300%], Macquarie Global[81662.9%], Credit Suisse[63241.6%], Pennsylvania Real[23823%], First Republic[22570.9%], Select ome[14000%], CorEnergy Infrastructure[6797.78%], FedNat Holding[5525%], BlackRock Municipal[5340%], BlackRock MuniYield[3379.04%] Best Financial Stocks Daily:
Offerpad [12.3487%], PIMCO California[11.9545%], Torchmark [11.8363%], B. Riley[11.5556%], PIMCO California[11.4754%], BlackRock Muni[10.8108%], Blackrock MuniYield[10.72%], Better Home[10.5675%], Triumph Bancorp[10.2661%], BlackRock MuniYield[8.15348%], Summit [7.79817%]