
 Login Sign Up


| |||||
 |  | ||||

| 12Stocks.com Market Intelligence |
Best Financial Stocks
| In a hurry? Financial Stocks Lists: Performance Trends Table, Stock Charts
Sort Financial stocks: Daily, Weekly, Year-to-Date, Market Cap & Trends. Filter Financial stocks list by size:All Financial Large Mid-Range Small & MicroCap |
| 12Stocks.com Financial Stocks Performances & Trends Daily | |||||||||
|
|  The overall Smart Investing & Trading Score is 90 (0-bearish to 100-bullish) which puts Financial sector in short term bullish trend. The Smart Investing & Trading Score from previous trading session is 60 and hence an improvement of trend.
| ||||||||
Here are the Smart Investing & Trading Scores of the most requested Financial stocks at 12Stocks.com (click stock name for detailed review):
|


| 12Stocks.com: Investing in Financial sector with Stocks | |
|
The following table helps investors and traders sort through current performance and trends (as measured by Smart Investing & Trading Score) of various
stocks in the Financial sector. Quick View: Move mouse or cursor over stock symbol (ticker) to view short-term Technical chart and over stock name to view long term chart. Click on  to add stock symbol to your watchlist and to add stock symbol to your watchlist and  to view watchlist. Click on any ticker or stock name for detailed market intelligence report for that stock. to view watchlist. Click on any ticker or stock name for detailed market intelligence report for that stock. |
12Stocks.com Performance of Stocks in Financial Sector
| Ticker | Stock Name | Watchlist | Category | Recent Price | Trend Score | Change % | YTD Change% |
| PMF | PIMCO Municipal |   | Closed-End Fund - Debt | 8.29 | 100 | 6.83% | -5.53% |
| CIO | City Office | | REIT - Office | 6.95 | 60 | 0.14% | 35.69% |
| MMD | NYLI MacKay | | Closed-End Fund - Debt | 15.44 | 80 | 0.19% | 5.14% |
| BYM | BlackRock Municipal | | Closed-End Fund - Debt | 11.03 | 70 | -0.54% | 4.85% |
| WPG | Washington Prime | | Property Mgmt | 2.33 | 70 | 1.30% | 0.00% |
| WSBF | Waterstone | | Banks - Regional | 15.00 | 80 | -0.20% | 18.56% |
| NODK | NI | | Insurance - Property & Casualty | 13.70 | 90 | -0.72% | -11.95% |
| WMIH | WMIH | | Insurance | 18.06 | 40 | -2.48% | 0.00% |
| TPVG | TriplePoint Venture | | Asset Mgmt | 6.09 | 0 | -2.09% | -13.08% |
| AMNB | American National | | Regional Banks | 6.75 | 0 | -1.32% | 0.00% |
| TSBK | Timberland Bancorp | | Banks - Regional | 35.50 | 60 | -0.07% | 22.42% |
| NREF | NexPoint Real | | REIT - Mortgage | 13.98 | 20 | 0.22% | -5.40% |
| HYI | Western Asset | | Closed-End Fund - Debt | 12.06 | 60 | -0.25% | 7.28% |
| NMY | Nuveen Maryland | | Closed-End Fund - Debt | 10.57 | 0 | -0.09% | 0.00% |
| MEN | BlackRock MuniEnhanced | | Closed-End Fund - Debt | 2.44 | 0 | 2.09% | 0.00% |
| FSFR | Fifth Street | | Asset Mgmt | 8.84 | 20 | 0.00% | 0.00% |
| MFSF | MutualFirst | | Regional Banks | 8.31 | 50 | 0.73% | 0.00% |
| MCR | MFS Charter | | Closed-End Fund - Debt | 6.47 | 50 | -0.15% | 7.29% |
| RAS | RAIT | | REIT - | 1.40 | 0 | 0.00% | 0.00% |
| ERC | Allspring Multi-Sector | | Closed-End Fund - Debt | 9.61 | 50 | -0.72% | 11.86% |
| RIV | RiverNorth Opportunities | | Closed-End Fund - Equity | 12.04 | 0 | -1.15% | 9.90% |
| PKBK | Parke Bancorp | | Banks - Regional | 22.20 | 40 | -0.09% | 14.91% |
| JCE | Nuveen Core | | Closed-End Fund - Equity | 15.54 | 20 | 0.00% | 4.33% |
| MXF | Mexico Fund | | Closed-End Fund - Foreign | 19.29 | 100 | 1.10% | 50.19% |
| MCBC | Macatawa Bank | | Regional Banks | 3.46 | 0 | -3.62% | 0.00% |
| For chart view version of above stock list: Chart View ➞ 0 - 25 , 25 - 50 , 50 - 75 , 75 - 100 , 100 - 125 , 125 - 150 , 150 - 175 , 175 - 200 , 200 - 225 , 225 - 250 , 250 - 275 , 275 - 300 , 300 - 325 , 325 - 350 , 350 - 375 , 375 - 400 , 400 - 425 , 425 - 450 , 450 - 475 , 475 - 500 , 500 - 525 , 525 - 550 , 550 - 575 , 575 - 600 , 600 - 625 , 625 - 650 , 650 - 675 , 675 - 700 , 700 - 725 , 725 - 750 , 750 - 775 , 775 - 800 , 800 - 825 , 825 - 850 , 850 - 875 , 875 - 900 , 900 - 925 , 925 - 950 , 950 - 975 , 975 - 1000 , 1000 - 1025 , 1025 - 1050 , 1050 - 1075 , 1075 - 1100 , 1100 - 1125 , 1125 - 1150 , 1150 - 1175 , 1175 - 1200 , 1200 - 1225 , 1225 - 1250 , 1250 - 1275 , 1275 - 1300 , 1300 - 1325 , 1325 - 1350 , 1350 - 1375 , 1375 - 1400 , 1400 - 1425 , 1425 - 1450 , 1450 - 1475 , 1475 - 1500 , 1500 - 1525 , 1525 - 1550 | ||
 | Click To Change The Sort Order: By Market Cap or Company Size Performance: Year-to-date, Week and Day |  |
|
Get the most comprehensive stock market coverage daily at 12Stocks.com ➞ Best Stocks Today ➞ Best Stocks Weekly ➞ Best Stocks Year-to-Date ➞ Best Stocks Trends ➞  Best Stocks Today 12Stocks.com Best Nasdaq Stocks ➞ Best S&P 500 Stocks ➞ Best Tech Stocks ➞ Best Biotech Stocks ➞ |
| Detailed Overview of Financial Stocks |
| Financial Technical Overview, Leaders & Laggards, Top Financial ETF Funds & Detailed Financial Stocks List, Charts, Trends & More |
| Financial Sector: Technical Analysis, Trends & YTD Performance | |
| Financial sector is composed of stocks
from banks, brokers, insurance, REITs
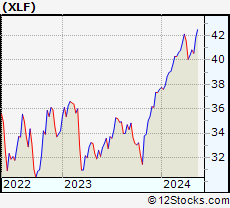
and services subsectors. Financial sector, as represented by XLF, an exchange-traded fund [ETF] that holds basket of Financial stocks (e.g, Bank of America, Goldman Sachs) is up by 12.9691% and is currently underperforming the overall market by -0.1777% year-to-date. Below is a quick view of Technical charts and trends: |
|
 XLF Weekly Chart |
|
| Long Term Trend: Good | |
| Medium Term Trend: Good | |
 XLF Daily Chart |
|
| Short Term Trend: Very Good | |
| Overall Trend Score: 90 | |
| YTD Performance: 12.9691% | |
| **Trend Scores & Views Are Only For Educational Purposes And Not For Investing | |
| 12Stocks.com: Top Performing Financial Sector Stocks | |||||||||||||||||||||||||||||||||||||||||||||||
 The top performing Financial sector stocks year to date are
Now, more recently, over last week, the top performing Financial sector stocks on the move are


|
|||||||||||||||||||||||||||||||||||||||||||||||
| 12Stocks.com: Investing in Financial Sector using Exchange Traded Funds | |
|
The following table shows list of key exchange traded funds (ETF) that
help investors track Financial Index. For detailed view, check out our ETF Funds section of our website. Quick View: Move mouse or cursor over ETF symbol (ticker) to view short-term Technical chart and over ETF name to view long term chart. Click on ticker or stock name for detailed view. Click on to add stock symbol to your watchlist and to view watchlist. |
12Stocks.com List of ETFs that track Financial Index
| Ticker | ETF Name | Watchlist | Recent Price | Smart Investing & Trading Score | Change % | Week % | Year-to-date % |
| CHIX | China Financials | | 10.57 | 20 | 0 | 0 | 0% |
| 12Stocks.com: Charts, Trends, Fundamental Data and Performances of Financial Stocks | |
|
We now take in-depth look at all Financial stocks including charts, multi-period performances and overall trends (as measured by Smart Investing & Trading Score). One can sort Financial stocks (click link to choose) by Daily, Weekly and by Year-to-Date performances. Also, one can sort by size of the company or by market capitalization. |
| Select Your Default Chart Type: | |||||
| |||||
| Click on stock symbol or name for detailed view. Click on to add stock symbol to your watchlist and to view watchlist. Quick View: Move mouse or cursor over "Daily" to quickly view daily Technical stock chart and over "Weekly" to view weekly Technical stock chart. | |||||

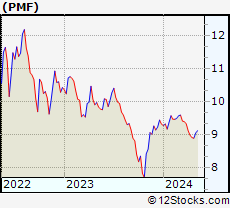 | PMF PIMCO Municipal Income Fund |
| Sector: Financials | |
| SubSector: Closed-End Fund - Debt | |
| MarketCap: 280.307 Millions | |
| Recent Price: 8.29 Smart Investing & Trading Score: 100 | |
| Day Percent Change: 6.8299% Day Change: -9999 | |
| Week Change: 6.41849% Year-to-date Change: -5.5% | |
| PMF Links: Profile News Message Board | |
| Charts:- Daily , Weekly | |
| Add PMF to Watchlist: View: Get Complete PMF Trend Analysis ➞ | |
 | CIO City Office REIT Inc |
| Sector: Financials | |
| SubSector: REIT - Office | |
| MarketCap: 280.12 Millions | |
| Recent Price: 6.95 Smart Investing & Trading Score: 60 | |
| Day Percent Change: 0.144092% Day Change: 0 | |
| Week Change: 0.144092% Year-to-date Change: 35.7% | |
| CIO Links: Profile News Message Board | |
| Charts:- Daily , Weekly | |
| Add CIO to Watchlist: View: Get Complete CIO Trend Analysis ➞ | |
 | MMD NYLI MacKay DefinedTerm Muni Opportunities Fund |
| Sector: Financials | |
| SubSector: Closed-End Fund - Debt | |
| MarketCap: 279.44 Millions | |
| Recent Price: 15.44 Smart Investing & Trading Score: 80 | |
| Day Percent Change: 0.194679% Day Change: -0.11 | |
| Week Change: 1.57895% Year-to-date Change: 5.1% | |
| MMD Links: Profile News Message Board | |
| Charts:- Daily , Weekly | |
| Add MMD to Watchlist: View: Get Complete MMD Trend Analysis ➞ | |
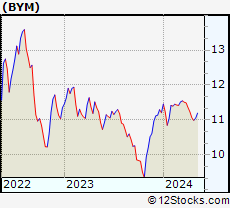 | BYM BlackRock Municipal Income Quality Trust |
| Sector: Financials | |
| SubSector: Closed-End Fund - Debt | |
| MarketCap: 276.13 Millions | |
| Recent Price: 11.03 Smart Investing & Trading Score: 70 | |
| Day Percent Change: -0.541028% Day Change: -0.03 | |
| Week Change: 1.84672% Year-to-date Change: 4.8% | |
| BYM Links: Profile News Message Board | |
| Charts:- Daily , Weekly | |
| Add BYM to Watchlist: View: Get Complete BYM Trend Analysis ➞ | |
 | WPG Washington Prime Group Inc. |
| Sector: Financials | |
| SubSector: Property Management | |
| MarketCap: 276.042 Millions | |
| Recent Price: 2.33 Smart Investing & Trading Score: 70 | |
| Day Percent Change: 1.30435% Day Change: -9999 | |
| Week Change: 179.947% Year-to-date Change: 0.0% | |
| WPG Links: Profile News Message Board | |
| Charts:- Daily , Weekly | |
| Add WPG to Watchlist: View: Get Complete WPG Trend Analysis ➞ | |
 | WSBF Waterstone Financial Inc |
| Sector: Financials | |
| SubSector: Banks - Regional | |
| MarketCap: 275.89 Millions | |
| Recent Price: 15.00 Smart Investing & Trading Score: 80 | |
| Day Percent Change: -0.199601% Day Change: -0.06 | |
| Week Change: 2.24949% Year-to-date Change: 18.6% | |
| WSBF Links: Profile News Message Board | |
| Charts:- Daily , Weekly | |
| Add WSBF to Watchlist: View: Get Complete WSBF Trend Analysis ➞ | |
 | NODK NI Holdings Inc |
| Sector: Financials | |
| SubSector: Insurance - Property & Casualty | |
| MarketCap: 275.81 Millions | |
| Recent Price: 13.70 Smart Investing & Trading Score: 90 | |
| Day Percent Change: -0.724638% Day Change: -0.08 | |
| Week Change: 3.39623% Year-to-date Change: -12.0% | |
| NODK Links: Profile News Message Board | |
| Charts:- Daily , Weekly | |
| Add NODK to Watchlist: View: Get Complete NODK Trend Analysis ➞ | |
 | WMIH WMIH Corp. |
| Sector: Financials | |
| SubSector: Property & Casualty Insurance | |
| MarketCap: 275.56 Millions | |
| Recent Price: 18.06 Smart Investing & Trading Score: 40 | |
| Day Percent Change: -2.4838% Day Change: -9999 | |
| Week Change: 191.761% Year-to-date Change: 0.0% | |
| WMIH Links: Profile News Message Board | |
| Charts:- Daily , Weekly | |
| Add WMIH to Watchlist: View: Get Complete WMIH Trend Analysis ➞ | |
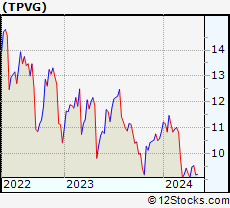 | TPVG TriplePoint Venture Growth BDC Corp |
| Sector: Financials | |
| SubSector: Asset Management | |
| MarketCap: 275.41 Millions | |
| Recent Price: 6.09 Smart Investing & Trading Score: 0 | |
| Day Percent Change: -2.09003% Day Change: 0.18 | |
| Week Change: -9.91124% Year-to-date Change: -13.1% | |
| TPVG Links: Profile News Message Board | |
| Charts:- Daily , Weekly | |
| Add TPVG to Watchlist: View: Get Complete TPVG Trend Analysis ➞ | |
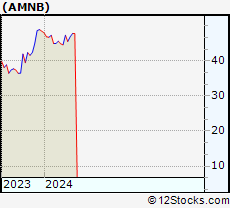 | AMNB American National Bankshares Inc. |
| Sector: Financials | |
| SubSector: Regional - Mid-Atlantic Banks | |
| MarketCap: 274.459 Millions | |
| Recent Price: 6.75 Smart Investing & Trading Score: 0 | |
| Day Percent Change: -1.31579% Day Change: -9999 | |
| Week Change: -85.914% Year-to-date Change: 0.0% | |
| AMNB Links: Profile News Message Board | |
| Charts:- Daily , Weekly | |
| Add AMNB to Watchlist: View: Get Complete AMNB Trend Analysis ➞ | |
 | TSBK Timberland Bancorp, Inc |
| Sector: Financials | |
| SubSector: Banks - Regional | |
| MarketCap: 272.77 Millions | |
| Recent Price: 35.50 Smart Investing & Trading Score: 60 | |
| Day Percent Change: -0.070373% Day Change: -0.54 | |
| Week Change: 2.394% Year-to-date Change: 22.4% | |
| TSBK Links: Profile News Message Board | |
| Charts:- Daily , Weekly | |
| Add TSBK to Watchlist: View: Get Complete TSBK Trend Analysis ➞ | |
 | NREF NexPoint Real Estate Finance Inc |
| Sector: Financials | |
| SubSector: REIT - Mortgage | |
| MarketCap: 272.74 Millions | |
| Recent Price: 13.98 Smart Investing & Trading Score: 20 | |
| Day Percent Change: 0.215054% Day Change: -0.19 | |
| Week Change: -8.50785% Year-to-date Change: -5.4% | |
| NREF Links: Profile News Message Board | |
| Charts:- Daily , Weekly | |
| Add NREF to Watchlist: View: Get Complete NREF Trend Analysis ➞ | |
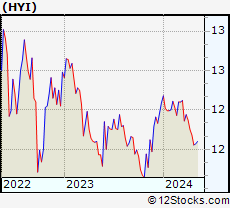 | HYI Western Asset High Yield Opportunity Fund Inc |
| Sector: Financials | |
| SubSector: Closed-End Fund - Debt | |
| MarketCap: 272.68 Millions | |
| Recent Price: 12.06 Smart Investing & Trading Score: 60 | |
| Day Percent Change: -0.248139% Day Change: -0.06 | |
| Week Change: 0.625782% Year-to-date Change: 7.3% | |
| HYI Links: Profile News Message Board | |
| Charts:- Daily , Weekly | |
| Add HYI to Watchlist: View: Get Complete HYI Trend Analysis ➞ | |
 | NMY Nuveen Maryland Quality Municipal Income Fund |
| Sector: Financials | |
| SubSector: Closed-End Fund - Debt | |
| MarketCap: 271.307 Millions | |
| Recent Price: 10.57 Smart Investing & Trading Score: 0 | |
| Day Percent Change: -0.094518% Day Change: -9999 | |
| Week Change: -26.0839% Year-to-date Change: 0.0% | |
| NMY Links: Profile News Message Board | |
| Charts:- Daily , Weekly | |
| Add NMY to Watchlist: View: Get Complete NMY Trend Analysis ➞ | |
 | MEN BlackRock MuniEnhanced Fund, Inc. |
| Sector: Financials | |
| SubSector: Closed-End Fund - Debt | |
| MarketCap: 270.407 Millions | |
| Recent Price: 2.44 Smart Investing & Trading Score: 0 | |
| Day Percent Change: 2.09205% Day Change: -9999 | |
| Week Change: -79.8013% Year-to-date Change: 0.0% | |
| MEN Links: Profile News Message Board | |
| Charts:- Daily , Weekly | |
| Add MEN to Watchlist: View: Get Complete MEN Trend Analysis ➞ | |
 | FSFR Fifth Street Senior Floating Rate Corp. |
| Sector: Financials | |
| SubSector: Asset Management | |
| MarketCap: 269.62 Millions | |
| Recent Price: 8.84 Smart Investing & Trading Score: 20 | |
| Day Percent Change: 0% Day Change: -9999 | |
| Week Change: 0% Year-to-date Change: 0.0% | |
| FSFR Links: Profile News Message Board | |
| Charts:- Daily , Weekly | |
| Add FSFR to Watchlist: View: Get Complete FSFR Trend Analysis ➞ | |
 | MFSF MutualFirst Financial, Inc. |
| Sector: Financials | |
| SubSector: Regional - Midwest Banks | |
| MarketCap: 268.77 Millions | |
| Recent Price: 8.31 Smart Investing & Trading Score: 50 | |
| Day Percent Change: 0.727273% Day Change: -9999 | |
| Week Change: 35.342% Year-to-date Change: 0.0% | |
| MFSF Links: Profile News Message Board | |
| Charts:- Daily , Weekly | |
| Add MFSF to Watchlist: View: Get Complete MFSF Trend Analysis ➞ | |
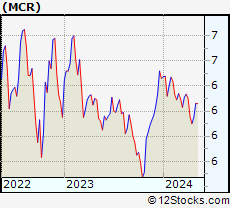 | MCR MFS Charter Income Trust |
| Sector: Financials | |
| SubSector: Closed-End Fund - Debt | |
| MarketCap: 268.47 Millions | |
| Recent Price: 6.47 Smart Investing & Trading Score: 50 | |
| Day Percent Change: -0.145062% Day Change: -0.02 | |
| Week Change: 0.475155% Year-to-date Change: 7.3% | |
| MCR Links: Profile News Message Board | |
| Charts:- Daily , Weekly | |
| Add MCR to Watchlist: View: Get Complete MCR Trend Analysis ➞ | |
 | RAS RAIT Financial Trust |
| Sector: Financials | |
| SubSector: REIT - Diversified | |
| MarketCap: 268.24 Millions | |
| Recent Price: 1.40 Smart Investing & Trading Score: 0 | |
| Day Percent Change: 0% Day Change: -9999 | |
| Week Change: -97.99% Year-to-date Change: 0.0% | |
| RAS Links: Profile News Message Board | |
| Charts:- Daily , Weekly | |
| Add RAS to Watchlist: View: Get Complete RAS Trend Analysis ➞ | |
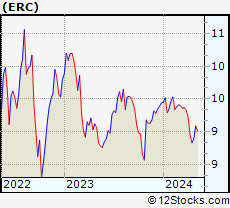 | ERC Allspring Multi-Sector Income Fund |
| Sector: Financials | |
| SubSector: Closed-End Fund - Debt | |
| MarketCap: 268.19 Millions | |
| Recent Price: 9.61 Smart Investing & Trading Score: 50 | |
| Day Percent Change: -0.72314% Day Change: 0.02 | |
| Week Change: -0.620476% Year-to-date Change: 11.9% | |
| ERC Links: Profile News Message Board | |
| Charts:- Daily , Weekly | |
| Add ERC to Watchlist: View: Get Complete ERC Trend Analysis ➞ | |
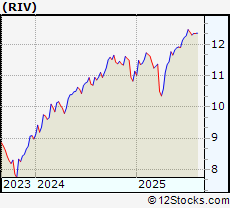 | RIV RiverNorth Opportunities Fund Inc |
| Sector: Financials | |
| SubSector: Closed-End Fund - Equity | |
| MarketCap: 266.69 Millions | |
| Recent Price: 12.04 Smart Investing & Trading Score: 0 | |
| Day Percent Change: -1.14943% Day Change: -0.03 | |
| Week Change: -3.60288% Year-to-date Change: 9.9% | |
| RIV Links: Profile News Message Board | |
| Charts:- Daily , Weekly | |
| Add RIV to Watchlist: View: Get Complete RIV Trend Analysis ➞ | |
 | PKBK Parke Bancorp Inc |
| Sector: Financials | |
| SubSector: Banks - Regional | |
| MarketCap: 266.21 Millions | |
| Recent Price: 22.20 Smart Investing & Trading Score: 40 | |
| Day Percent Change: -0.090009% Day Change: -0.2 | |
| Week Change: -2.24571% Year-to-date Change: 14.9% | |
| PKBK Links: Profile News Message Board | |
| Charts:- Daily , Weekly | |
| Add PKBK to Watchlist: View: Get Complete PKBK Trend Analysis ➞ | |
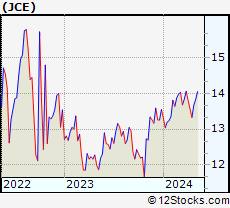 | JCE Nuveen Core Equity Alpha Fund |
| Sector: Financials | |
| SubSector: Closed-End Fund - Equity | |
| MarketCap: 264.96 Millions | |
| Recent Price: 15.54 Smart Investing & Trading Score: 20 | |
| Day Percent Change: 0% Day Change: -0.09 | |
| Week Change: -1.83196% Year-to-date Change: 4.3% | |
| JCE Links: Profile News Message Board | |
| Charts:- Daily , Weekly | |
| Add JCE to Watchlist: View: Get Complete JCE Trend Analysis ➞ | |
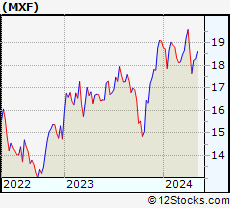 | MXF Mexico Fund Inc |
| Sector: Financials | |
| SubSector: Closed-End Fund - Foreign | |
| MarketCap: 264.61 Millions | |
| Recent Price: 19.29 Smart Investing & Trading Score: 100 | |
| Day Percent Change: 1.10063% Day Change: 0.14 | |
| Week Change: 4.83696% Year-to-date Change: 50.2% | |
| MXF Links: Profile News Message Board | |
| Charts:- Daily , Weekly | |
| Add MXF to Watchlist: View: Get Complete MXF Trend Analysis ➞ | |
 | MCBC Macatawa Bank Corporation |
| Sector: Financials | |
| SubSector: Regional - Midwest Banks | |
| MarketCap: 264.37 Millions | |
| Recent Price: 3.46 Smart Investing & Trading Score: 0 | |
| Day Percent Change: -3.62117% Day Change: -9999 | |
| Week Change: -76.8562% Year-to-date Change: 0.0% | |
| MCBC Links: Profile News Message Board | |
| Charts:- Daily , Weekly | |
| Add MCBC to Watchlist: View: Get Complete MCBC Trend Analysis ➞ | |
| For tabular summary view of above stock list: Summary View ➞ 0 - 25 , 25 - 50 , 50 - 75 , 75 - 100 , 100 - 125 , 125 - 150 , 150 - 175 , 175 - 200 , 200 - 225 , 225 - 250 , 250 - 275 , 275 - 300 , 300 - 325 , 325 - 350 , 350 - 375 , 375 - 400 , 400 - 425 , 425 - 450 , 450 - 475 , 475 - 500 , 500 - 525 , 525 - 550 , 550 - 575 , 575 - 600 , 600 - 625 , 625 - 650 , 650 - 675 , 675 - 700 , 700 - 725 , 725 - 750 , 750 - 775 , 775 - 800 , 800 - 825 , 825 - 850 , 850 - 875 , 875 - 900 , 900 - 925 , 925 - 950 , 950 - 975 , 975 - 1000 , 1000 - 1025 , 1025 - 1050 , 1050 - 1075 , 1075 - 1100 , 1100 - 1125 , 1125 - 1150 , 1150 - 1175 , 1175 - 1200 , 1200 - 1225 , 1225 - 1250 , 1250 - 1275 , 1275 - 1300 , 1300 - 1325 , 1325 - 1350 , 1350 - 1375 , 1375 - 1400 , 1400 - 1425 , 1425 - 1450 , 1450 - 1475 , 1475 - 1500 , 1500 - 1525 , 1525 - 1550 | ||
| Click To Change The Sort Order: By Market Cap or Company Size Performance: Year-to-date, Week and Day | |
| Select Chart Type: | ||
|
Best Stocks Today 12Stocks.com |
© 2025 12Stocks.com Terms & Conditions Privacy Contact Us
All Information Provided Only For Education And Not To Be Used For Investing or Trading. See Terms & Conditions


One More Thing ... Get Best Stocks Delivered Daily!
Never Ever Miss A Move With Our Top Ten Stocks Lists
Find Best Stocks In Any Market - Bull or Bear Market
Take A Peek At Our Top Ten Stocks Lists: Daily, Weekly, Year-to-Date & Top Trends
Find Best Stocks In Any Market - Bull or Bear Market
Take A Peek At Our Top Ten Stocks Lists: Daily, Weekly, Year-to-Date & Top Trends
Financial Stocks With Best Up Trends [0-bearish to 100-bullish]: PIMCO California[100], Torchmark [100], B. Riley[100], PIMCO California[100], Better Home[100], Triumph Bancorp[100], Cipher Mining[100], PIMCO Municipal[100], PIMCO Municipal[100], SuRo Capital[100], Front Yard[100]
Best Financial Stocks Year-to-Date:
Insight Select[12384.6%], Oxford Lane[292.029%], Better Home[209.081%], Robinhood Markets[200.811%], Metalpha Technology[196.46%], Cipher Mining[156.315%], Mr. Cooper[135%], LoanDepot [133.846%], Banco Santander[129.354%], Deutsche Bank[117.764%], IHS Holding[117.61%] Best Financial Stocks This Week:
Colony Starwood[15929900%], Blackhawk Network[91300%], Macquarie Global[81662.9%], Credit Suisse[63241.6%], Pennsylvania Real[23823%], First Republic[22570.9%], Select ome[14000%], CorEnergy Infrastructure[6797.78%], FedNat Holding[5525%], BlackRock Municipal[5340%], BlackRock MuniYield[3379.04%] Best Financial Stocks Daily:
Offerpad [12.3487%], PIMCO California[11.9545%], Torchmark [11.8363%], B. Riley[11.5556%], PIMCO California[11.4754%], BlackRock Muni[10.8108%], Blackrock MuniYield[10.72%], Better Home[10.5675%], Triumph Bancorp[10.2661%], BlackRock MuniYield[8.15348%], Summit [7.79817%]