
 Login Sign Up


| |||||
 |  | ||||

| 12Stocks.com Market Intelligence |
Best Energy Stocks
| In a hurry? Energy Stocks Lists: Performance Trends Table, Stock Charts
Sort Energy stocks: Daily, Weekly, Year-to-Date, Market Cap & Trends. Filter Energy stocks list by size: All Energy Large Mid-Range Small & MicroCap |
| 12Stocks.com Energy Stocks Performances & Trends Daily | |||||||||
|
|  The overall Smart Investing & Trading Score is 44 (0-bearish to 100-bullish) which puts Energy sector in short term neutral trend. The Smart Investing & Trading Score from previous trading session is 51 and hence a deterioration of trend.
| ||||||||
Here are the Smart Investing & Trading Scores of the most requested Energy stocks at 12Stocks.com (click stock name for detailed review):
|

| 12Stocks.com: Investing in Energy sector with Stocks | |
|
The following table helps investors and traders sort through current performance and trends (as measured by Smart Investing & Trading Score) of various
stocks in the Energy sector. Quick View: Move mouse or cursor over stock symbol (ticker) to view short-term Technical chart and over stock name to view long term chart. Click on  to add stock symbol to your watchlist and to add stock symbol to your watchlist and  to view watchlist. Click on any ticker or stock name for detailed market intelligence report for that stock. to view watchlist. Click on any ticker or stock name for detailed market intelligence report for that stock. |
12Stocks.com Performance of Stocks in Energy Sector
| Ticker | Stock Name | Watchlist | Category | Recent Price | Smart Investing & Trading Score | Change % | Weekly Change% |
| EC | Ecopetrol S.A |   | Integrated | 11.54 | 0 | 0.04% | -1.41% |
| CVX | Chevron | | Integrated | 156.69 | 44 | -0.57% | -1.43% |
| KOS | Kosmos | | Independent | 6.11 | 28 | 0.99% | -1.45% |
| TRP | TC | | Pipelines | 35.58 | 10 | -1.18% | -1.48% |
| WES | Western Midstream | | Pipelines | 33.99 | 36 | -0.73% | -1.59% |
| VAL | Valaris | | Equipment | 69.68 | 31 | -0.24% | -1.62% |
| KRP | Kimbell Royalty | | Drilling & Exploration | 15.78 | 51 | -0.69% | -1.62% |
| CLB | Core | | Equipment | 17.21 | 49 | -0.98% | -1.66% |
| SLB | Schlumberger | | Equipment | 51.13 | 26 | -1.05% | -1.67% |
| HES | Hess | | Independent | 150.64 | 36 | -0.65% | -1.68% |
| WMB | Williams | | Pipelines | 37.44 | 36 | -1.06% | -1.68% |
| FLNG | Flex LNG | | Equipment | 25.00 | 28 | -0.71% | -1.73% |
| ERF | Enerplus | | Drilling & Exploration | 20.31 | 58 | -0.78% | -1.74% |
| RES | RPC | | Equipment | 7.73 | 36 | -1.02% | -1.78% |
| PSX | Phillips 66 | | Refining | 159.56 | 36 | -0.78% | -1.80% |
| EQNR | Equinor ASA | | Integrated | 27.71 | 42 | -0.25% | -1.81% |
| MRC | MRC Global | | Equipment | 11.86 | 31 | -0.75% | -1.82% |
| SOI | Solaris Oilfield | | Equipment | 8.37 | 36 | -1.65% | -1.88% |
| IMO | Imperial Oil | | Integrated | 68.61 | 36 | 0.04% | -1.89% |
| HP | Helmerich & Payne | | Drilling & Exploration | 40.99 | 36 | -1.54% | -1.91% |
| WTI | W&T Offshore | | Drilling & Exploration | 2.55 | 20 | -0.78% | -1.92% |
| NOA | North American | | Equipment | 20.62 | 0 | -1.39% | -2.04% |
| GPOR | Gulfport | | E&P | 153.70 | 31 | 0.16% | -2.05% |
| LNG | Cheniere | | Pipelines | 153.55 | 0 | -0.57% | -2.07% |
| CQP | Cheniere | | Pipelines | 45.73 | 0 | -0.91% | -2.08% |
| For chart view version of above stock list: Chart View ➞ 0 - 25 , 25 - 50 , 50 - 75 , 75 - 100 , 100 - 125 | ||
 | Click To Change The Sort Order: By Market Cap or Company Size Performance: Year-to-date, Week and Day |  |
|
Get the most comprehensive stock market coverage daily at 12Stocks.com ➞ Best Stocks Today ➞ Best Stocks Weekly ➞ Best Stocks Year-to-Date ➞ Best Stocks Trends ➞  Best Stocks Today 12Stocks.com Best Nasdaq Stocks ➞ Best S&P 500 Stocks ➞ Best Tech Stocks ➞ Best Biotech Stocks ➞ |
| Detailed Overview of Energy Stocks |
| Energy Technical Overview, Leaders & Laggards, Top Energy ETF Funds & Detailed Energy Stocks List, Charts, Trends & More |
| Energy Sector: Technical Analysis, Trends & YTD Performance | |
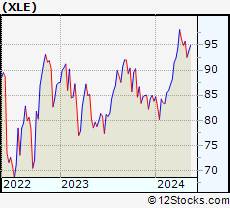
| Energy sector is composed of stocks
from oil production, refining, exploration, drilling
and services subsectors. Energy sector, as represented by XLE, an exchange-traded fund [ETF] that holds basket of Energy stocks (e.g, Exxon, Halliburton) is up by 12.67% and is currently outperforming the overall market by 7.62% year-to-date. Below is a quick view of Technical charts and trends: |
|
 XLE Weekly Chart |
|
| Long Term Trend: Very Good | |
| Medium Term Trend: Good | |
 XLE Daily Chart |
|
| Short Term Trend: Not Good | |
| Overall Trend Score: 44 | |
| YTD Performance: 12.67% | |
| **Trend Scores & Views Are Only For Educational Purposes And Not For Investing | |
| 12Stocks.com: Top Performing Energy Sector Stocks | ||||||||||||||||||||||||||||||||||||||||||||||||
 The top performing Energy sector stocks year to date are
Now, more recently, over last week, the top performing Energy sector stocks on the move are


|
||||||||||||||||||||||||||||||||||||||||||||||||
| 12Stocks.com: Investing in Energy Sector using Exchange Traded Funds | |
|
The following table shows list of key exchange traded funds (ETF) that
help investors track Energy Index. For detailed view, check out our ETF Funds section of our website. Quick View: Move mouse or cursor over ETF symbol (ticker) to view short-term Technical chart and over ETF name to view long term chart. Click on ticker or stock name for detailed view. Click on to add stock symbol to your watchlist and to view watchlist. |
12Stocks.com List of ETFs that track Energy Index
| Ticker | ETF Name | Watchlist | Recent Price | Smart Investing & Trading Score | Change % | Week % | Year-to-date % |
| XLE | Energy | | 94.47 | 44 | -0.80 | -1.73 | 12.67% |
| OIH | Oil Services | | 325.77 | 36 | -1.13 | -2.51 | 5.25% |
| USO | Oil | | 81.47 | 64 | -0.23 | -0.08 | 22.23% |
| UNG | Natural Gas | | 14.02 | 5 | -0.88 | -5.88 | 176.43% |
| BNO | Brent Oil | | 33.20 | 64 | -0.09 | -0.06 | 21.57% |
| IYE | Energy | | 49.32 | 44 | -0.80 | -1.81 | 11.79% |
| PBW | Clean Energy | | 20.04 | 10 | -3.51 | -4.8 | -32.57% |
| ERX | Energy Bull 3X | | 70.67 | 44 | -1.61 | -3.34 | 24.92% |
| ERY | Energy Bear 3X | | 21.72 | 49 | 1.73 | 3.48 | -22.23% |
| DIG | Oil & Gas | | 45.77 | 51 | -1.75 | -3.45 | 24.59% |
| DUG | Short Oil & | | 9.16 | 49 | 2.44 | 3.95 | -21.26% |
| XOP | Oil & Gas | | 153.65 | 36 | -1.16 | -2.74 | 12.23% |
| XES | Oil & Gas | | 91.03 | 36 | -1.18 | -3.06 | 7.72% |
| ICLN | Global Clean Energy | | 13.07 | 10 | -2.02 | -3.4 | -16.06% |
| PSCE | SmallCap Energy | | 55.58 | 34 | -0.16 | -1.52 | 6.79% |
| IEO | Oil&Gas Explor&Prodtn | | 106.90 | 51 | -1.27 | -2.47 | 14.71% |
| 12Stocks.com: Charts, Trends, Fundamental Data and Performances of Energy Stocks | |
|
We now take in-depth look at all Energy stocks including charts, multi-period performances and overall trends (as measured by Smart Investing & Trading Score). One can sort Energy stocks (click link to choose) by Daily, Weekly and by Year-to-Date performances. Also, one can sort by size of the company or by market capitalization. |
| Select Your Default Chart Type: | |||||
| |||||
| Click on stock symbol or name for detailed view. Click on to add stock symbol to your watchlist and to view watchlist. Quick View: Move mouse or cursor over "Daily" to quickly view daily Technical stock chart and over "Weekly" to view weekly Technical stock chart. | |||||

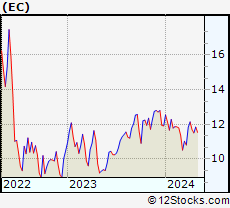 | EC Ecopetrol S.A. |
| Sector: Energy | |
| SubSector: Major Integrated Oil & Gas | |
| MarketCap: 17496.5 Millions | |
| Recent Price: 11.54 Smart Investing & Trading Score: 0 | |
| Day Percent Change: 0.04% Day Change: 0.01 | |
| Week Change: -1.41% Year-to-date Change: -3.2% | |
| EC Links: Profile News Message Board | |
| Charts:- Daily , Weekly | |
| Add EC to Watchlist: View: Get Complete EC Trend Analysis ➞ | |
 | CVX Chevron Corporation |
| Sector: Energy | |
| SubSector: Major Integrated Oil & Gas | |
| MarketCap: 121521 Millions | |
| Recent Price: 156.69 Smart Investing & Trading Score: 44 | |
| Day Percent Change: -0.57% Day Change: -0.91 | |
| Week Change: -1.43% Year-to-date Change: 5.0% | |
| CVX Links: Profile News Message Board | |
| Charts:- Daily , Weekly | |
| Add CVX to Watchlist: View: Get Complete CVX Trend Analysis ➞ | |
 | KOS Kosmos Energy Ltd. |
| Sector: Energy | |
| SubSector: Independent Oil & Gas | |
| MarketCap: 261.693 Millions | |
| Recent Price: 6.11 Smart Investing & Trading Score: 28 | |
| Day Percent Change: 0.99% Day Change: 0.06 | |
| Week Change: -1.45% Year-to-date Change: -8.9% | |
| KOS Links: Profile News Message Board | |
| Charts:- Daily , Weekly | |
| Add KOS to Watchlist: View: Get Complete KOS Trend Analysis ➞ | |
 | TRP TC Energy Corporation |
| Sector: Energy | |
| SubSector: Oil & Gas Pipelines | |
| MarketCap: 44071.1 Millions | |
| Recent Price: 35.58 Smart Investing & Trading Score: 10 | |
| Day Percent Change: -1.18% Day Change: -0.42 | |
| Week Change: -1.48% Year-to-date Change: -9.0% | |
| TRP Links: Profile News Message Board | |
| Charts:- Daily , Weekly | |
| Add TRP to Watchlist: View: Get Complete TRP Trend Analysis ➞ | |
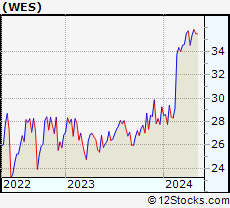 | WES Western Midstream Partners, LP |
| Sector: Energy | |
| SubSector: Oil & Gas Pipelines | |
| MarketCap: 3110.05 Millions | |
| Recent Price: 33.99 Smart Investing & Trading Score: 36 | |
| Day Percent Change: -0.73% Day Change: -0.25 | |
| Week Change: -1.59% Year-to-date Change: 16.2% | |
| WES Links: Profile News Message Board | |
| Charts:- Daily , Weekly | |
| Add WES to Watchlist: View: Get Complete WES Trend Analysis ➞ | |
 | VAL Valaris Limited |
| Sector: Energy | |
| SubSector: Oil & Gas Equipment & Services | |
| MarketCap: 4520 Millions | |
| Recent Price: 69.68 Smart Investing & Trading Score: 31 | |
| Day Percent Change: -0.24% Day Change: -0.17 | |
| Week Change: -1.62% Year-to-date Change: 1.6% | |
| VAL Links: Profile News Message Board | |
| Charts:- Daily , Weekly | |
| Add VAL to Watchlist: View: Get Complete VAL Trend Analysis ➞ | |
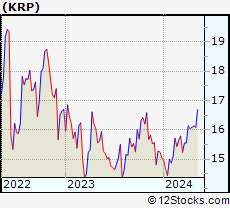 | KRP Kimbell Royalty Partners, LP |
| Sector: Energy | |
| SubSector: Oil & Gas Drilling & Exploration | |
| MarketCap: 156.439 Millions | |
| Recent Price: 15.78 Smart Investing & Trading Score: 51 | |
| Day Percent Change: -0.69% Day Change: -0.11 | |
| Week Change: -1.62% Year-to-date Change: 4.9% | |
| KRP Links: Profile News Message Board | |
| Charts:- Daily , Weekly | |
| Add KRP to Watchlist: View: Get Complete KRP Trend Analysis ➞ | |
 | CLB Core Laboratories N.V. |
| Sector: Energy | |
| SubSector: Oil & Gas Equipment & Services | |
| MarketCap: 599.661 Millions | |
| Recent Price: 17.21 Smart Investing & Trading Score: 49 | |
| Day Percent Change: -0.98% Day Change: -0.17 | |
| Week Change: -1.66% Year-to-date Change: -2.6% | |
| CLB Links: Profile News Message Board | |
| Charts:- Daily , Weekly | |
| Add CLB to Watchlist: View: Get Complete CLB Trend Analysis ➞ | |
 | SLB Schlumberger Limited |
| Sector: Energy | |
| SubSector: Oil & Gas Equipment & Services | |
| MarketCap: 23892 Millions | |
| Recent Price: 51.13 Smart Investing & Trading Score: 26 | |
| Day Percent Change: -1.05% Day Change: -0.54 | |
| Week Change: -1.67% Year-to-date Change: -1.8% | |
| SLB Links: Profile News Message Board | |
| Charts:- Daily , Weekly | |
| Add SLB to Watchlist: View: Get Complete SLB Trend Analysis ➞ | |
 | HES Hess Corporation |
| Sector: Energy | |
| SubSector: Independent Oil & Gas | |
| MarketCap: 10465.3 Millions | |
| Recent Price: 150.64 Smart Investing & Trading Score: 36 | |
| Day Percent Change: -0.65% Day Change: -0.98 | |
| Week Change: -1.68% Year-to-date Change: 4.5% | |
| HES Links: Profile News Message Board | |
| Charts:- Daily , Weekly | |
| Add HES to Watchlist: View: Get Complete HES Trend Analysis ➞ | |
 | WMB The Williams Companies, Inc. |
| Sector: Energy | |
| SubSector: Oil & Gas Pipelines | |
| MarketCap: 16851.5 Millions | |
| Recent Price: 37.44 Smart Investing & Trading Score: 36 | |
| Day Percent Change: -1.06% Day Change: -0.40 | |
| Week Change: -1.68% Year-to-date Change: 7.5% | |
| WMB Links: Profile News Message Board | |
| Charts:- Daily , Weekly | |
| Add WMB to Watchlist: View: Get Complete WMB Trend Analysis ➞ | |
 | FLNG Flex LNG Ltd. |
| Sector: Energy | |
| SubSector: Oil & Gas Equipment & Services | |
| MarketCap: 220.261 Millions | |
| Recent Price: 25.00 Smart Investing & Trading Score: 28 | |
| Day Percent Change: -0.71% Day Change: -0.18 | |
| Week Change: -1.73% Year-to-date Change: -14.0% | |
| FLNG Links: Profile News Message Board | |
| Charts:- Daily , Weekly | |
| Add FLNG to Watchlist: View: Get Complete FLNG Trend Analysis ➞ | |
 | ERF Enerplus Corporation |
| Sector: Energy | |
| SubSector: Oil & Gas Drilling & Exploration | |
| MarketCap: 372.639 Millions | |
| Recent Price: 20.31 Smart Investing & Trading Score: 58 | |
| Day Percent Change: -0.78% Day Change: -0.16 | |
| Week Change: -1.74% Year-to-date Change: 32.4% | |
| ERF Links: Profile News Message Board | |
| Charts:- Daily , Weekly | |
| Add ERF to Watchlist: View: Get Complete ERF Trend Analysis ➞ | |
 | RES RPC, Inc. |
| Sector: Energy | |
| SubSector: Oil & Gas Equipment & Services | |
| MarketCap: 546.261 Millions | |
| Recent Price: 7.73 Smart Investing & Trading Score: 36 | |
| Day Percent Change: -1.02% Day Change: -0.08 | |
| Week Change: -1.78% Year-to-date Change: 6.2% | |
| RES Links: Profile News Message Board | |
| Charts:- Daily , Weekly | |
| Add RES to Watchlist: View: Get Complete RES Trend Analysis ➞ | |
 | PSX Phillips 66 |
| Sector: Energy | |
| SubSector: Oil & Gas Refining & Marketing | |
| MarketCap: 25253.6 Millions | |
| Recent Price: 159.56 Smart Investing & Trading Score: 36 | |
| Day Percent Change: -0.78% Day Change: -1.26 | |
| Week Change: -1.8% Year-to-date Change: 19.8% | |
| PSX Links: Profile News Message Board | |
| Charts:- Daily , Weekly | |
| Add PSX to Watchlist: View: Get Complete PSX Trend Analysis ➞ | |
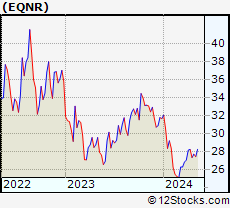 | EQNR Equinor ASA |
| Sector: Energy | |
| SubSector: Major Integrated Oil & Gas | |
| MarketCap: 37048.3 Millions | |
| Recent Price: 27.71 Smart Investing & Trading Score: 42 | |
| Day Percent Change: -0.25% Day Change: -0.07 | |
| Week Change: -1.81% Year-to-date Change: -12.4% | |
| EQNR Links: Profile News Message Board | |
| Charts:- Daily , Weekly | |
| Add EQNR to Watchlist: View: Get Complete EQNR Trend Analysis ➞ | |
 | MRC MRC Global Inc. |
| Sector: Energy | |
| SubSector: Oil & Gas Equipment & Services | |
| MarketCap: 364.061 Millions | |
| Recent Price: 11.86 Smart Investing & Trading Score: 31 | |
| Day Percent Change: -0.75% Day Change: -0.09 | |
| Week Change: -1.82% Year-to-date Change: 7.7% | |
| MRC Links: Profile News Message Board | |
| Charts:- Daily , Weekly | |
| Add MRC to Watchlist: View: Get Complete MRC Trend Analysis ➞ | |
 | SOI Solaris Oilfield Infrastructure, Inc. |
| Sector: Energy | |
| SubSector: Oil & Gas Equipment & Services | |
| MarketCap: 267.361 Millions | |
| Recent Price: 8.37 Smart Investing & Trading Score: 36 | |
| Day Percent Change: -1.65% Day Change: -0.14 | |
| Week Change: -1.88% Year-to-date Change: 5.2% | |
| SOI Links: Profile News Message Board | |
| Charts:- Daily , Weekly | |
| Add SOI to Watchlist: View: Get Complete SOI Trend Analysis ➞ | |
 | IMO Imperial Oil Limited |
| Sector: Energy | |
| SubSector: Major Integrated Oil & Gas | |
| MarketCap: 8171.25 Millions | |
| Recent Price: 68.61 Smart Investing & Trading Score: 36 | |
| Day Percent Change: 0.04% Day Change: 0.03 | |
| Week Change: -1.89% Year-to-date Change: 20.0% | |
| IMO Links: Profile News Message Board | |
| Charts:- Daily , Weekly | |
| Add IMO to Watchlist: View: Get Complete IMO Trend Analysis ➞ | |
 | HP Helmerich & Payne, Inc. |
| Sector: Energy | |
| SubSector: Oil & Gas Drilling & Exploration | |
| MarketCap: 1796.39 Millions | |
| Recent Price: 40.99 Smart Investing & Trading Score: 36 | |
| Day Percent Change: -1.54% Day Change: -0.64 | |
| Week Change: -1.91% Year-to-date Change: 13.2% | |
| HP Links: Profile News Message Board | |
| Charts:- Daily , Weekly | |
| Add HP to Watchlist: View: Get Complete HP Trend Analysis ➞ | |
 | WTI W&T Offshore, Inc. |
| Sector: Energy | |
| SubSector: Oil & Gas Drilling & Exploration | |
| MarketCap: 244.539 Millions | |
| Recent Price: 2.55 Smart Investing & Trading Score: 20 | |
| Day Percent Change: -0.78% Day Change: -0.02 | |
| Week Change: -1.92% Year-to-date Change: -21.8% | |
| WTI Links: Profile News Message Board | |
| Charts:- Daily , Weekly | |
| Add WTI to Watchlist: View: Get Complete WTI Trend Analysis ➞ | |
 | NOA North American Construction Group Ltd. |
| Sector: Energy | |
| SubSector: Oil & Gas Equipment & Services | |
| MarketCap: 160.461 Millions | |
| Recent Price: 20.62 Smart Investing & Trading Score: 0 | |
| Day Percent Change: -1.39% Day Change: -0.29 | |
| Week Change: -2.04% Year-to-date Change: -1.1% | |
| NOA Links: Profile News Message Board | |
| Charts:- Daily , Weekly | |
| Add NOA to Watchlist: View: Get Complete NOA Trend Analysis ➞ | |
 | GPOR Gulfport Energy Corporation |
| Sector: Energy | |
| SubSector: Oil & Gas E&P | |
| MarketCap: 1890 Millions | |
| Recent Price: 153.70 Smart Investing & Trading Score: 31 | |
| Day Percent Change: 0.16% Day Change: 0.24 | |
| Week Change: -2.05% Year-to-date Change: 15.4% | |
| GPOR Links: Profile News Message Board | |
| Charts:- Daily , Weekly | |
| Add GPOR to Watchlist: View: Get Complete GPOR Trend Analysis ➞ | |
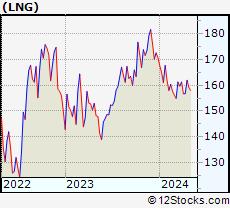 | LNG Cheniere Energy, Inc. |
| Sector: Energy | |
| SubSector: Oil & Gas Pipelines | |
| MarketCap: 9905.15 Millions | |
| Recent Price: 153.55 Smart Investing & Trading Score: 0 | |
| Day Percent Change: -0.57% Day Change: -0.88 | |
| Week Change: -2.07% Year-to-date Change: -10.1% | |
| LNG Links: Profile News Message Board | |
| Charts:- Daily , Weekly | |
| Add LNG to Watchlist: View: Get Complete LNG Trend Analysis ➞ | |
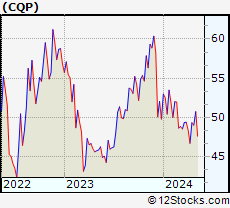 | CQP Cheniere Energy Partners, L.P. |
| Sector: Energy | |
| SubSector: Oil & Gas Pipelines | |
| MarketCap: 11911.5 Millions | |
| Recent Price: 45.73 Smart Investing & Trading Score: 0 | |
| Day Percent Change: -0.91% Day Change: -0.42 | |
| Week Change: -2.08% Year-to-date Change: -8.2% | |
| CQP Links: Profile News Message Board | |
| Charts:- Daily , Weekly | |
| Add CQP to Watchlist: View: Get Complete CQP Trend Analysis ➞ | |
| For tabular summary view of above stock list: Summary View ➞ 0 - 25 , 25 - 50 , 50 - 75 , 75 - 100 , 100 - 125 | ||
| Click To Change The Sort Order: By Market Cap or Company Size Performance: Year-to-date, Week and Day | |
| Select Chart Type: | ||
|
Best Stocks Today 12Stocks.com |
© 2024 12Stocks.com Terms & Conditions Privacy Contact Us
All Information Provided Only For Education And Not To Be Used For Investing or Trading. See Terms & Conditions


One More Thing ... Get Best Stocks Delivered Daily!
Never Ever Miss A Move With Our Top Ten Stocks Lists
Find Best Stocks In Any Market - Bull or Bear Market
Take A Peek At Our Top Ten Stocks Lists: Daily, Weekly, Year-to-Date & Top Trends
Find Best Stocks In Any Market - Bull or Bear Market
Take A Peek At Our Top Ten Stocks Lists: Daily, Weekly, Year-to-Date & Top Trends
Energy Stocks With Best Up Trends [0-bearish to 100-bullish]: NextDecade [88], Genesis [83], Natural Gas[83], Targa Resources[66], Diamondback [66], Northern Oil[64], Prime Resources[58], Newpark Resources[58], Enerplus [58], Viper [58], EOG Resources[56]
Best Energy Stocks Year-to-Date:
Natural Gas[45.4%], Marathon [37.47%], PBF [32.6%], Enerplus [32.4%], NOW [31.4%], Diamondback [31.13%], Targa Resources[30.86%], Valero [29.65%], SM [29.39%], NextDecade [28.62%], Tidewater [28.3%] Best Energy Stocks This Week:
NOW [1.61%], Newpark Resources[0.61%], Matrix Service[0.33%], Star [0.1%], Calumet Specialty[0.07%], Prime Resources[-0.21%], Suncor [-0.34%], Genie [-0.46%], EnLink Midstream[-0.48%], Natural Gas[-0.6%], Cactus [-0.79%] Best Energy Stocks Daily:
Calumet Specialty[2.53%], Star [1.09%], Suncor [1.02%], Kosmos [0.99%], Dominion Midstream[0.85%], GeoPark [0.83%], Cenovus [0.73%], MPLX LP[0.72%], EnLink Midstream[0.41%], Cactus [0.40%], Genie [0.20%]