
 Login Sign Up


| |||||
 |  | ||||

| 12Stocks.com Market Intelligence |
Best Energy Stocks
| In a hurry? Energy Stocks Lists: Performance Trends Table, Stock Charts
Sort Energy stocks: Daily, Weekly, Year-to-Date, Market Cap & Trends. Filter Energy stocks list by size: All Energy Large Mid-Range Small & MicroCap |
| 12Stocks.com Energy Stocks Performances & Trends Daily | |||||||||
|
|  The overall Smart Investing & Trading Score is 68 (0-bearish to 100-bullish) which puts Energy sector in short term neutral to bullish trend. The Smart Investing & Trading Score from previous trading session is 44 and an improvement of trend continues.
| ||||||||
Here are the Smart Investing & Trading Scores of the most requested Energy stocks at 12Stocks.com (click stock name for detailed review):
|


| 12Stocks.com: Investing in Energy sector with Stocks | |
|
The following table helps investors and traders sort through current performance and trends (as measured by Smart Investing & Trading Score) of various
stocks in the Energy sector. Quick View: Move mouse or cursor over stock symbol (ticker) to view short-term Technical chart and over stock name to view long term chart. Click on  to add stock symbol to your watchlist and to add stock symbol to your watchlist and  to view watchlist. Click on any ticker or stock name for detailed market intelligence report for that stock. to view watchlist. Click on any ticker or stock name for detailed market intelligence report for that stock. |
12Stocks.com Performance of Stocks in Energy Sector
| Ticker | Stock Name | Watchlist | Category | Recent Price | Smart Investing & Trading Score | Change % | Weekly Change% |
| PVL | Permianville Royalty |   | Independent | 1.66 | 100 | 0.00% | 12.93% |
| GIFI | Gulf Island | | Equipment | 6.82 | 68 | -0.44% | 5.90% |
| PFIE | Profire | | Equipment | 1.85 | 83 | -1.07% | 5.11% |
| PHX | Panhandle Oil | | Independent | 3.53 | 85 | 6.01% | 3.22% |
| AE | Adams Resources | | Refining | 30.00 | 73 | 2.39% | 2.32% |
| AMPY | Amplify | | Independent | 7.33 | 83 | -0.68% | 1.95% |
| SBOW | SilverBow Resources | | Independent | 30.74 | 51 | 0.69% | 1.72% |
| EPSN | Epsilon | | Independent | 5.38 | 73 | -0.37% | 1.41% |
| CEI | Camber | | Drilling & Exploration | 0.17 | 23 | -4.26% | 1.26% |
| MVO | MV Oil | | Independent | 9.90 | 25 | 3.66% | 1.12% |
| GTE | Gran Tierra | | Independent | 8.26 | 88 | 1.35% | 1.10% |
| SD | SandRidge | | Drilling & Exploration | 14.66 | 48 | -0.61% | 0.89% |
| SDPI | Superior Drilling | | Equipment | 1.25 | 90 | 0.00% | 0.81% |
| MMLP | Martin Midstream | | Pipelines | 2.73 | 50 | 5.00% | 0.74% |
| TTI | TETRA Technologies | | Equipment | 4.45 | 54 | -0.67% | 0.68% |
| TUSK | Mammoth | | Drilling & Exploration | 3.35 | 42 | -0.89% | 0.60% |
| FTK | Flotek Industries | | Equipment | 3.48 | 44 | 0.58% | 0.58% |
| SMLP | Summit Midstream | | Pipelines | 27.91 | 61 | -0.25% | 0.54% |
| SLNG | Stabilis | | Pipelines | 4.14 | 52 | 0.00% | 0.49% |
| CRT | Cross Timbers | | Drilling & Exploration | 14.48 | 67 | -0.34% | 0.45% |
| EPM | Evolution | | Independent | 5.75 | 54 | 0.70% | 0.35% |
| VOC | VOC | | Independent | 6.17 | 37 | 0.00% | 0.33% |
| PRT | PermRock Royalty | | Equipment | 4.09 | 45 | 0.00% | 0.25% |
| GEOS | Geospace Technologies | | Equipment | 12.48 | 18 | -0.40% | -0.24% |
| FET | Forum | | Equipment | 19.45 | 38 | -0.26% | -0.51% |
| For chart view version of above stock list: Chart View ➞ 0 - 25 , 25 - 50 | ||
 | Click To Change The Sort Order: By Market Cap or Company Size Performance: Year-to-date, Week and Day |  |
|
Get the most comprehensive stock market coverage daily at 12Stocks.com ➞ Best Stocks Today ➞ Best Stocks Weekly ➞ Best Stocks Year-to-Date ➞ Best Stocks Trends ➞  Best Stocks Today 12Stocks.com Best Nasdaq Stocks ➞ Best S&P 500 Stocks ➞ Best Tech Stocks ➞ Best Biotech Stocks ➞ |
| Detailed Overview of Energy Stocks |
| Energy Technical Overview, Leaders & Laggards, Top Energy ETF Funds & Detailed Energy Stocks List, Charts, Trends & More |
| Energy Sector: Technical Analysis, Trends & YTD Performance | |
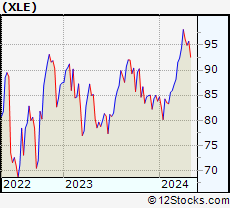
| Energy sector is composed of stocks
from oil production, refining, exploration, drilling
and services subsectors. Energy sector, as represented by XLE, an exchange-traded fund [ETF] that holds basket of Energy stocks (e.g, Exxon, Halliburton) is up by 14.73% and is currently outperforming the overall market by 9.07% year-to-date. Below is a quick view of Technical charts and trends: |
|
 XLE Weekly Chart |
|
| Long Term Trend: Very Good | |
| Medium Term Trend: Not Good | |
 XLE Daily Chart |
|
| Short Term Trend: Very Good | |
| Overall Trend Score: 68 | |
| YTD Performance: 14.73% | |
| **Trend Scores & Views Are Only For Educational Purposes And Not For Investing | |
| 12Stocks.com: Top Performing Energy Sector Stocks | ||||||||||||||||||||||||||||||||||||||||||||||||
 The top performing Energy sector stocks year to date are
Now, more recently, over last week, the top performing Energy sector stocks on the move are


|
||||||||||||||||||||||||||||||||||||||||||||||||
| 12Stocks.com: Investing in Energy Sector using Exchange Traded Funds | |
|
The following table shows list of key exchange traded funds (ETF) that
help investors track Energy Index. For detailed view, check out our ETF Funds section of our website. Quick View: Move mouse or cursor over ETF symbol (ticker) to view short-term Technical chart and over ETF name to view long term chart. Click on ticker or stock name for detailed view. Click on to add stock symbol to your watchlist and to view watchlist. |
12Stocks.com List of ETFs that track Energy Index
| Ticker | ETF Name | Watchlist | Recent Price | Smart Investing & Trading Score | Change % | Week % | Year-to-date % |
| XLE | Energy | | 96.19 | 68 | 0.07 | 1.28 | 14.73% |
| OIH | Oil Services | | 325.08 | 61 | -0.55 | 0.38 | 5.03% |
| USO | Oil | | 79.64 | 68 | -0.43 | 1 | 19.49% |
| UNG | Natural Gas | | 14.36 | 17 | -6.99 | -1.1 | 183.23% |
| BNO | Brent Oil | | 32.36 | 68 | -0.22 | 0.9 | 18.49% |
| IYE | Energy | | 50.19 | 68 | 0.02 | 1.23 | 13.76% |
| PBW | Clean Energy | | 19.67 | 20 | -0.41 | 2.39 | -33.82% |
| ERX | Energy Bull 3X | | 73.08 | 68 | 0.29 | 2.5 | 29.19% |
| ERY | Energy Bear 3X | | 21.04 | 32 | 0.00 | -2.41 | -24.67% |
| DIG | Oil & Gas | | 47.40 | 68 | 0.21 | 2.64 | 29.01% |
| DUG | Short Oil & | | 8.82 | 32 | -0.23 | -2.54 | -24.16% |
| XOP | Oil & Gas | | 156.21 | 68 | 0.47 | 1.94 | 14.1% |
| XES | Oil & Gas | | 91.72 | 68 | -0.75 | 1.31 | 8.53% |
| ICLN | Global Clean Energy | | 13.14 | 20 | -0.90 | 0.92 | -15.61% |
| PSCE | SmallCap Energy | | 55.93 | 58 | -0.22 | 1.4 | 7.46% |
| IEO | Oil&Gas Explor&Prodtn | | 108.35 | 68 | 0.21 | 1.63 | 16.27% |
| 12Stocks.com: Charts, Trends, Fundamental Data and Performances of Energy Stocks | |
|
We now take in-depth look at all Energy stocks including charts, multi-period performances and overall trends (as measured by Smart Investing & Trading Score). One can sort Energy stocks (click link to choose) by Daily, Weekly and by Year-to-Date performances. Also, one can sort by size of the company or by market capitalization. |
| Select Your Default Chart Type: | |||||
| |||||
| Click on stock symbol or name for detailed view. Click on to add stock symbol to your watchlist and to view watchlist. Quick View: Move mouse or cursor over "Daily" to quickly view daily Technical stock chart and over "Weekly" to view weekly Technical stock chart. | |||||

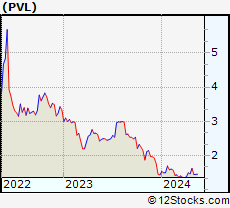 | PVL Permianville Royalty Trust |
| Sector: Energy | |
| SubSector: Independent Oil & Gas | |
| MarketCap: 40.9593 Millions | |
| Recent Price: 1.66 Smart Investing & Trading Score: 100 | |
| Day Percent Change: 0.00% Day Change: 0.00 | |
| Week Change: 12.93% Year-to-date Change: 15.3% | |
| PVL Links: Profile News Message Board | |
| Charts:- Daily , Weekly | |
| Add PVL to Watchlist: View: Get Complete PVL Trend Analysis ➞ | |
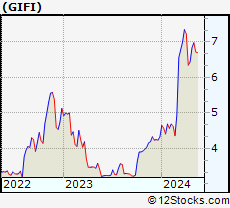 | GIFI Gulf Island Fabrication, Inc. |
| Sector: Energy | |
| SubSector: Oil & Gas Equipment & Services | |
| MarketCap: 53.1461 Millions | |
| Recent Price: 6.82 Smart Investing & Trading Score: 68 | |
| Day Percent Change: -0.44% Day Change: -0.03 | |
| Week Change: 5.9% Year-to-date Change: 57.5% | |
| GIFI Links: Profile News Message Board | |
| Charts:- Daily , Weekly | |
| Add GIFI to Watchlist: View: Get Complete GIFI Trend Analysis ➞ | |
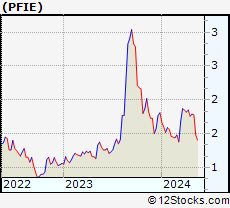 | PFIE Profire Energy, Inc. |
| Sector: Energy | |
| SubSector: Oil & Gas Equipment & Services | |
| MarketCap: 42.6461 Millions | |
| Recent Price: 1.85 Smart Investing & Trading Score: 83 | |
| Day Percent Change: -1.07% Day Change: -0.02 | |
| Week Change: 5.11% Year-to-date Change: 2.2% | |
| PFIE Links: Profile News Message Board | |
| Charts:- Daily , Weekly | |
| Add PFIE to Watchlist: View: Get Complete PFIE Trend Analysis ➞ | |
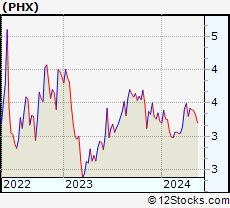 | PHX Panhandle Oil and Gas Inc. |
| Sector: Energy | |
| SubSector: Independent Oil & Gas | |
| MarketCap: 62.2593 Millions | |
| Recent Price: 3.53 Smart Investing & Trading Score: 85 | |
| Day Percent Change: 6.01% Day Change: 0.20 | |
| Week Change: 3.22% Year-to-date Change: 9.6% | |
| PHX Links: Profile News Message Board | |
| Charts:- Daily , Weekly | |
| Add PHX to Watchlist: View: Get Complete PHX Trend Analysis ➞ | |
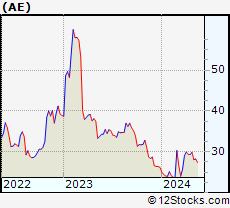 | AE Adams Resources & Energy, Inc. |
| Sector: Energy | |
| SubSector: Oil & Gas Refining & Marketing | |
| MarketCap: 76.7354 Millions | |
| Recent Price: 30.00 Smart Investing & Trading Score: 73 | |
| Day Percent Change: 2.39% Day Change: 0.70 | |
| Week Change: 2.32% Year-to-date Change: 14.6% | |
| AE Links: Profile News Message Board | |
| Charts:- Daily , Weekly | |
| Add AE to Watchlist: View: Get Complete AE Trend Analysis ➞ | |
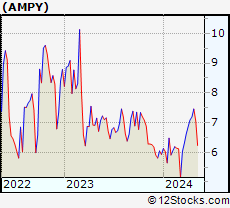 | AMPY Amplify Energy Corp. |
| Sector: Energy | |
| SubSector: Independent Oil & Gas | |
| MarketCap: 34.2593 Millions | |
| Recent Price: 7.33 Smart Investing & Trading Score: 83 | |
| Day Percent Change: -0.68% Day Change: -0.05 | |
| Week Change: 1.95% Year-to-date Change: 23.6% | |
| AMPY Links: Profile News Message Board | |
| Charts:- Daily , Weekly | |
| Add AMPY to Watchlist: View: Get Complete AMPY Trend Analysis ➞ | |
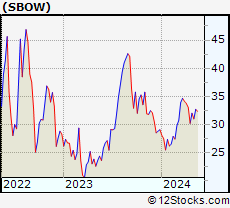 | SBOW SilverBow Resources, Inc. |
| Sector: Energy | |
| SubSector: Independent Oil & Gas | |
| MarketCap: 25.9593 Millions | |
| Recent Price: 30.74 Smart Investing & Trading Score: 51 | |
| Day Percent Change: 0.69% Day Change: 0.21 | |
| Week Change: 1.72% Year-to-date Change: 5.7% | |
| SBOW Links: Profile News Message Board | |
| Charts:- Daily , Weekly | |
| Add SBOW to Watchlist: View: Get Complete SBOW Trend Analysis ➞ | |
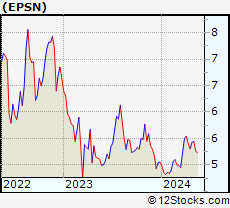 | EPSN Epsilon Energy Ltd. |
| Sector: Energy | |
| SubSector: Independent Oil & Gas | |
| MarketCap: 72.1593 Millions | |
| Recent Price: 5.38 Smart Investing & Trading Score: 73 | |
| Day Percent Change: -0.37% Day Change: -0.02 | |
| Week Change: 1.41% Year-to-date Change: 6.4% | |
| EPSN Links: Profile News Message Board | |
| Charts:- Daily , Weekly | |
| Add EPSN to Watchlist: View: Get Complete EPSN Trend Analysis ➞ | |
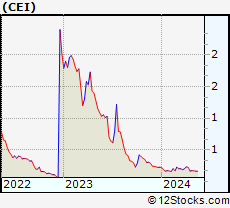 | CEI Camber Energy, Inc. |
| Sector: Energy | |
| SubSector: Oil & Gas Drilling & Exploration | |
| MarketCap: 42.3139 Millions | |
| Recent Price: 0.17 Smart Investing & Trading Score: 23 | |
| Day Percent Change: -4.26% Day Change: -0.01 | |
| Week Change: 1.26% Year-to-date Change: -26.2% | |
| CEI Links: Profile News Message Board | |
| Charts:- Daily , Weekly | |
| Add CEI to Watchlist: View: Get Complete CEI Trend Analysis ➞ | |
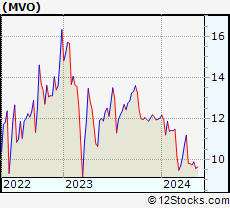 | MVO MV Oil Trust |
| Sector: Energy | |
| SubSector: Independent Oil & Gas | |
| MarketCap: 24.3593 Millions | |
| Recent Price: 9.90 Smart Investing & Trading Score: 25 | |
| Day Percent Change: 3.66% Day Change: 0.35 | |
| Week Change: 1.12% Year-to-date Change: -17.6% | |
| MVO Links: Profile News Message Board | |
| Charts:- Daily , Weekly | |
| Add MVO to Watchlist: View: Get Complete MVO Trend Analysis ➞ | |
 | GTE Gran Tierra Energy Inc. |
| Sector: Energy | |
| SubSector: Independent Oil & Gas | |
| MarketCap: 87.0593 Millions | |
| Recent Price: 8.26 Smart Investing & Trading Score: 88 | |
| Day Percent Change: 1.35% Day Change: 0.11 | |
| Week Change: 1.1% Year-to-date Change: 46.5% | |
| GTE Links: Profile News Message Board | |
| Charts:- Daily , Weekly | |
| Add GTE to Watchlist: View: Get Complete GTE Trend Analysis ➞ | |
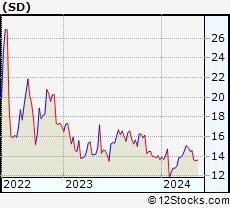 | SD SandRidge Energy, Inc. |
| Sector: Energy | |
| SubSector: Oil & Gas Drilling & Exploration | |
| MarketCap: 33.6139 Millions | |
| Recent Price: 14.66 Smart Investing & Trading Score: 48 | |
| Day Percent Change: -0.61% Day Change: -0.09 | |
| Week Change: 0.89% Year-to-date Change: 7.2% | |
| SD Links: Profile News Message Board | |
| Charts:- Daily , Weekly | |
| Add SD to Watchlist: View: Get Complete SD Trend Analysis ➞ | |
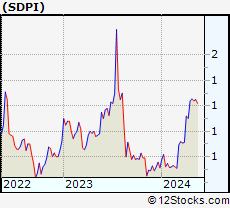 | SDPI Superior Drilling Products, Inc. |
| Sector: Energy | |
| SubSector: Oil & Gas Equipment & Services | |
| MarketCap: 9.55461 Millions | |
| Recent Price: 1.25 Smart Investing & Trading Score: 90 | |
| Day Percent Change: 0.00% Day Change: 0.00 | |
| Week Change: 0.81% Year-to-date Change: 75.1% | |
| SDPI Links: Profile News Message Board | |
| Charts:- Daily , Weekly | |
| Add SDPI to Watchlist: View: Get Complete SDPI Trend Analysis ➞ | |
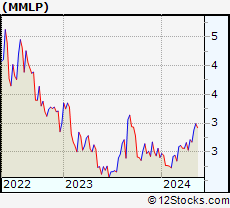 | MMLP Martin Midstream Partners L.P. |
| Sector: Energy | |
| SubSector: Oil & Gas Pipelines | |
| MarketCap: 55.8855 Millions | |
| Recent Price: 2.73 Smart Investing & Trading Score: 50 | |
| Day Percent Change: 5.00% Day Change: 0.13 | |
| Week Change: 0.74% Year-to-date Change: 13.8% | |
| MMLP Links: Profile News Message Board | |
| Charts:- Daily , Weekly | |
| Add MMLP to Watchlist: View: Get Complete MMLP Trend Analysis ➞ | |
 | TTI TETRA Technologies, Inc. |
| Sector: Energy | |
| SubSector: Oil & Gas Equipment & Services | |
| MarketCap: 56.9461 Millions | |
| Recent Price: 4.45 Smart Investing & Trading Score: 54 | |
| Day Percent Change: -0.67% Day Change: -0.03 | |
| Week Change: 0.68% Year-to-date Change: -1.6% | |
| TTI Links: Profile News Message Board | |
| Charts:- Daily , Weekly | |
| Add TTI to Watchlist: View: Get Complete TTI Trend Analysis ➞ | |
 | TUSK Mammoth Energy Services, Inc. |
| Sector: Energy | |
| SubSector: Oil & Gas Drilling & Exploration | |
| MarketCap: 59.5139 Millions | |
| Recent Price: 3.35 Smart Investing & Trading Score: 42 | |
| Day Percent Change: -0.89% Day Change: -0.03 | |
| Week Change: 0.6% Year-to-date Change: -24.9% | |
| TUSK Links: Profile News Message Board | |
| Charts:- Daily , Weekly | |
| Add TUSK to Watchlist: View: Get Complete TUSK Trend Analysis ➞ | |
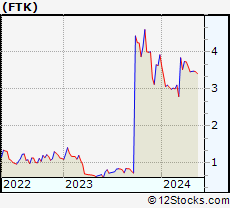 | FTK Flotek Industries, Inc. |
| Sector: Energy | |
| SubSector: Oil & Gas Equipment & Services | |
| MarketCap: 66.3461 Millions | |
| Recent Price: 3.48 Smart Investing & Trading Score: 44 | |
| Day Percent Change: 0.58% Day Change: 0.02 | |
| Week Change: 0.58% Year-to-date Change: -11.2% | |
| FTK Links: Profile News Message Board | |
| Charts:- Daily , Weekly | |
| Add FTK to Watchlist: View: Get Complete FTK Trend Analysis ➞ | |
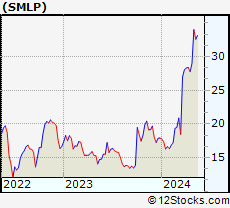 | SMLP Summit Midstream Partners, LP |
| Sector: Energy | |
| SubSector: Oil & Gas Pipelines | |
| MarketCap: 74.5855 Millions | |
| Recent Price: 27.91 Smart Investing & Trading Score: 61 | |
| Day Percent Change: -0.25% Day Change: -0.07 | |
| Week Change: 0.54% Year-to-date Change: 55.8% | |
| SMLP Links: Profile News Message Board | |
| Charts:- Daily , Weekly | |
| Add SMLP to Watchlist: View: Get Complete SMLP Trend Analysis ➞ | |
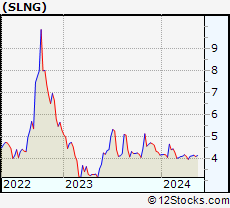 | SLNG Stabilis Energy, Inc. |
| Sector: Energy | |
| SubSector: Oil & Gas Pipelines | |
| MarketCap: 13.4855 Millions | |
| Recent Price: 4.14 Smart Investing & Trading Score: 52 | |
| Day Percent Change: 0.00% Day Change: 0.00 | |
| Week Change: 0.49% Year-to-date Change: -0.8% | |
| SLNG Links: Profile News Message Board | |
| Charts:- Daily , Weekly | |
| Add SLNG to Watchlist: View: Get Complete SLNG Trend Analysis ➞ | |
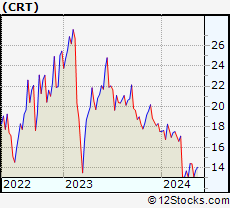 | CRT Cross Timbers Royalty Trust |
| Sector: Energy | |
| SubSector: Oil & Gas Drilling & Exploration | |
| MarketCap: 34.9139 Millions | |
| Recent Price: 14.48 Smart Investing & Trading Score: 67 | |
| Day Percent Change: -0.34% Day Change: -0.05 | |
| Week Change: 0.45% Year-to-date Change: -17.6% | |
| CRT Links: Profile News Message Board | |
| Charts:- Daily , Weekly | |
| Add CRT to Watchlist: View: Get Complete CRT Trend Analysis ➞ | |
 | EPM Evolution Petroleum Corporation |
| Sector: Energy | |
| SubSector: Independent Oil & Gas | |
| MarketCap: 98.0593 Millions | |
| Recent Price: 5.75 Smart Investing & Trading Score: 54 | |
| Day Percent Change: 0.70% Day Change: 0.04 | |
| Week Change: 0.35% Year-to-date Change: -1.0% | |
| EPM Links: Profile News Message Board | |
| Charts:- Daily , Weekly | |
| Add EPM to Watchlist: View: Get Complete EPM Trend Analysis ➞ | |
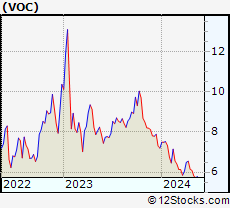 | VOC VOC Energy Trust |
| Sector: Energy | |
| SubSector: Independent Oil & Gas | |
| MarketCap: 40.3593 Millions | |
| Recent Price: 6.17 Smart Investing & Trading Score: 37 | |
| Day Percent Change: 0.00% Day Change: 0.00 | |
| Week Change: 0.33% Year-to-date Change: -14.3% | |
| VOC Links: Profile News Message Board | |
| Charts:- Daily , Weekly | |
| Add VOC to Watchlist: View: Get Complete VOC Trend Analysis ➞ | |
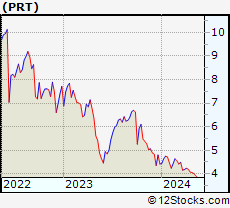 | PRT PermRock Royalty Trust |
| Sector: Energy | |
| SubSector: Oil & Gas Equipment & Services | |
| MarketCap: 18.5461 Millions | |
| Recent Price: 4.09 Smart Investing & Trading Score: 45 | |
| Day Percent Change: 0.00% Day Change: 0.00 | |
| Week Change: 0.25% Year-to-date Change: -7.5% | |
| PRT Links: Profile News Message Board | |
| Charts:- Daily , Weekly | |
| Add PRT to Watchlist: View: Get Complete PRT Trend Analysis ➞ | |
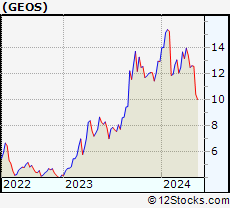 | GEOS Geospace Technologies Corporation |
| Sector: Energy | |
| SubSector: Oil & Gas Equipment & Services | |
| MarketCap: 78.8461 Millions | |
| Recent Price: 12.48 Smart Investing & Trading Score: 18 | |
| Day Percent Change: -0.40% Day Change: -0.05 | |
| Week Change: -0.24% Year-to-date Change: -3.7% | |
| GEOS Links: Profile News Message Board | |
| Charts:- Daily , Weekly | |
| Add GEOS to Watchlist: View: Get Complete GEOS Trend Analysis ➞ | |
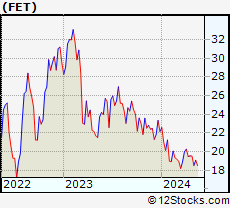 | FET Forum Energy Technologies, Inc. |
| Sector: Energy | |
| SubSector: Oil & Gas Equipment & Services | |
| MarketCap: 26.7461 Millions | |
| Recent Price: 19.45 Smart Investing & Trading Score: 38 | |
| Day Percent Change: -0.26% Day Change: -0.05 | |
| Week Change: -0.51% Year-to-date Change: -12.3% | |
| FET Links: Profile News Message Board | |
| Charts:- Daily , Weekly | |
| Add FET to Watchlist: View: Get Complete FET Trend Analysis ➞ | |
| For tabular summary view of above stock list: Summary View ➞ 0 - 25 , 25 - 50 | ||
| Click To Change The Sort Order: By Market Cap or Company Size Performance: Year-to-date, Week and Day | |
| Select Chart Type: | ||
|
Best Stocks Today 12Stocks.com |
© 2024 12Stocks.com Terms & Conditions Privacy Contact Us
All Information Provided Only For Education And Not To Be Used For Investing or Trading. See Terms & Conditions


One More Thing ... Get Best Stocks Delivered Daily!
Never Ever Miss A Move With Our Top Ten Stocks Lists
Find Best Stocks In Any Market - Bull or Bear Market
Take A Peek At Our Top Ten Stocks Lists: Daily, Weekly, Year-to-Date & Top Trends
Find Best Stocks In Any Market - Bull or Bear Market
Take A Peek At Our Top Ten Stocks Lists: Daily, Weekly, Year-to-Date & Top Trends
Energy Stocks With Best Up Trends [0-bearish to 100-bullish]: EQT [100], Comstock Resources[100], Range Resources[100], National Fuel[100], Southwestern [100], Genesis [100], Hess [100], Antero Resources[100], Chevron [100], Natural Gas[100], Calumet Specialty[100]
Best Energy Stocks Year-to-Date:
Indonesia [58.63%], Natural Gas[50.93%], Antero Resources[38.62%], Kodiak Gas[37.86%], Targa Resources[34.57%], Marathon [34.23%], Atlas [33%], Enerplus [32.46%], Diamondback [32.34%], Equitrans Midstream[32.02%], NextDecade [31.87%] Best Energy Stocks This Week:
Star [9.03%], Equitrans Midstream[7.95%], EQT [7.59%], Antero Resources[7.34%], Range Resources[7.09%], Comstock Resources[6.62%], Genesis [6.02%], Nabors Industries[4.7%], North American[4.28%], YPF Sociedad[4.24%], NGL [4.17%] Best Energy Stocks Daily:
Tellurian [7.47%], Equitrans Midstream[4.27%], Indonesia [4.01%], EQT [3.82%], Comstock Resources[3.41%], Range Resources[3.25%], National Fuel[2.83%], Southwestern [2.71%], Chesapeake [2.44%], NGL [2.22%], Kosmos [2.06%]