
 Login Sign Up


| |||||
 |  | ||||

| 12Stocks.com Market Intelligence |
Best Emerging Markets Stocks
| In a hurry? Emerging Markets Stocks Lists: Trends Table, Stock Charts
Sort Emerging Markets stocks: Daily, Weekly, Year-to-Date, Market Cap & Trends. Filter Emerging Markets stocks list by sector: Show all, Tech, Finance, Energy, Staples, Retail, Industrial, Materials, Utilities and HealthCare Filter Emerging Markets stocks list by size:All Large Medium Small |
| 12Stocks.com Emerging Markets Stocks Performances & Trends Daily | |||||||||
|
|  The overall Smart Investing & Trading Score is 68 (0-bearish to 100-bullish) which puts Emerging Markets index in short term neutral to bullish trend. The Smart Investing & Trading Score from previous trading session is 63 and an improvement of trend continues.
| ||||||||
Here are the Smart Investing & Trading Scores of the most requested Emerging Markets stocks at 12Stocks.com (click stock name for detailed review):
|


| 12Stocks.com: Top Performing Emerging Markets Index Stocks | ||||||||||||||||||||||||||||||||||||||||||||||||
 The top performing Emerging Markets Index stocks year to date are
Now, more recently, over last week, the top performing Emerging Markets Index stocks on the move are


|
||||||||||||||||||||||||||||||||||||||||||||||||
| 12Stocks.com: Investing in Emerging Markets Index with Stocks | |
|
The following table helps investors and traders sort through current performance and trends (as measured by Smart Investing & Trading Score ) of various
stocks in the Emerging Markets Index. Quick View: Move mouse or cursor over stock symbol (ticker) to view short-term technical chart and over stock name to view long term chart. Click on  to add stock symbol to your watchlist and to add stock symbol to your watchlist and  to view watchlist. Click on any ticker or stock name for detailed market intelligence report for that stock. to view watchlist. Click on any ticker or stock name for detailed market intelligence report for that stock. |
12Stocks.com Performance of Stocks in Emerging Markets Index
| Ticker | Stock Name | Watchlist | Category | Recent Price | Smart Investing & Trading Score | Change % | YTD Change% |
| BIDU | Baidu |   | Technology | 99.02 | 49 | 0.80% | -16.85% |
| BEST | BEST | | Consumer Staples | 2.12 | 10 | 1.44% | -16.91% |
| ABEV | Ambev S.A | | Consumer Staples | 2.33 | 27 | 1.09% | -16.96% |
| MOMO | Momo | | Technology | 5.77 | 49 | 0.87% | -16.98% |
| CNF | CNFinance | | Financials | 1.83 | 10 | -0.27% | -17.57% |
| HKD | AMTD Digital | | Technology | 3.38 | 59 | 8.33% | -18.16% |
| HIMX | Himax | | Technology | 4.91 | 32 | 0.00% | -19.11% |
| BSBR | Banco Santander | | Financials | 5.28 | 34 | -0.28% | -19.47% |
| BGNE | BeiGene | | Health Care | 143.86 | 49 | 3.50% | -20.24% |
| DDL | Dingdong (Cayman) | | Consumer Staples | 1.21 | 54 | -1.23% | -20.72% |
| GDS | GDS | | Technology | 7.22 | 85 | 6.65% | -20.83% |
| GHG | GreenTree Hospitality | | Services & Goods | 2.97 | 10 | 0.00% | -21.01% |
| XP | XP | | Financials | 20.50 | 10 | -0.34% | -21.37% |
| STG | Sunlands | | Services & Goods | 7.94 | 10 | 0.00% | -21.93% |
| UCL | uCloudlink | | Technology | 1.44 | 30 | 0.00% | -22.16% |
| VALE | Vale S.A | | Materials | 12.30 | 57 | 0.70% | -22.48% |
| WB | | Technology | 8.36 | 85 | 2.83% | -23.65% | |
| BBD | Banco Bradesco | | Financials | 2.65 | 25 | -0.38% | -24.29% |
| AFYA | Afya | | Services & Goods | 16.59 | 20 | 0.94% | -24.37% |
| PERF | Perfect | | Technology | 2.33 | 46 | 0.00% | -24.84% |
| KC | Kingsoft Cloud | | Technology | 2.83 | 80 | -0.18% | -25.36% |
| CINT | CI&T | | Technology | 3.95 | 10 | 1.02% | -25.82% |
| EDTK | Skillful Craftsman | | Consumer Staples | 0.93 | 25 | 0.00% | -26.34% |
| GGB | Gerdau S.A | | Materials | 3.54 | 10 | -3.28% | -27.01% |
| BBDO | Banco Bradesco | | Financials | 2.32 | 27 | -1.07% | -27.05% |
| For chart view version of above stock list: Chart View ➞ 0 - 25 , 25 - 50 , 50 - 75 , 75 - 100 , 100 - 125 , 125 - 150 , 150 - 175 , 175 - 200 | ||
 | Click To Change The Sort Order: By Market Cap or Company Size Performance: Year-to-date, Week and Day |  |
|
Get the most comprehensive stock market coverage daily at 12Stocks.com ➞ Best Stocks Today ➞ Best Stocks Weekly ➞ Best Stocks Year-to-Date ➞ Best Stocks Trends ➞  Best Stocks Today 12Stocks.com Best Nasdaq Stocks ➞ Best S&P 500 Stocks ➞ Best Tech Stocks ➞ Best Biotech Stocks ➞ |
| Detailed Overview of Emerging Markets Stocks |
| Emerging Markets Technical Overview, Leaders & Laggards, Top Emerging Markets ETF Funds & Detailed Emerging Markets Stocks List, Charts, Trends & More |
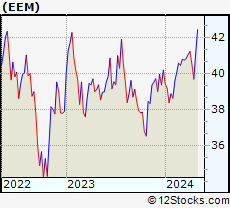
| Emerging Markets: Technical Analysis, Trends & YTD Performance | |
 EEM Weekly Chart |
|
| Long Term Trend: Very Good | |
| Medium Term Trend: Not Good | |
 EEM Daily Chart |
|
| Short Term Trend: Very Good | |
| Overall Trend Score: 68 | |
| YTD Performance: 0.99% | |
| **Trend Scores & Views Are Only For Educational Purposes And Not For Investing | |
| 12Stocks.com: Investing in Emerging Markets Index using Exchange Traded Funds | |
|
The following table shows list of key exchange traded funds (ETF) that
help investors play Emerging Markets stock market. For detailed view, check out our ETF Funds section of our website. Quick View: Move mouse or cursor over ETF symbol (ticker) to view short-term technical chart and over ETF name to view long term chart. Click on ticker or stock name for detailed view. Click on to add stock symbol to your watchlist and to view watchlist. |
12Stocks.com List of ETFs that track Emerging Markets Index
| Ticker | ETF Name | Watchlist | Recent Price | Smart Investing & Trading Score | Change % | Week % | Year-to-date % |
| EEM | Emerging Markets | | 40.61 | 68 | 0.35 | 2.27 | 0.99% |
| VWO | Emerging Markets | | 41.69 | 68 | 0.26 | 1.96 | 1.44% |
| SCHE | Emerging Markets Equity | | 25.16 | 68 | 0.26 | 1.92 | 1.51% |
| EWX | Emerging Markets Small | | 55.73 | 36 | 0.11 | 1.02 | -1.29% |
| EET | Emerging Markets | | 49.83 | 68 | 1.03 | 4.43 | -2.03% |
| EDC | Emrg Mkts Bull | | 28.87 | 63 | 0.70 | 6.65 | -5.13% |
| EEV | Short Emerging | | 19.69 | 32 | -0.35 | -4.03 | -0.17% |
| EUM | Short Emerging | | 14.19 | 32 | -0.23 | -2.08 | 0.28% |
| EDIV | Emerging Markets Dividend | | 33.16 | 36 | 0.45 | 0.45 | 1.97% |
| EMIF | Emerging Markets Infrastructure | | 21.87 | 61 | 1.16 | 2.29 | 2.2% |
| CEW | Emerging Currency Strat | | 17.61 | 31 | -0.03 | 0.03 | -2.19% |
| EBND | Em Mkts Lcl | | 19.92 | 20 | -0.50 | -0.05 | -6.21% |
| EMCB | Emerging Markets Corp | | 63.88 | 31 | -0.38 | 0.45 | -0.04% |
| VWOB | Emerging Mkts Govt | | 62.26 | 30 | -0.73 | -0.11 | -2.34% |
| EEMA | Emerging Markets Asia | | 67.73 | 61 | 0.37 | 2.48 | 2.45% |
| EELV | Em Mkts Low | | 23.30 | 31 | -0.69 | 0.6 | -3.08% |
| DVYE | Emerging Markets Dividend | | 26.50 | 56 | -0.23 | 0.08 | 0.04% |
| SDEM | SuperDividend Em Mkts | | 25.24 | 26 | -0.24 | -2.4 | 1.79% |
| DBEM | Em Mkts Hdgd | | 23.64 | 46 | 0.42 | 2.34 | 2.47% |
| PCY | Emerging Markets Sov | | 19.68 | 25 | -1.00 | -0.65 | -4.55% |
| QEMM | Emerging Mkts StratcFacts | | 56.67 | 41 | -0.46 | 0.91 | -0.85% |
| 12Stocks.com: Charts, Trends, Fundamental Data and Performances of Emerging Markets Stocks | |
|
We now take in-depth look at all Emerging Markets stocks including charts, multi-period performances and overall trends (as measured by Smart Investing & Trading Score ). One can sort Emerging Markets stocks (click link to choose) by Daily, Weekly and by Year-to-Date performances. Also, one can sort by size of the company or by market capitalization. |
| Select Your Default Chart Type: | |||||
| |||||
| Click on stock symbol or name for detailed view. Click on to add stock symbol to your watchlist and to view watchlist. Quick View: Move mouse or cursor over "Daily" to quickly view daily technical stock chart and over "Weekly" to view weekly technical stock chart. | |||||

 | BIDU Baidu, Inc. |
| Sector: Technology | |
| SubSector: Internet Information Providers | |
| MarketCap: 33525.9 Millions | |
| Recent Price: 99.02 Smart Investing & Trading Score : 49 | |
| Day Percent Change: 0.80% Day Change: 0.79 | |
| Week Change: 4.18% Year-to-date Change: -16.9% | |
| BIDU Links: Profile News Message Board | |
| Charts:- Daily , Weekly | |
| Add BIDU to Watchlist: View: Get Complete BIDU Trend Analysis ➞ | |
 | BEST BEST Inc. |
| Sector: Consumer Staples | |
| SubSector: Packaging & Containers | |
| MarketCap: 1981.73 Millions | |
| Recent Price: 2.12 Smart Investing & Trading Score : 10 | |
| Day Percent Change: 1.44% Day Change: 0.03 | |
| Week Change: 1.92% Year-to-date Change: -16.9% | |
| BEST Links: Profile News Message Board | |
| Charts:- Daily , Weekly | |
| Add BEST to Watchlist: View: Get Complete BEST Trend Analysis ➞ | |
 | ABEV Ambev S.A. |
| Sector: Consumer Staples | |
| SubSector: Beverages - Brewers | |
| MarketCap: 37753.5 Millions | |
| Recent Price: 2.33 Smart Investing & Trading Score : 27 | |
| Day Percent Change: 1.09% Day Change: 0.03 | |
| Week Change: 1.53% Year-to-date Change: -17.0% | |
| ABEV Links: Profile News Message Board | |
| Charts:- Daily , Weekly | |
| Add ABEV to Watchlist: View: Get Complete ABEV Trend Analysis ➞ | |
 | MOMO Momo Inc. |
| Sector: Technology | |
| SubSector: Internet Software & Services | |
| MarketCap: 4796.71 Millions | |
| Recent Price: 5.77 Smart Investing & Trading Score : 49 | |
| Day Percent Change: 0.87% Day Change: 0.05 | |
| Week Change: 3.22% Year-to-date Change: -17.0% | |
| MOMO Links: Profile News Message Board | |
| Charts:- Daily , Weekly | |
| Add MOMO to Watchlist: View: Get Complete MOMO Trend Analysis ➞ | |
 | CNF CNFinance Holdings Limited |
| Sector: Financials | |
| SubSector: Credit Services | |
| MarketCap: 277.408 Millions | |
| Recent Price: 1.83 Smart Investing & Trading Score : 10 | |
| Day Percent Change: -0.27% Day Change: 0.00 | |
| Week Change: -0.54% Year-to-date Change: -17.6% | |
| CNF Links: Profile News Message Board | |
| Charts:- Daily , Weekly | |
| Add CNF to Watchlist: View: Get Complete CNF Trend Analysis ➞ | |
 | HKD AMTD Digital Inc. |
| Sector: Technology | |
| SubSector: Software - Application | |
| MarketCap: 1200 Millions | |
| Recent Price: 3.38 Smart Investing & Trading Score : 59 | |
| Day Percent Change: 8.33% Day Change: 0.26 | |
| Week Change: 9.74% Year-to-date Change: -18.2% | |
| HKD Links: Profile News Message Board | |
| Charts:- Daily , Weekly | |
| Add HKD to Watchlist: View: Get Complete HKD Trend Analysis ➞ | |
 | HIMX Himax Technologies, Inc. |
| Sector: Technology | |
| SubSector: Semiconductor - Specialized | |
| MarketCap: 496.16 Millions | |
| Recent Price: 4.91 Smart Investing & Trading Score : 32 | |
| Day Percent Change: 0.00% Day Change: 0.00 | |
| Week Change: 1.66% Year-to-date Change: -19.1% | |
| HIMX Links: Profile News Message Board | |
| Charts:- Daily , Weekly | |
| Add HIMX to Watchlist: View: Get Complete HIMX Trend Analysis ➞ | |
 | BSBR Banco Santander (Brasil) S.A. |
| Sector: Financials | |
| SubSector: Foreign Regional Banks | |
| MarketCap: 21961.4 Millions | |
| Recent Price: 5.28 Smart Investing & Trading Score : 34 | |
| Day Percent Change: -0.28% Day Change: -0.01 | |
| Week Change: 0.48% Year-to-date Change: -19.5% | |
| BSBR Links: Profile News Message Board | |
| Charts:- Daily , Weekly | |
| Add BSBR to Watchlist: View: Get Complete BSBR Trend Analysis ➞ | |
 | BGNE BeiGene, Ltd. |
| Sector: Health Care | |
| SubSector: Biotechnology | |
| MarketCap: 10838.5 Millions | |
| Recent Price: 143.86 Smart Investing & Trading Score : 49 | |
| Day Percent Change: 3.50% Day Change: 4.87 | |
| Week Change: 11.07% Year-to-date Change: -20.2% | |
| BGNE Links: Profile News Message Board | |
| Charts:- Daily , Weekly | |
| Add BGNE to Watchlist: View: Get Complete BGNE Trend Analysis ➞ | |
 | DDL Dingdong (Cayman) Limited |
| Sector: Consumer Staples | |
| SubSector: Grocery Stores | |
| MarketCap: 708 Millions | |
| Recent Price: 1.21 Smart Investing & Trading Score : 54 | |
| Day Percent Change: -1.23% Day Change: -0.01 | |
| Week Change: 4.78% Year-to-date Change: -20.7% | |
| DDL Links: Profile News Message Board | |
| Charts:- Daily , Weekly | |
| Add DDL to Watchlist: View: Get Complete DDL Trend Analysis ➞ | |
 | GDS GDS Holdings Limited |
| Sector: Technology | |
| SubSector: Data Storage Devices | |
| MarketCap: 8597.99 Millions | |
| Recent Price: 7.22 Smart Investing & Trading Score : 85 | |
| Day Percent Change: 6.65% Day Change: 0.45 | |
| Week Change: 14.24% Year-to-date Change: -20.8% | |
| GDS Links: Profile News Message Board | |
| Charts:- Daily , Weekly | |
| Add GDS to Watchlist: View: Get Complete GDS Trend Analysis ➞ | |
 | GHG GreenTree Hospitality Group Ltd. |
| Sector: Services & Goods | |
| SubSector: Lodging | |
| MarketCap: 1195.36 Millions | |
| Recent Price: 2.97 Smart Investing & Trading Score : 10 | |
| Day Percent Change: 0.00% Day Change: 0.00 | |
| Week Change: 4.8% Year-to-date Change: -21.0% | |
| GHG Links: Profile News Message Board | |
| Charts:- Daily , Weekly | |
| Add GHG to Watchlist: View: Get Complete GHG Trend Analysis ➞ | |
 | XP XP Inc. |
| Sector: Financials | |
| SubSector: Asset Management | |
| MarketCap: 12990.3 Millions | |
| Recent Price: 20.50 Smart Investing & Trading Score : 10 | |
| Day Percent Change: -0.34% Day Change: -0.07 | |
| Week Change: -2.47% Year-to-date Change: -21.4% | |
| XP Links: Profile News Message Board | |
| Charts:- Daily , Weekly | |
| Add XP to Watchlist: View: Get Complete XP Trend Analysis ➞ | |
 | STG Sunlands Technology Group |
| Sector: Services & Goods | |
| SubSector: Education & Training Services | |
| MarketCap: 295.706 Millions | |
| Recent Price: 7.94 Smart Investing & Trading Score : 10 | |
| Day Percent Change: 0.00% Day Change: 0.00 | |
| Week Change: -2.76% Year-to-date Change: -21.9% | |
| STG Links: Profile News Message Board | |
| Charts:- Daily , Weekly | |
| Add STG to Watchlist: View: Get Complete STG Trend Analysis ➞ | |
 | UCL uCloudlink Group Inc. |
| Sector: Technology | |
| SubSector: Telecom Services | |
| MarketCap: 35837 Millions | |
| Recent Price: 1.44 Smart Investing & Trading Score : 30 | |
| Day Percent Change: 0.00% Day Change: 0.00 | |
| Week Change: 4.73% Year-to-date Change: -22.2% | |
| UCL Links: Profile News Message Board | |
| Charts:- Daily , Weekly | |
| Add UCL to Watchlist: View: Get Complete UCL Trend Analysis ➞ | |
 | VALE Vale S.A. |
| Sector: Materials | |
| SubSector: Industrial Metals & Minerals | |
| MarketCap: 43601 Millions | |
| Recent Price: 12.30 Smart Investing & Trading Score : 57 | |
| Day Percent Change: 0.70% Day Change: 0.08 | |
| Week Change: 0.94% Year-to-date Change: -22.5% | |
| VALE Links: Profile News Message Board | |
| Charts:- Daily , Weekly | |
| Add VALE to Watchlist: View: Get Complete VALE Trend Analysis ➞ | |
 | WB Weibo Corporation |
| Sector: Technology | |
| SubSector: Internet Information Providers | |
| MarketCap: 8164.6 Millions | |
| Recent Price: 8.36 Smart Investing & Trading Score : 85 | |
| Day Percent Change: 2.83% Day Change: 0.23 | |
| Week Change: 5.82% Year-to-date Change: -23.7% | |
| WB Links: Profile News Message Board | |
| Charts:- Daily , Weekly | |
| Add WB to Watchlist: View: Get Complete WB Trend Analysis ➞ | |
 | BBD Banco Bradesco S.A. |
| Sector: Financials | |
| SubSector: Foreign Regional Banks | |
| MarketCap: 30281.7 Millions | |
| Recent Price: 2.65 Smart Investing & Trading Score : 25 | |
| Day Percent Change: -0.38% Day Change: -0.01 | |
| Week Change: 0.38% Year-to-date Change: -24.3% | |
| BBD Links: Profile News Message Board | |
| Charts:- Daily , Weekly | |
| Add BBD to Watchlist: View: Get Complete BBD Trend Analysis ➞ | |
 | AFYA Afya Limited |
| Sector: Services & Goods | |
| SubSector: Education & Training Services | |
| MarketCap: 1559.26 Millions | |
| Recent Price: 16.59 Smart Investing & Trading Score : 20 | |
| Day Percent Change: 0.94% Day Change: 0.16 | |
| Week Change: 3.66% Year-to-date Change: -24.4% | |
| AFYA Links: Profile News Message Board | |
| Charts:- Daily , Weekly | |
| Add AFYA to Watchlist: View: Get Complete AFYA Trend Analysis ➞ | |
 | PERF Perfect Corp. |
| Sector: Technology | |
| SubSector: Software - Application | |
| MarketCap: 582 Millions | |
| Recent Price: 2.33 Smart Investing & Trading Score : 46 | |
| Day Percent Change: 0.00% Day Change: 0.00 | |
| Week Change: 1.3% Year-to-date Change: -24.8% | |
| PERF Links: Profile News Message Board | |
| Charts:- Daily , Weekly | |
| Add PERF to Watchlist: View: Get Complete PERF Trend Analysis ➞ | |
 | KC Kingsoft Cloud Holdings Limited |
| Sector: Technology | |
| SubSector: Software Application | |
| MarketCap: 98487 Millions | |
| Recent Price: 2.83 Smart Investing & Trading Score : 80 | |
| Day Percent Change: -0.18% Day Change: 0.00 | |
| Week Change: 6% Year-to-date Change: -25.4% | |
| KC Links: Profile News Message Board | |
| Charts:- Daily , Weekly | |
| Add KC to Watchlist: View: Get Complete KC Trend Analysis ➞ | |
 | CINT CI&T Inc |
| Sector: Technology | |
| SubSector: Software - Infrastructure | |
| MarketCap: 806 Millions | |
| Recent Price: 3.95 Smart Investing & Trading Score : 10 | |
| Day Percent Change: 1.02% Day Change: 0.04 | |
| Week Change: -2.23% Year-to-date Change: -25.8% | |
| CINT Links: Profile News Message Board | |
| Charts:- Daily , Weekly | |
| Add CINT to Watchlist: View: Get Complete CINT Trend Analysis ➞ | |
 | EDTK Skillful Craftsman Education Technology Limited |
| Sector: Consumer Staples | |
| SubSector: Education & Training Services | |
| MarketCap: 32347 Millions | |
| Recent Price: 0.93 Smart Investing & Trading Score : 25 | |
| Day Percent Change: 0.00% Day Change: 0.00 | |
| Week Change: 1.43% Year-to-date Change: -26.3% | |
| EDTK Links: Profile News Message Board | |
| Charts:- Daily , Weekly | |
| Add EDTK to Watchlist: View: Get Complete EDTK Trend Analysis ➞ | |
 | GGB Gerdau S.A. |
| Sector: Materials | |
| SubSector: Steel & Iron | |
| MarketCap: 3607.48 Millions | |
| Recent Price: 3.54 Smart Investing & Trading Score : 10 | |
| Day Percent Change: -3.28% Day Change: -0.12 | |
| Week Change: -3.28% Year-to-date Change: -27.0% | |
| GGB Links: Profile News Message Board | |
| Charts:- Daily , Weekly | |
| Add GGB to Watchlist: View: Get Complete GGB Trend Analysis ➞ | |
 | BBDO Banco Bradesco S.A. |
| Sector: Financials | |
| SubSector: Foreign Regional Banks | |
| MarketCap: 27711.4 Millions | |
| Recent Price: 2.32 Smart Investing & Trading Score : 27 | |
| Day Percent Change: -1.07% Day Change: -0.03 | |
| Week Change: -0.43% Year-to-date Change: -27.1% | |
| BBDO Links: Profile News Message Board | |
| Charts:- Daily , Weekly | |
| Add BBDO to Watchlist: View: Get Complete BBDO Trend Analysis ➞ | |
| For tabular summary view of above stock list: Summary View ➞ 0 - 25 , 25 - 50 , 50 - 75 , 75 - 100 , 100 - 125 , 125 - 150 , 150 - 175 , 175 - 200 | ||
| Click To Change The Sort Order: By Market Cap or Company Size Performance: Year-to-date, Week and Day | |
| Select Chart Type: | ||
|
Best Stocks Today 12Stocks.com |
© 2024 12Stocks.com Terms & Conditions Privacy Contact Us
All Information Provided Only For Education And Not To Be Used For Investing or Trading. See Terms & Conditions


One More Thing ... Get Best Stocks Delivered Daily!
Never Ever Miss A Move With Our Top Ten Stocks Lists
Find Best Stocks In Any Market - Bull or Bear Market
Take A Peek At Our Top Ten Stocks Lists: Daily, Weekly, Year-to-Date & Top Trends
Find Best Stocks In Any Market - Bull or Bear Market
Take A Peek At Our Top Ten Stocks Lists: Daily, Weekly, Year-to-Date & Top Trends
Emerging Markets Stocks With Best Up Trends [0-bearish to 100-bullish]: Yatsen Holding[100], ZTO Express[100], Alibaba [100], Controladora Vuela[100], JD.com [100], Grupo Aeroportuario[100], Full Truck[100], MINISO [100], Grupo Aeroportuario[100], BRF S.A[100], WiMi Hologram[95]
Best Emerging Markets Stocks Year-to-Date:
U Power[2785.04%], DouYu [802.11%], MicroCloud Hologram[625.18%], China Liberal[498.43%], Yatsen Holding[473.4%], Zhongchao [353.3%], Uxin [180.31%], QuantaSing [105.25%], GigaCloud [102.68%], Cheetah Mobile[80.7%], Yiren Digital[64.74%] Best Emerging Markets Stocks This Week:
WiMi Hologram[29.01%], Aesthetic Medical[21.75%], Bilibili [17.28%], iQIYI [17.01%], Cheetah Mobile[16.38%], Uxin [16.27%], Yatsen Holding[16.04%], GDS [14.24%], Grupo Aeroportuario[13.7%], Baozun [13.36%], Pinduoduo [12.13%] Best Emerging Markets Stocks Daily:
WiMi Hologram[24.07%], Uxin [18.37%], Aesthetic Medical[14.75%], 17 Education[11.49%], Bilibili [11.36%], AMTD Digital[8.33%], Intchains [7.71%], Yatsen Holding[6.74%], GDS [6.65%], 21Vianet [6.08%], TOP Financial[6.05%]