
 Login Sign Up


| |||||
 |  | ||||

| 12Stocks.com Market Intelligence |
Best Emerging Markets Stocks
| In a hurry? Emerging Markets Stocks Lists: Trends Table, Stock Charts
Sort Emerging Markets stocks: Daily, Weekly, Year-to-Date, Market Cap & Trends. Filter Emerging Markets stocks list by sector: Show all, Tech, Finance, Energy, Staples, Retail, Industrial, Materials, Utilities and HealthCare Filter Emerging Markets stocks list by size:All Large Medium Small |
| 12Stocks.com Emerging Markets Stocks Performances & Trends Daily | |||||||||
|
|  The overall Smart Investing & Trading Score is 49 (0-bearish to 100-bullish) which puts Emerging Markets index in short term neutral trend. The Smart Investing & Trading Score from previous trading session is 48 and hence an improvement of trend.
| ||||||||
Here are the Smart Investing & Trading Scores of the most requested Emerging Markets stocks at 12Stocks.com (click stock name for detailed review):
|


| 12Stocks.com: Top Performing Emerging Markets Index Stocks | ||||||||||||||||||||||||||||||||||||||||||||||||
 The top performing Emerging Markets Index stocks year to date are
Now, more recently, over last week, the top performing Emerging Markets Index stocks on the move are


|
||||||||||||||||||||||||||||||||||||||||||||||||
| 12Stocks.com: Investing in Emerging Markets Index with Stocks | |
|
The following table helps investors and traders sort through current performance and trends (as measured by Smart Investing & Trading Score ) of various
stocks in the Emerging Markets Index. Quick View: Move mouse or cursor over stock symbol (ticker) to view short-term technical chart and over stock name to view long term chart. Click on  to add stock symbol to your watchlist and to add stock symbol to your watchlist and  to view watchlist. Click on any ticker or stock name for detailed market intelligence report for that stock. to view watchlist. Click on any ticker or stock name for detailed market intelligence report for that stock. |
12Stocks.com Performance of Stocks in Emerging Markets Index
| Ticker | Stock Name | Watchlist | Category | Recent Price | Smart Investing & Trading Score | Change % | YTD Change% |
| BAK | Braskem S.A |   | Materials | 8.68 | 22 | 0.41 | -1.64% |
| QFIN | 360 Finance | | Financials | 18.08 | 68 | 0.33 | 14.29% |
| RDY | Dr. Reddy | | Health Care | 71.14 | 18 | 0.32 | 2.24% |
| ATHM | Autohome | | Technology | 24.32 | 18 | 0.25 | -13.33% |
| DRD | DRDGOLD | | Materials | 8.50 | 71 | 0.24 | 6.92% |
| BBD | Banco Bradesco | | Financials | 2.63 | 10 | 0.19 | -24.71% |
| KC | Kingsoft Cloud | | Technology | 2.67 | 58 | 0.19 | -29.59% |
| DOYU | DouYu | | Technology | 8.04 | 90 | 0.19 | 746.84% |
| BABA | Alibaba | | Services & Goods | 68.98 | 10 | 0.15 | -11.01% |
| SOHU | Sohu.com | | Technology | 10.93 | 66 | 0.14 | 10.02% |
| KOF | Coca-Cola FEMSA | | Consumer Staples | 93.32 | 25 | 0.09 | -1.39% |
| ASR | Grupo Aeroportuario | | Transports | 307.43 | 54 | 0.09 | 4.47% |
| PAC | Grupo Aeroportuario | | Transports | 156.03 | 33 | 0.08 | -10.95% |
| TOP | TOP Financial | | Financials | 2.32 | 27 | 0.00 | -37.63% |
| WDH | Waterdrop | | Financials | 1.22 | 68 | 0.00 | 16.52% |
| EBON | Ebang | | Technology | 8.24 | 32 | 0.00 | -46.06% |
| VSTA | Vasta Platform | | Consumer Staples | 3.75 | 10 | 0.00 | -14.77% |
| AGMH | AGM | | Technology | 1.11 | 0 | 0.00 | -38.67% |
| VIOT | Viomi | | Technology | 0.55 | 35 | 0.00 | -45.45% |
| YI | 111 | | Services & Goods | 1.00 | 17 | 0.00 | -35.48% |
| HUIZ | Huize Holding | | Financials | 0.63 | 64 | 0.00 | -29.79% |
| YJ | Yunji | | Services & Goods | 0.75 | 38 | 0.00 | 4.87% |
| LX | LexinFintech | | Financials | 1.61 | 10 | 0.00 | -12.50% |
| PERF | Perfect | | Technology | 2.40 | 43 | 0.00 | -22.58% |
| SVA | Sinovac Biotech | | Health Care | 6.47 | 27 | 0.00 | 0.00% |
| For chart view version of above stock list: Chart View ➞ 0 - 25 , 25 - 50 , 50 - 75 , 75 - 100 , 100 - 125 , 125 - 150 , 150 - 175 , 175 - 200 | ||
 | Click To Change The Sort Order: By Market Cap or Company Size Performance: Year-to-date, Week and Day |  |
|
Get the most comprehensive stock market coverage daily at 12Stocks.com ➞ Best Stocks Today ➞ Best Stocks Weekly ➞ Best Stocks Year-to-Date ➞ Best Stocks Trends ➞  Best Stocks Today 12Stocks.com Best Nasdaq Stocks ➞ Best S&P 500 Stocks ➞ Best Tech Stocks ➞ Best Biotech Stocks ➞ |
| Detailed Overview of Emerging Markets Stocks |
| Emerging Markets Technical Overview, Leaders & Laggards, Top Emerging Markets ETF Funds & Detailed Emerging Markets Stocks List, Charts, Trends & More |
| Emerging Markets: Technical Analysis, Trends & YTD Performance | |
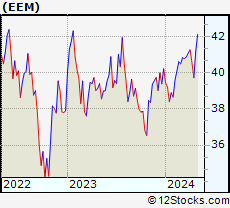
 EEM Weekly Chart |
|
| Long Term Trend: Good | |
| Medium Term Trend: Not Good | |
 EEM Daily Chart |
|
| Short Term Trend: Not Good | |
| Overall Trend Score: 49 | |
| YTD Performance: -1.39% | |
| **Trend Scores & Views Are Only For Educational Purposes And Not For Investing | |
| 12Stocks.com: Investing in Emerging Markets Index using Exchange Traded Funds | |
|
The following table shows list of key exchange traded funds (ETF) that
help investors play Emerging Markets stock market. For detailed view, check out our ETF Funds section of our website. Quick View: Move mouse or cursor over ETF symbol (ticker) to view short-term technical chart and over ETF name to view long term chart. Click on ticker or stock name for detailed view. Click on to add stock symbol to your watchlist and to view watchlist. |
12Stocks.com List of ETFs that track Emerging Markets Index
| Ticker | ETF Name | Watchlist | Recent Price | Smart Investing & Trading Score | Change % | Week % | Year-to-date % |
| EEM | Emerging Markets | | 39.65 | 49 | -0.55 | -2.17 | -1.39% |
| VWO | Emerging Markets | | 40.84 | 49 | -0.41 | -1.83 | -0.63% |
| SCHE | Emerging Markets Equity | | 24.68 | 46 | -0.40 | -1.79 | -0.44% |
| EWX | Emerging Markets Small | | 55.26 | 44 | -0.62 | -1.42 | -2.12% |
| EET | Emerging Markets | | 47.72 | 49 | -0.65 | -4.17 | -6.17% |
| EDC | Emrg Mkts Bull | | 27.05 | 49 | -1.48 | -6.33 | -11.1% |
| EEV | Short Emerging | | 20.49 | 54 | 0.59 | 3.8 | 3.89% |
| EUM | Short Emerging | | 14.49 | 62 | 0.50 | 2.16 | 2.42% |
| EDIV | Emerging Markets Dividend | | 32.82 | 36 | -0.24 | -0.36 | 0.92% |
| EMIF | Emerging Markets Infrastructure | | 21.38 | 51 | 0.14 | -1.85 | -0.09% |
| CEW | Emerging Currency Strat | | 17.61 | 21 | 0.13 | -0.42 | -2.19% |
| EBND | Em Mkts Lcl | | 19.94 | 17 | 0.40 | -0.65 | -6.12% |
| EMCB | Emerging Markets Corp | | 63.59 | 0 | -0.41 | -0.79 | -0.49% |
| VWOB | Emerging Mkts Govt | | 62.28 | 10 | 0.19 | -0.61 | -2.31% |
| EEMA | Emerging Markets Asia | | 66.09 | 49 | -0.40 | -1.85 | -0.03% |
| EELV | Em Mkts Low | | 23.17 | 10 | -0.17 | -1.47 | -3.62% |
| DVYE | Emerging Markets Dividend | | 26.43 | 56 | 0.57 | -0.11 | -0.23% |
| SDEM | SuperDividend Em Mkts | | 25.88 | 83 | 0.66 | 0.69 | 4.37% |
| DBEM | Em Mkts Hdgd | | 23.12 | 44 | -0.42 | -1.69 | 0.23% |
| PCY | Emerging Markets Sov | | 19.80 | 17 | 0.20 | -1.1 | -3.98% |
| QEMM | Emerging Mkts StratcFacts | | 56.19 | 43 | 0.02 | -1.22 | -1.69% |
| 12Stocks.com: Charts, Trends, Fundamental Data and Performances of Emerging Markets Stocks | |
|
We now take in-depth look at all Emerging Markets stocks including charts, multi-period performances and overall trends (as measured by Smart Investing & Trading Score ). One can sort Emerging Markets stocks (click link to choose) by Daily, Weekly and by Year-to-Date performances. Also, one can sort by size of the company or by market capitalization. |
| Select Your Default Chart Type: | |||||
| |||||
| Click on stock symbol or name for detailed view. Click on to add stock symbol to your watchlist and to view watchlist. Quick View: Move mouse or cursor over "Daily" to quickly view daily technical stock chart and over "Weekly" to view weekly technical stock chart. | |||||

 | BAK Braskem S.A. |
| Sector: Materials | |
| SubSector: Chemicals - Major Diversified | |
| MarketCap: 2715.86 Millions | |
| Recent Price: 8.68 Smart Investing & Trading Score : 22 | |
| Day Percent Change: 0.41% Day Change: 0.04 | |
| Week Change: -6.42% Year-to-date Change: -1.6% | |
| BAK Links: Profile News Message Board | |
| Charts:- Daily , Weekly | |
| Add BAK to Watchlist: View: Get Complete BAK Trend Analysis ➞ | |
 | QFIN 360 Finance, Inc. |
| Sector: Financials | |
| SubSector: Credit Services | |
| MarketCap: 956.208 Millions | |
| Recent Price: 18.08 Smart Investing & Trading Score : 68 | |
| Day Percent Change: 0.33% Day Change: 0.06 | |
| Week Change: -2.48% Year-to-date Change: 14.3% | |
| QFIN Links: Profile News Message Board | |
| Charts:- Daily , Weekly | |
| Add QFIN to Watchlist: View: Get Complete QFIN Trend Analysis ➞ | |
 | RDY Dr. Reddy s Laboratories Limited |
| Sector: Health Care | |
| SubSector: Drug Manufacturers - Other | |
| MarketCap: 6590.23 Millions | |
| Recent Price: 71.14 Smart Investing & Trading Score : 18 | |
| Day Percent Change: 0.32% Day Change: 0.23 | |
| Week Change: -0.39% Year-to-date Change: 2.2% | |
| RDY Links: Profile News Message Board | |
| Charts:- Daily , Weekly | |
| Add RDY to Watchlist: View: Get Complete RDY Trend Analysis ➞ | |
 | ATHM Autohome Inc. |
| Sector: Technology | |
| SubSector: Internet Information Providers | |
| MarketCap: 7984.2 Millions | |
| Recent Price: 24.32 Smart Investing & Trading Score : 18 | |
| Day Percent Change: 0.25% Day Change: 0.06 | |
| Week Change: -3.65% Year-to-date Change: -13.3% | |
| ATHM Links: Profile News Message Board | |
| Charts:- Daily , Weekly | |
| Add ATHM to Watchlist: View: Get Complete ATHM Trend Analysis ➞ | |
 | DRD DRDGOLD Limited |
| Sector: Materials | |
| SubSector: Gold | |
| MarketCap: 556.919 Millions | |
| Recent Price: 8.50 Smart Investing & Trading Score : 71 | |
| Day Percent Change: 0.24% Day Change: 0.02 | |
| Week Change: 0.59% Year-to-date Change: 6.9% | |
| DRD Links: Profile News Message Board | |
| Charts:- Daily , Weekly | |
| Add DRD to Watchlist: View: Get Complete DRD Trend Analysis ➞ | |
 | BBD Banco Bradesco S.A. |
| Sector: Financials | |
| SubSector: Foreign Regional Banks | |
| MarketCap: 30281.7 Millions | |
| Recent Price: 2.63 Smart Investing & Trading Score : 10 | |
| Day Percent Change: 0.19% Day Change: 0.00 | |
| Week Change: -4.87% Year-to-date Change: -24.7% | |
| BBD Links: Profile News Message Board | |
| Charts:- Daily , Weekly | |
| Add BBD to Watchlist: View: Get Complete BBD Trend Analysis ➞ | |
 | KC Kingsoft Cloud Holdings Limited |
| Sector: Technology | |
| SubSector: Software Application | |
| MarketCap: 98487 Millions | |
| Recent Price: 2.67 Smart Investing & Trading Score : 58 | |
| Day Percent Change: 0.19% Day Change: 0.00 | |
| Week Change: -1.3% Year-to-date Change: -29.6% | |
| KC Links: Profile News Message Board | |
| Charts:- Daily , Weekly | |
| Add KC to Watchlist: View: Get Complete KC Trend Analysis ➞ | |
 | DOYU DouYu International Holdings Limited |
| Sector: Technology | |
| SubSector: Internet Information Providers | |
| MarketCap: 2483 Millions | |
| Recent Price: 8.04 Smart Investing & Trading Score : 90 | |
| Day Percent Change: 0.19% Day Change: 0.02 | |
| Week Change: 6.56% Year-to-date Change: 746.8% | |
| DOYU Links: Profile News Message Board | |
| Charts:- Daily , Weekly | |
| Add DOYU to Watchlist: View: Get Complete DOYU Trend Analysis ➞ | |
 | BABA Alibaba Group Holding Limited |
| Sector: Services & Goods | |
| SubSector: Specialty Retail, Other | |
| MarketCap: 522666 Millions | |
| Recent Price: 68.98 Smart Investing & Trading Score : 10 | |
| Day Percent Change: 0.15% Day Change: 0.10 | |
| Week Change: -3.24% Year-to-date Change: -11.0% | |
| BABA Links: Profile News Message Board | |
| Charts:- Daily , Weekly | |
| Add BABA to Watchlist: View: Get Complete BABA Trend Analysis ➞ | |
 | SOHU Sohu.com Limited |
| Sector: Technology | |
| SubSector: Internet Information Providers | |
| MarketCap: 243.48 Millions | |
| Recent Price: 10.93 Smart Investing & Trading Score : 66 | |
| Day Percent Change: 0.14% Day Change: 0.02 | |
| Week Change: -4.42% Year-to-date Change: 10.0% | |
| SOHU Links: Profile News Message Board | |
| Charts:- Daily , Weekly | |
| Add SOHU to Watchlist: View: Get Complete SOHU Trend Analysis ➞ | |
 | KOF Coca-Cola FEMSA, S.A.B. de C.V. |
| Sector: Consumer Staples | |
| SubSector: Beverages - Soft Drinks | |
| MarketCap: 2258.9 Millions | |
| Recent Price: 93.32 Smart Investing & Trading Score : 25 | |
| Day Percent Change: 0.09% Day Change: 0.08 | |
| Week Change: -3.91% Year-to-date Change: -1.4% | |
| KOF Links: Profile News Message Board | |
| Charts:- Daily , Weekly | |
| Add KOF to Watchlist: View: Get Complete KOF Trend Analysis ➞ | |
 | ASR Grupo Aeroportuario del Sureste, S. A. B. de C. V. |
| Sector: Transports | |
| SubSector: Air Services, Other | |
| MarketCap: 2739.98 Millions | |
| Recent Price: 307.43 Smart Investing & Trading Score : 54 | |
| Day Percent Change: 0.09% Day Change: 0.29 | |
| Week Change: -3.02% Year-to-date Change: 4.5% | |
| ASR Links: Profile News Message Board | |
| Charts:- Daily , Weekly | |
| Add ASR to Watchlist: View: Get Complete ASR Trend Analysis ➞ | |
 | PAC Grupo Aeroportuario del Pacifico, S.A.B. de C.V. |
| Sector: Transports | |
| SubSector: Air Services, Other | |
| MarketCap: 3204.18 Millions | |
| Recent Price: 156.03 Smart Investing & Trading Score : 33 | |
| Day Percent Change: 0.08% Day Change: 0.13 | |
| Week Change: -4.14% Year-to-date Change: -11.0% | |
| PAC Links: Profile News Message Board | |
| Charts:- Daily , Weekly | |
| Add PAC to Watchlist: View: Get Complete PAC Trend Analysis ➞ | |
 | TOP TOP Financial Group Limited |
| Sector: Financials | |
| SubSector: Capital Markets | |
| MarketCap: 329 Millions | |
| Recent Price: 2.32 Smart Investing & Trading Score : 27 | |
| Day Percent Change: 0.00% Day Change: 0.00 | |
| Week Change: -10.08% Year-to-date Change: -37.6% | |
| TOP Links: Profile News Message Board | |
| Charts:- Daily , Weekly | |
| Add TOP to Watchlist: View: Get Complete TOP Trend Analysis ➞ | |
 | WDH Waterdrop Inc. |
| Sector: Financials | |
| SubSector: Insurance - Diversified | |
| MarketCap: 874 Millions | |
| Recent Price: 1.22 Smart Investing & Trading Score : 68 | |
| Day Percent Change: 0.00% Day Change: 0.00 | |
| Week Change: -2.4% Year-to-date Change: 16.5% | |
| WDH Links: Profile News Message Board | |
| Charts:- Daily , Weekly | |
| Add WDH to Watchlist: View: Get Complete WDH Trend Analysis ➞ | |
 | EBON Ebang International Holdings Inc. |
| Sector: Technology | |
| SubSector: Computer Hardware | |
| MarketCap: 33787 Millions | |
| Recent Price: 8.24 Smart Investing & Trading Score : 32 | |
| Day Percent Change: 0.00% Day Change: 0.00 | |
| Week Change: -1.08% Year-to-date Change: -46.1% | |
| EBON Links: Profile News Message Board | |
| Charts:- Daily , Weekly | |
| Add EBON to Watchlist: View: Get Complete EBON Trend Analysis ➞ | |
 | VSTA Vasta Platform Limited |
| Sector: Consumer Staples | |
| SubSector: Education & Training Services | |
| MarketCap: 12747 Millions | |
| Recent Price: 3.75 Smart Investing & Trading Score : 10 | |
| Day Percent Change: 0.00% Day Change: 0.00 | |
| Week Change: -1.57% Year-to-date Change: -14.8% | |
| VSTA Links: Profile News Message Board | |
| Charts:- Daily , Weekly | |
| Add VSTA to Watchlist: View: Get Complete VSTA Trend Analysis ➞ | |
 | AGMH AGM Group Holdings Inc. |
| Sector: Technology | |
| SubSector: Application Software | |
| MarketCap: 320.362 Millions | |
| Recent Price: 1.11 Smart Investing & Trading Score : 0 | |
| Day Percent Change: 0.00% Day Change: 0.00 | |
| Week Change: -30.63% Year-to-date Change: -38.7% | |
| AGMH Links: Profile News Message Board | |
| Charts:- Daily , Weekly | |
| Add AGMH to Watchlist: View: Get Complete AGMH Trend Analysis ➞ | |
 | VIOT Viomi Technology Co., Ltd |
| Sector: Technology | |
| SubSector: Electronic Equipment | |
| MarketCap: 357.2 Millions | |
| Recent Price: 0.55 Smart Investing & Trading Score : 35 | |
| Day Percent Change: 0.00% Day Change: 0.00 | |
| Week Change: -0.82% Year-to-date Change: -45.5% | |
| VIOT Links: Profile News Message Board | |
| Charts:- Daily , Weekly | |
| Add VIOT to Watchlist: View: Get Complete VIOT Trend Analysis ➞ | |
 | YI 111, Inc. |
| Sector: Services & Goods | |
| SubSector: Drug Stores | |
| MarketCap: 520.351 Millions | |
| Recent Price: 1.00 Smart Investing & Trading Score : 17 | |
| Day Percent Change: 0.00% Day Change: 0.00 | |
| Week Change: -9.09% Year-to-date Change: -35.5% | |
| YI Links: Profile News Message Board | |
| Charts:- Daily , Weekly | |
| Add YI to Watchlist: View: Get Complete YI Trend Analysis ➞ | |
 | HUIZ Huize Holding Limited |
| Sector: Financials | |
| SubSector: Insurance Brokers | |
| MarketCap: 37157 Millions | |
| Recent Price: 0.63 Smart Investing & Trading Score : 64 | |
| Day Percent Change: 0.00% Day Change: 0.00 | |
| Week Change: 5.3% Year-to-date Change: -29.8% | |
| HUIZ Links: Profile News Message Board | |
| Charts:- Daily , Weekly | |
| Add HUIZ to Watchlist: View: Get Complete HUIZ Trend Analysis ➞ | |
 | YJ Yunji Inc. |
| Sector: Services & Goods | |
| SubSector: Specialty Retail, Other | |
| MarketCap: 770.644 Millions | |
| Recent Price: 0.75 Smart Investing & Trading Score : 38 | |
| Day Percent Change: 0.00% Day Change: 0.00 | |
| Week Change: -15.28% Year-to-date Change: 4.9% | |
| YJ Links: Profile News Message Board | |
| Charts:- Daily , Weekly | |
| Add YJ to Watchlist: View: Get Complete YJ Trend Analysis ➞ | |
 | LX LexinFintech Holdings Ltd. |
| Sector: Financials | |
| SubSector: Credit Services | |
| MarketCap: 1674.18 Millions | |
| Recent Price: 1.61 Smart Investing & Trading Score : 10 | |
| Day Percent Change: 0.00% Day Change: 0.00 | |
| Week Change: -8.52% Year-to-date Change: -12.5% | |
| LX Links: Profile News Message Board | |
| Charts:- Daily , Weekly | |
| Add LX to Watchlist: View: Get Complete LX Trend Analysis ➞ | |
 | PERF Perfect Corp. |
| Sector: Technology | |
| SubSector: Software - Application | |
| MarketCap: 582 Millions | |
| Recent Price: 2.40 Smart Investing & Trading Score : 43 | |
| Day Percent Change: 0.00% Day Change: 0.00 | |
| Week Change: -9.77% Year-to-date Change: -22.6% | |
| PERF Links: Profile News Message Board | |
| Charts:- Daily , Weekly | |
| Add PERF to Watchlist: View: Get Complete PERF Trend Analysis ➞ | |
 | SVA Sinovac Biotech Ltd. |
| Sector: Health Care | |
| SubSector: Biotechnology | |
| MarketCap: 336.88 Millions | |
| Recent Price: 6.47 Smart Investing & Trading Score : 27 | |
| Day Percent Change: 0.00% Day Change: 0.00 | |
| Week Change: 0% Year-to-date Change: 0.0% | |
| SVA Links: Profile News Message Board | |
| Charts:- Daily , Weekly | |
| Add SVA to Watchlist: View: Get Complete SVA Trend Analysis ➞ | |
| For tabular summary view of above stock list: Summary View ➞ 0 - 25 , 25 - 50 , 50 - 75 , 75 - 100 , 100 - 125 , 125 - 150 , 150 - 175 , 175 - 200 | ||
| Click To Change The Sort Order: By Market Cap or Company Size Performance: Year-to-date, Week and Day | |
| Select Chart Type: | ||
|
Best Stocks Today 12Stocks.com |
© 2024 12Stocks.com Terms & Conditions Privacy Contact Us
All Information Provided Only For Education And Not To Be Used For Investing or Trading. See Terms & Conditions


One More Thing ... Get Best Stocks Delivered Daily!
Never Ever Miss A Move With Our Top Ten Stocks Lists
Find Best Stocks In Any Market - Bull or Bear Market
Take A Peek At Our Top Ten Stocks Lists: Daily, Weekly, Year-to-Date & Top Trends
Find Best Stocks In Any Market - Bull or Bear Market
Take A Peek At Our Top Ten Stocks Lists: Daily, Weekly, Year-to-Date & Top Trends
Emerging Markets Stocks With Best Up Trends [0-bearish to 100-bullish]: HDFC Bank[93], Full Truck[93], Bright Scholar[90], DouYu [90], Harmony Gold[88], GigaCloud [88], GDS [88], Smart Share[86], Gold Fields[85], Lufax Holding[83], So-Young [83]
Best Emerging Markets Stocks Year-to-Date:
U Power[2812.95%], DouYu [746.84%], MicroCloud Hologram[664.03%], China Liberal[476.51%], Zhongchao [412.19%], Yatsen Holding[394.12%], Uxin [141.08%], QuantaSing [117.28%], GigaCloud [95.49%], Bright Scholar[68%], Yiren Digital[54.49%] Best Emerging Markets Stocks This Week:
Regencell Bioscience[37.01%], Yatsen Holding[20.1%], MingZhu Logistics[17.48%], Secoo Holding[15.24%], Bright Scholar[14.13%], Zhongchao [14.02%], Controladora Vuela[11.35%], TH [10%], Smart Share[9.26%], Quhuo [8.87%], EHang [7.46%] Best Emerging Markets Stocks Daily:
Hywin [17.78%], Ambipar Emergency[13.26%], Bright Scholar[11.70%], MingZhu Logistics[10.31%], Lanvin [8.39%], Aesthetic Medical[6.77%], Dingdong (Cayman)[4.91%], GreenTree Hospitality[4.56%], Petroleo Brasileiro[4.49%], Cheetah Mobile[4.15%], Fangdd Network[4.00%]