
 Login Sign Up


| |||||
 |  | ||||

| 12Stocks.com Market Intelligence |
Best Emerging Markets Stocks
| In a hurry? Emerging Markets Stocks Lists: Trends Table, Stock Charts
Sort Emerging Markets stocks: Daily, Weekly, Year-to-Date, Market Cap & Trends. Filter Emerging Markets stocks list by sector: Show all, Tech, Finance, Energy, Staples, Retail, Industrial, Materials, Utilities and HealthCare Filter Emerging Markets stocks list by size:All Large Medium Small |
| 12Stocks.com Emerging Markets Stocks Performances & Trends Daily | |||||||||
|
|  The overall Smart Investing & Trading Score is 48 (0-bearish to 100-bullish) which puts Emerging Markets index in short term neutral trend. The Smart Investing & Trading Score from previous trading session is 38 and hence an improvement of trend.
| ||||||||
Here are the Smart Investing & Trading Scores of the most requested Emerging Markets stocks at 12Stocks.com (click stock name for detailed review):
|


| 12Stocks.com: Top Performing Emerging Markets Index Stocks | ||||||||||||||||||||||||||||||||||||||||||||||||
 The top performing Emerging Markets Index stocks year to date are
Now, more recently, over last week, the top performing Emerging Markets Index stocks on the move are


|
||||||||||||||||||||||||||||||||||||||||||||||||
| 12Stocks.com: Investing in Emerging Markets Index with Stocks | |
|
The following table helps investors and traders sort through current performance and trends (as measured by Smart Investing & Trading Score ) of various
stocks in the Emerging Markets Index. Quick View: Move mouse or cursor over stock symbol (ticker) to view short-term technical chart and over stock name to view long term chart. Click on  to add stock symbol to your watchlist and to add stock symbol to your watchlist and  to view watchlist. Click on any ticker or stock name for detailed market intelligence report for that stock. to view watchlist. Click on any ticker or stock name for detailed market intelligence report for that stock. |
12Stocks.com Performance of Stocks in Emerging Markets Index
| Ticker | Stock Name | Watchlist | Category | Recent Price | Smart Investing & Trading Score | Change % | YTD Change% |
| SID | Companhia Siderurgica |   | Materials | 2.72 | 10 | -1.09 | -30.79% |
| VIPS | Vipshop | | Services & Goods | 15.15 | 0 | -1.17 | -14.70% |
| TUYA | Tuya | | Technology | 1.64 | 17 | -1.20 | -28.54% |
| OMAB | Grupo Aeroportuario | | Transports | 75.19 | 36 | -1.22 | -11.15% |
| CX | CEMEX S.A.B. | | Industrials | 8.08 | 0 | -1.22 | 4.26% |
| SIMO | Silicon Motion | | Technology | 73.30 | 36 | -1.25 | 19.63% |
| TOP | TOP Financial | | Financials | 2.32 | 10 | -1.28 | -37.63% |
| BBDO | Banco Bradesco | | Financials | 2.32 | 7 | -1.28 | -27.05% |
| AFYA | Afya | | Services & Goods | 16.04 | 10 | -1.44 | -26.88% |
| AMX | America Movil | | Technology | 17.75 | 20 | -1.55 | -4.16% |
| WIT | Wipro | | Technology | 5.16 | 0 | -1.71 | -7.36% |
| TV | Grupo Televisa | | Services & Goods | 2.85 | 10 | -1.72 | -14.67% |
| SBSW | Sibanye Stillwater | | Materials | 5.32 | 71 | -1.85 | -2.03% |
| IH | iHuman | | Consumer Staples | 1.72 | 25 | -2.00 | -43.77% |
| ASX | ASE | | Technology | 10.35 | 31 | -2.27 | 9.99% |
| XP | XP | | Financials | 21.07 | 10 | -2.27 | -19.18% |
| HOLI | Hollysys Automation | | Industrials | 24.32 | 0 | -2.29 | -7.70% |
| MMYT | MakeMyTrip | | Services & Goods | 61.22 | 26 | -2.53 | 30.31% |
| INFY | Infosys | | Technology | 16.51 | 0 | -2.60 | -10.17% |
| MLCO | Melco Resorts | | Services & Goods | 6.23 | 10 | -2.66 | -29.76% |
| CANG | Cango | | Technology | 1.38 | 39 | -2.82 | 35.29% |
| AIH | Aesthetic Medical | | Health Care | 0.38 | 25 | -2.86 | -44.32% |
| VTRU | Vitru | | Consumer Staples | 12.43 | 20 | -2.93 | -21.46% |
| CBD | Companhia Brasileira | | Services & Goods | 0.45 | 10 | -2.96 | -44.33% |
| BEDU | Bright Scholar | | Services & Goods | 1.88 | 31 | -3.09 | 50.40% |
| For chart view version of above stock list: Chart View ➞ 0 - 25 , 25 - 50 , 50 - 75 , 75 - 100 , 100 - 125 , 125 - 150 , 150 - 175 , 175 - 200 | ||
 | Click To Change The Sort Order: By Market Cap or Company Size Performance: Year-to-date, Week and Day |  |
|
Get the most comprehensive stock market coverage daily at 12Stocks.com ➞ Best Stocks Today ➞ Best Stocks Weekly ➞ Best Stocks Year-to-Date ➞ Best Stocks Trends ➞  Best Stocks Today 12Stocks.com Best Nasdaq Stocks ➞ Best S&P 500 Stocks ➞ Best Tech Stocks ➞ Best Biotech Stocks ➞ |
| Detailed Overview of Emerging Markets Stocks |
| Emerging Markets Technical Overview, Leaders & Laggards, Top Emerging Markets ETF Funds & Detailed Emerging Markets Stocks List, Charts, Trends & More |
| Emerging Markets: Technical Analysis, Trends & YTD Performance | |
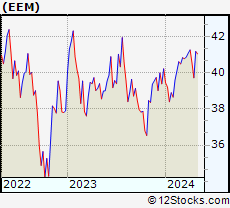
 EEM Weekly Chart |
|
| Long Term Trend: Very Good | |
| Medium Term Trend: Not Good | |
 EEM Daily Chart |
|
| Short Term Trend: Not Good | |
| Overall Trend Score: 48 | |
| YTD Performance: -0.85% | |
| **Trend Scores & Views Are Only For Educational Purposes And Not For Investing | |
| 12Stocks.com: Investing in Emerging Markets Index using Exchange Traded Funds | |
|
The following table shows list of key exchange traded funds (ETF) that
help investors play Emerging Markets stock market. For detailed view, check out our ETF Funds section of our website. Quick View: Move mouse or cursor over ETF symbol (ticker) to view short-term technical chart and over ETF name to view long term chart. Click on ticker or stock name for detailed view. Click on to add stock symbol to your watchlist and to view watchlist. |
12Stocks.com List of ETFs that track Emerging Markets Index
| Ticker | ETF Name | Watchlist | Recent Price | Smart Investing & Trading Score | Change % | Week % | Year-to-date % |
| EEM | Emerging Markets | | 39.87 | 48 | 0.40 | -1.63 | -0.85% |
| VWO | Emerging Markets | | 41.01 | 53 | 0.27 | -1.42 | -0.22% |
| SCHE | Emerging Markets Equity | | 24.78 | 53 | 0.32 | -1.39 | -0.04% |
| EWX | Emerging Markets Small | | 55.61 | 43 | 0.47 | -0.8 | -1.51% |
| EET | Emerging Markets | | 48.03 | 41 | 0.17 | -3.55 | -5.56% |
| EDC | Emrg Mkts Bull | | 27.46 | 48 | 1.25 | -4.92 | -9.76% |
| EEV | Short Emerging | | 20.37 | 62 | -0.92 | 3.19 | 3.28% |
| EUM | Short Emerging | | 14.42 | 62 | -0.55 | 1.65 | 1.91% |
| EDIV | Emerging Markets Dividend | | 32.83 | 43 | 0.37 | -0.33 | 0.95% |
| EMIF | Emerging Markets Infrastructure | | 21.37 | 36 | 0.05 | -1.9 | -0.14% |
| CEW | Emerging Currency Strat | | 17.59 | 31 | 0.04 | -0.55 | -2.32% |
| EBND | Em Mkts Lcl | | 19.86 | 10 | -0.15 | -1.05 | -6.5% |
| EMCB | Emerging Markets Corp | | 64.10 | 23 | 0.20 | 0 | 0.31% |
| VWOB | Emerging Mkts Govt | | 62.16 | 10 | -0.04 | -0.81 | -2.5% |
| EEMA | Emerging Markets Asia | | 66.36 | 48 | 0.69 | -1.46 | 0.37% |
| EELV | Em Mkts Low | | 23.21 | 17 | 0.43 | -1.3 | -3.45% |
| DVYE | Emerging Markets Dividend | | 26.28 | 49 | -0.11 | -0.68 | -0.79% |
| SDEM | SuperDividend Em Mkts | | 25.71 | 48 | 0.51 | 0.03 | 3.68% |
| DBEM | Em Mkts Hdgd | | 23.16 | 41 | 0.39 | -1.53 | 0.39% |
| PCY | Emerging Markets Sov | | 19.76 | 18 | -0.20 | -1.3 | -4.17% |
| QEMM | Emerging Mkts StratcFacts | | 56.18 | 36 | 0.23 | -1.23 | -1.71% |
| 12Stocks.com: Charts, Trends, Fundamental Data and Performances of Emerging Markets Stocks | |
|
We now take in-depth look at all Emerging Markets stocks including charts, multi-period performances and overall trends (as measured by Smart Investing & Trading Score ). One can sort Emerging Markets stocks (click link to choose) by Daily, Weekly and by Year-to-Date performances. Also, one can sort by size of the company or by market capitalization. |
| Select Your Default Chart Type: | |||||
| |||||
| Click on stock symbol or name for detailed view. Click on to add stock symbol to your watchlist and to view watchlist. Quick View: Move mouse or cursor over "Daily" to quickly view daily technical stock chart and over "Weekly" to view weekly technical stock chart. | |||||

 | SID Companhia Siderurgica Nacional |
| Sector: Materials | |
| SubSector: Steel & Iron | |
| MarketCap: 2087.58 Millions | |
| Recent Price: 2.72 Smart Investing & Trading Score : 10 | |
| Day Percent Change: -1.09% Day Change: -0.03 | |
| Week Change: -3.2% Year-to-date Change: -30.8% | |
| SID Links: Profile News Message Board | |
| Charts:- Daily , Weekly | |
| Add SID to Watchlist: View: Get Complete SID Trend Analysis ➞ | |
 | VIPS Vipshop Holdings Limited |
| Sector: Services & Goods | |
| SubSector: Catalog & Mail Order Houses | |
| MarketCap: 10496.2 Millions | |
| Recent Price: 15.15 Smart Investing & Trading Score : 0 | |
| Day Percent Change: -1.17% Day Change: -0.18 | |
| Week Change: -6.77% Year-to-date Change: -14.7% | |
| VIPS Links: Profile News Message Board | |
| Charts:- Daily , Weekly | |
| Add VIPS to Watchlist: View: Get Complete VIPS Trend Analysis ➞ | |
 | TUYA Tuya Inc. |
| Sector: Technology | |
| SubSector: Software - Infrastructure | |
| MarketCap: 1050 Millions | |
| Recent Price: 1.64 Smart Investing & Trading Score : 17 | |
| Day Percent Change: -1.20% Day Change: -0.02 | |
| Week Change: -4.09% Year-to-date Change: -28.5% | |
| TUYA Links: Profile News Message Board | |
| Charts:- Daily , Weekly | |
| Add TUYA to Watchlist: View: Get Complete TUYA Trend Analysis ➞ | |
 | OMAB Grupo Aeroportuario del Centro Norte, S.A.B. de C.V. |
| Sector: Transports | |
| SubSector: Air Services, Other | |
| MarketCap: 1196.38 Millions | |
| Recent Price: 75.19 Smart Investing & Trading Score : 36 | |
| Day Percent Change: -1.22% Day Change: -0.93 | |
| Week Change: -5.49% Year-to-date Change: -11.2% | |
| OMAB Links: Profile News Message Board | |
| Charts:- Daily , Weekly | |
| Add OMAB to Watchlist: View: Get Complete OMAB Trend Analysis ➞ | |
 | CX CEMEX, S.A.B. de C.V. |
| Sector: Industrials | |
| SubSector: Cement | |
| MarketCap: 2948.23 Millions | |
| Recent Price: 8.08 Smart Investing & Trading Score : 0 | |
| Day Percent Change: -1.22% Day Change: -0.10 | |
| Week Change: -5.61% Year-to-date Change: 4.3% | |
| CX Links: Profile News Message Board | |
| Charts:- Daily , Weekly | |
| Add CX to Watchlist: View: Get Complete CX Trend Analysis ➞ | |
 | SIMO Silicon Motion Technology Corporation |
| Sector: Technology | |
| SubSector: Diversified Electronics | |
| MarketCap: 1186.66 Millions | |
| Recent Price: 73.30 Smart Investing & Trading Score : 36 | |
| Day Percent Change: -1.25% Day Change: -0.93 | |
| Week Change: -2.63% Year-to-date Change: 19.6% | |
| SIMO Links: Profile News Message Board | |
| Charts:- Daily , Weekly | |
| Add SIMO to Watchlist: View: Get Complete SIMO Trend Analysis ➞ | |
 | TOP TOP Financial Group Limited |
| Sector: Financials | |
| SubSector: Capital Markets | |
| MarketCap: 329 Millions | |
| Recent Price: 2.32 Smart Investing & Trading Score : 10 | |
| Day Percent Change: -1.28% Day Change: -0.03 | |
| Week Change: -10.08% Year-to-date Change: -37.6% | |
| TOP Links: Profile News Message Board | |
| Charts:- Daily , Weekly | |
| Add TOP to Watchlist: View: Get Complete TOP Trend Analysis ➞ | |
 | BBDO Banco Bradesco S.A. |
| Sector: Financials | |
| SubSector: Foreign Regional Banks | |
| MarketCap: 27711.4 Millions | |
| Recent Price: 2.32 Smart Investing & Trading Score : 7 | |
| Day Percent Change: -1.28% Day Change: -0.03 | |
| Week Change: -5.69% Year-to-date Change: -27.1% | |
| BBDO Links: Profile News Message Board | |
| Charts:- Daily , Weekly | |
| Add BBDO to Watchlist: View: Get Complete BBDO Trend Analysis ➞ | |
 | AFYA Afya Limited |
| Sector: Services & Goods | |
| SubSector: Education & Training Services | |
| MarketCap: 1559.26 Millions | |
| Recent Price: 16.04 Smart Investing & Trading Score : 10 | |
| Day Percent Change: -1.44% Day Change: -0.23 | |
| Week Change: -5.45% Year-to-date Change: -26.9% | |
| AFYA Links: Profile News Message Board | |
| Charts:- Daily , Weekly | |
| Add AFYA to Watchlist: View: Get Complete AFYA Trend Analysis ➞ | |
 | AMX America Movil, S.A.B. de C.V. |
| Sector: Technology | |
| SubSector: Wireless Communications | |
| MarketCap: 44726.6 Millions | |
| Recent Price: 17.75 Smart Investing & Trading Score : 20 | |
| Day Percent Change: -1.55% Day Change: -0.28 | |
| Week Change: -1.66% Year-to-date Change: -4.2% | |
| AMX Links: Profile News Message Board | |
| Charts:- Daily , Weekly | |
| Add AMX to Watchlist: View: Get Complete AMX Trend Analysis ➞ | |
 | WIT Wipro Limited |
| Sector: Technology | |
| SubSector: Information Technology Services | |
| MarketCap: 15101.3 Millions | |
| Recent Price: 5.16 Smart Investing & Trading Score : 0 | |
| Day Percent Change: -1.71% Day Change: -0.09 | |
| Week Change: -5.49% Year-to-date Change: -7.4% | |
| WIT Links: Profile News Message Board | |
| Charts:- Daily , Weekly | |
| Add WIT to Watchlist: View: Get Complete WIT Trend Analysis ➞ | |
 | TV Grupo Televisa, S.A.B. |
| Sector: Services & Goods | |
| SubSector: Broadcasting - TV | |
| MarketCap: 3740.43 Millions | |
| Recent Price: 2.85 Smart Investing & Trading Score : 10 | |
| Day Percent Change: -1.72% Day Change: -0.05 | |
| Week Change: -11.76% Year-to-date Change: -14.7% | |
| TV Links: Profile News Message Board | |
| Charts:- Daily , Weekly | |
| Add TV to Watchlist: View: Get Complete TV Trend Analysis ➞ | |
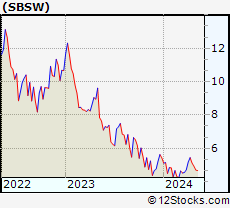 | SBSW Sibanye Stillwater Limited |
| Sector: Materials | |
| SubSector: Gold | |
| MarketCap: 3853.99 Millions | |
| Recent Price: 5.32 Smart Investing & Trading Score : 71 | |
| Day Percent Change: -1.85% Day Change: -0.10 | |
| Week Change: -2.21% Year-to-date Change: -2.0% | |
| SBSW Links: Profile News Message Board | |
| Charts:- Daily , Weekly | |
| Add SBSW to Watchlist: View: Get Complete SBSW Trend Analysis ➞ | |
 | IH iHuman Inc. |
| Sector: Consumer Staples | |
| SubSector: Education & Training Services | |
| MarketCap: 12247 Millions | |
| Recent Price: 1.72 Smart Investing & Trading Score : 25 | |
| Day Percent Change: -2.00% Day Change: -0.03 | |
| Week Change: -3.65% Year-to-date Change: -43.8% | |
| IH Links: Profile News Message Board | |
| Charts:- Daily , Weekly | |
| Add IH to Watchlist: View: Get Complete IH Trend Analysis ➞ | |
 | ASX ASE Technology Holding Co., Ltd. |
| Sector: Technology | |
| SubSector: Semiconductor Equipment & Materials | |
| MarketCap: 8513.18 Millions | |
| Recent Price: 10.35 Smart Investing & Trading Score : 31 | |
| Day Percent Change: -2.27% Day Change: -0.24 | |
| Week Change: -4.61% Year-to-date Change: 10.0% | |
| ASX Links: Profile News Message Board | |
| Charts:- Daily , Weekly | |
| Add ASX to Watchlist: View: Get Complete ASX Trend Analysis ➞ | |
 | XP XP Inc. |
| Sector: Financials | |
| SubSector: Asset Management | |
| MarketCap: 12990.3 Millions | |
| Recent Price: 21.07 Smart Investing & Trading Score : 10 | |
| Day Percent Change: -2.27% Day Change: -0.49 | |
| Week Change: -9.8% Year-to-date Change: -19.2% | |
| XP Links: Profile News Message Board | |
| Charts:- Daily , Weekly | |
| Add XP to Watchlist: View: Get Complete XP Trend Analysis ➞ | |
 | HOLI Hollysys Automation Technologies Ltd. |
| Sector: Industrials | |
| SubSector: Industrial Electrical Equipment | |
| MarketCap: 668.379 Millions | |
| Recent Price: 24.32 Smart Investing & Trading Score : 0 | |
| Day Percent Change: -2.29% Day Change: -0.57 | |
| Week Change: -4.21% Year-to-date Change: -7.7% | |
| HOLI Links: Profile News Message Board | |
| Charts:- Daily , Weekly | |
| Add HOLI to Watchlist: View: Get Complete HOLI Trend Analysis ➞ | |
 | MMYT MakeMyTrip Limited |
| Sector: Services & Goods | |
| SubSector: General Entertainment | |
| MarketCap: 1429.59 Millions | |
| Recent Price: 61.22 Smart Investing & Trading Score : 26 | |
| Day Percent Change: -2.53% Day Change: -1.59 | |
| Week Change: -10.78% Year-to-date Change: 30.3% | |
| MMYT Links: Profile News Message Board | |
| Charts:- Daily , Weekly | |
| Add MMYT to Watchlist: View: Get Complete MMYT Trend Analysis ➞ | |
 | INFY Infosys Limited |
| Sector: Technology | |
| SubSector: Information Technology Services | |
| MarketCap: 33819.1 Millions | |
| Recent Price: 16.51 Smart Investing & Trading Score : 0 | |
| Day Percent Change: -2.60% Day Change: -0.44 | |
| Week Change: -6.83% Year-to-date Change: -10.2% | |
| INFY Links: Profile News Message Board | |
| Charts:- Daily , Weekly | |
| Add INFY to Watchlist: View: Get Complete INFY Trend Analysis ➞ | |
 | MLCO Melco Resorts & Entertainment Limited |
| Sector: Services & Goods | |
| SubSector: Resorts & Casinos | |
| MarketCap: 7031.14 Millions | |
| Recent Price: 6.23 Smart Investing & Trading Score : 10 | |
| Day Percent Change: -2.66% Day Change: -0.17 | |
| Week Change: -10.36% Year-to-date Change: -29.8% | |
| MLCO Links: Profile News Message Board | |
| Charts:- Daily , Weekly | |
| Add MLCO to Watchlist: View: Get Complete MLCO Trend Analysis ➞ | |
 | CANG Cango Inc. |
| Sector: Technology | |
| SubSector: Internet Information Providers | |
| MarketCap: 947.48 Millions | |
| Recent Price: 1.38 Smart Investing & Trading Score : 39 | |
| Day Percent Change: -2.82% Day Change: -0.04 | |
| Week Change: -5.48% Year-to-date Change: 35.3% | |
| CANG Links: Profile News Message Board | |
| Charts:- Daily , Weekly | |
| Add CANG to Watchlist: View: Get Complete CANG Trend Analysis ➞ | |
 | AIH Aesthetic Medical International Holdings Group Limited |
| Sector: Health Care | |
| SubSector: Specialized Health Services | |
| MarketCap: 205.356 Millions | |
| Recent Price: 0.38 Smart Investing & Trading Score : 25 | |
| Day Percent Change: -2.86% Day Change: -0.01 | |
| Week Change: -11.93% Year-to-date Change: -44.3% | |
| AIH Links: Profile News Message Board | |
| Charts:- Daily , Weekly | |
| Add AIH to Watchlist: View: Get Complete AIH Trend Analysis ➞ | |
 | VTRU Vitru Limited |
| Sector: Consumer Staples | |
| SubSector: Education & Training Services | |
| MarketCap: 33347 Millions | |
| Recent Price: 12.43 Smart Investing & Trading Score : 20 | |
| Day Percent Change: -2.93% Day Change: -0.38 | |
| Week Change: -11.25% Year-to-date Change: -21.5% | |
| VTRU Links: Profile News Message Board | |
| Charts:- Daily , Weekly | |
| Add VTRU to Watchlist: View: Get Complete VTRU Trend Analysis ➞ | |
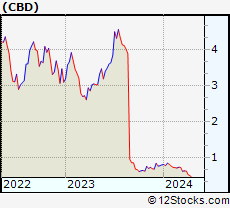 | CBD Companhia Brasileira de Distribuicao |
| Sector: Services & Goods | |
| SubSector: Grocery Stores | |
| MarketCap: 3830.15 Millions | |
| Recent Price: 0.45 Smart Investing & Trading Score : 10 | |
| Day Percent Change: -2.96% Day Change: -0.01 | |
| Week Change: -10.9% Year-to-date Change: -44.3% | |
| CBD Links: Profile News Message Board | |
| Charts:- Daily , Weekly | |
| Add CBD to Watchlist: View: Get Complete CBD Trend Analysis ➞ | |
 | BEDU Bright Scholar Education Holdings Limited |
| Sector: Services & Goods | |
| SubSector: Education & Training Services | |
| MarketCap: 792.406 Millions | |
| Recent Price: 1.88 Smart Investing & Trading Score : 31 | |
| Day Percent Change: -3.09% Day Change: -0.06 | |
| Week Change: 2.17% Year-to-date Change: 50.4% | |
| BEDU Links: Profile News Message Board | |
| Charts:- Daily , Weekly | |
| Add BEDU to Watchlist: View: Get Complete BEDU Trend Analysis ➞ | |
| For tabular summary view of above stock list: Summary View ➞ 0 - 25 , 25 - 50 , 50 - 75 , 75 - 100 , 100 - 125 , 125 - 150 , 150 - 175 , 175 - 200 | ||
| Click To Change The Sort Order: By Market Cap or Company Size Performance: Year-to-date, Week and Day | |
| Select Chart Type: | ||
|
Best Stocks Today 12Stocks.com |
© 2024 12Stocks.com Terms & Conditions Privacy Contact Us
All Information Provided Only For Education And Not To Be Used For Investing or Trading. See Terms & Conditions


One More Thing ... Get Best Stocks Delivered Daily!
Never Ever Miss A Move With Our Top Ten Stocks Lists
Find Best Stocks In Any Market - Bull or Bear Market
Take A Peek At Our Top Ten Stocks Lists: Daily, Weekly, Year-to-Date & Top Trends
Find Best Stocks In Any Market - Bull or Bear Market
Take A Peek At Our Top Ten Stocks Lists: Daily, Weekly, Year-to-Date & Top Trends
Emerging Markets Stocks With Best Up Trends [0-bearish to 100-bullish]: GigaCloud [100], Baozun [95], HDFC Bank[93], TAL Education[90], GDS [88], Yatsen Holding[88], U Power[83], Smart Share[83], Lufax Holding[83], MINISO [83], Yiren Digital[78]
Best Emerging Markets Stocks Year-to-Date:
U Power[2874.33%], Zhongchao [825.77%], DouYu [747.37%], MicroCloud Hologram[734.53%], China Liberal[459.28%], Yatsen Holding[389.34%], Uxin [136.8%], QuantaSing [112.65%], GigaCloud [100.82%], Yiren Digital[55.45%], Bright Scholar[50.4%] Best Emerging Markets Stocks This Week:
Zhongchao [106.1%], Regencell Bioscience[60.89%], Yatsen Holding[18.94%], TH [18.18%], Secoo Holding[11.83%], Controladora Vuela[11.35%], Smart Share[9.93%], GigaCloud [8.8%], EHang [8.41%], Momo [7.17%], SunCar [7%] Best Emerging Markets Stocks Daily:
Zhongchao [146.72%], MicroCloud Hologram[30.04%], Regencell Bioscience[29.41%], TH [25.00%], Golden Heaven[21.20%], MingZhu Logistics[9.54%], Secoo Holding[9.32%], Cheetah Mobile[9.06%], Quhuo [8.36%], U Power[8.11%], 17 Education[7.05%]