
 Login Sign Up


| |||||
 |  | ||||

| 12Stocks.com Market Intelligence |
Best Emerging Markets Stocks
| In a hurry? Emerging Markets Stocks Lists: Trends Table, Stock Charts
Sort Emerging Markets stocks: Daily, Weekly, Year-to-Date, Market Cap & Trends. Filter Emerging Markets stocks list by sector: Show all, Tech, Finance, Energy, Staples, Retail, Industrial, Materials, Utilities and HealthCare Filter Emerging Markets stocks list by size:All Large Medium Small |
| 12Stocks.com Emerging Markets Stocks Performances & Trends Daily | |||||||||
|
|  The overall Smart Investing & Trading Score is 48 (0-bearish to 100-bullish) which puts Emerging Markets index in short term neutral trend. The Smart Investing & Trading Score from previous trading session is 38 and hence an improvement of trend.
| ||||||||
Here are the Smart Investing & Trading Scores of the most requested Emerging Markets stocks at 12Stocks.com (click stock name for detailed review):
|


| 12Stocks.com: Top Performing Emerging Markets Index Stocks | ||||||||||||||||||||||||||||||||||||||||||||||||
 The top performing Emerging Markets Index stocks year to date are
Now, more recently, over last week, the top performing Emerging Markets Index stocks on the move are


|
||||||||||||||||||||||||||||||||||||||||||||||||
| 12Stocks.com: Investing in Emerging Markets Index with Stocks | |
|
The following table helps investors and traders sort through current performance and trends (as measured by Smart Investing & Trading Score ) of various
stocks in the Emerging Markets Index. Quick View: Move mouse or cursor over stock symbol (ticker) to view short-term technical chart and over stock name to view long term chart. Click on  to add stock symbol to your watchlist and to add stock symbol to your watchlist and  to view watchlist. Click on any ticker or stock name for detailed market intelligence report for that stock. to view watchlist. Click on any ticker or stock name for detailed market intelligence report for that stock. |
12Stocks.com Performance of Stocks in Emerging Markets Index
| Ticker | Stock Name | Watchlist | Category | Recent Price | Smart Investing & Trading Score | Change % | YTD Change% |
| IMAB | I Mab |   | Health Care | 1.80 | 56 | -0.55 | -5.26% |
| HCM | Hutchison China | | Health Care | 16.36 | 31 | -0.55 | -9.66% |
| RDY | Dr. Reddy | | Health Care | 70.91 | 18 | -0.56 | 1.91% |
| AIXI | Xiao-I | | Technology | 1.49 | 10 | -0.67 | -33.78% |
| PBR | Petroleo Brasileiro | | Energy | 15.58 | 39 | -0.70 | -2.44% |
| ERJ | Embraer S.A | | Industrials | 24.22 | 54 | -0.74 | 31.27% |
| BBD | Banco Bradesco | | Financials | 2.63 | 10 | -0.75 | -24.86% |
| IBN | ICICI Bank | | Financials | 25.43 | 44 | -0.78 | 6.67% |
| FENG | Phoenix New | | Technology | 1.88 | 44 | -0.79 | 37.87% |
| UMC | United Microelectronics | | Technology | 7.53 | 0 | -0.79 | -10.99% |
| SIFY | Sify | | Technology | 1.23 | 10 | -0.81 | -34.05% |
| WDH | Waterdrop | | Financials | 1.22 | 53 | -0.81 | 16.52% |
| YSG | Yatsen Holding | | Services & Goods | 3.58 | 83 | -0.83 | 389.34% |
| DDL | Dingdong (Cayman) | | Consumer Staples | 1.12 | 5 | -0.88 | -26.32% |
| QD | Qudian | | Technology | 2.25 | 26 | -0.88 | 10.29% |
| SOHU | Sohu.com | | Technology | 10.91 | 51 | -0.91 | 9.87% |
| UGP | Ultrapar Participacoes | | Energy | 5.08 | 7 | -0.97 | -6.27% |
| NIU | Niu | | Consumer Staples | 2.03 | 61 | -0.98 | -7.31% |
| HTHT | Huazhu | | Services & Goods | 37.36 | 36 | -1.01 | 11.72% |
| BEKE | KE | | Financials | 12.75 | 10 | -1.01 | -21.34% |
| PAGS | PagSeguro Digital | | Financials | 11.55 | 10 | -1.03 | -7.38% |
| MOGU | MOGU | | Services & Goods | 1.88 | 10 | -1.05 | -1.57% |
| CNF | CNFinance | | Financials | 1.85 | 25 | -1.07 | -16.67% |
| OMAB | Grupo Aeroportuario | | Transports | 75.30 | 36 | -1.08 | -11.02% |
| SID | Companhia Siderurgica | | Materials | 2.72 | 10 | -1.09 | -30.79% |
| For chart view version of above stock list: Chart View ➞ 0 - 25 , 25 - 50 , 50 - 75 , 75 - 100 , 100 - 125 , 125 - 150 , 150 - 175 , 175 - 200 | ||
 | Click To Change The Sort Order: By Market Cap or Company Size Performance: Year-to-date, Week and Day |  |
|
Get the most comprehensive stock market coverage daily at 12Stocks.com ➞ Best Stocks Today ➞ Best Stocks Weekly ➞ Best Stocks Year-to-Date ➞ Best Stocks Trends ➞  Best Stocks Today 12Stocks.com Best Nasdaq Stocks ➞ Best S&P 500 Stocks ➞ Best Tech Stocks ➞ Best Biotech Stocks ➞ |
| Detailed Overview of Emerging Markets Stocks |
| Emerging Markets Technical Overview, Leaders & Laggards, Top Emerging Markets ETF Funds & Detailed Emerging Markets Stocks List, Charts, Trends & More |
| Emerging Markets: Technical Analysis, Trends & YTD Performance | |
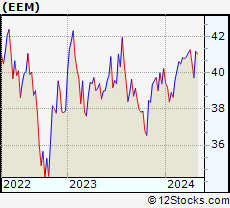
 EEM Weekly Chart |
|
| Long Term Trend: Very Good | |
| Medium Term Trend: Not Good | |
 EEM Daily Chart |
|
| Short Term Trend: Not Good | |
| Overall Trend Score: 48 | |
| YTD Performance: -0.85% | |
| **Trend Scores & Views Are Only For Educational Purposes And Not For Investing | |
| 12Stocks.com: Investing in Emerging Markets Index using Exchange Traded Funds | |
|
The following table shows list of key exchange traded funds (ETF) that
help investors play Emerging Markets stock market. For detailed view, check out our ETF Funds section of our website. Quick View: Move mouse or cursor over ETF symbol (ticker) to view short-term technical chart and over ETF name to view long term chart. Click on ticker or stock name for detailed view. Click on to add stock symbol to your watchlist and to view watchlist. |
12Stocks.com List of ETFs that track Emerging Markets Index
| Ticker | ETF Name | Watchlist | Recent Price | Smart Investing & Trading Score | Change % | Week % | Year-to-date % |
| EEM | Emerging Markets | | 39.87 | 48 | 0.40 | -1.63 | -0.85% |
| VWO | Emerging Markets | | 41.01 | 53 | 0.27 | -1.42 | -0.22% |
| SCHE | Emerging Markets Equity | | 24.78 | 53 | 0.32 | -1.39 | -0.04% |
| EWX | Emerging Markets Small | | 55.61 | 43 | 0.47 | -0.8 | -1.51% |
| EET | Emerging Markets | | 48.03 | 41 | 0.17 | -3.55 | -5.56% |
| EDC | Emrg Mkts Bull | | 27.46 | 48 | 1.25 | -4.92 | -9.76% |
| EEV | Short Emerging | | 20.37 | 62 | -0.92 | 3.19 | 3.28% |
| EUM | Short Emerging | | 14.42 | 62 | -0.55 | 1.65 | 1.91% |
| EDIV | Emerging Markets Dividend | | 32.90 | 43 | 0.58 | -0.12 | 1.17% |
| EMIF | Emerging Markets Infrastructure | | 21.35 | 26 | -0.05 | -1.99 | -0.23% |
| CEW | Emerging Currency Strat | | 17.59 | 21 | 0.04 | -0.55 | -2.32% |
| EBND | Em Mkts Lcl | | 19.86 | 10 | -0.15 | -1.05 | -6.5% |
| EMCB | Emerging Markets Corp | | 63.85 | 10 | -0.19 | -0.39 | -0.08% |
| VWOB | Emerging Mkts Govt | | 62.16 | 10 | -0.03 | -0.8 | -2.49% |
| EEMA | Emerging Markets Asia | | 66.36 | 48 | 0.69 | -1.46 | 0.37% |
| EELV | Em Mkts Low | | 23.21 | 17 | 0.43 | -1.3 | -3.45% |
| DVYE | Emerging Markets Dividend | | 26.28 | 49 | -0.11 | -0.68 | -0.79% |
| SDEM | SuperDividend Em Mkts | | 25.71 | 66 | 0.51 | 0.03 | 3.68% |
| DBEM | Em Mkts Hdgd | | 23.22 | 41 | 0.65 | -1.28 | 0.65% |
| PCY | Emerging Markets Sov | | 19.76 | 18 | -0.20 | -1.3 | -4.17% |
| QEMM | Emerging Mkts StratcFacts | | 56.18 | 36 | 0.23 | -1.23 | -1.71% |
| 12Stocks.com: Charts, Trends, Fundamental Data and Performances of Emerging Markets Stocks | |
|
We now take in-depth look at all Emerging Markets stocks including charts, multi-period performances and overall trends (as measured by Smart Investing & Trading Score ). One can sort Emerging Markets stocks (click link to choose) by Daily, Weekly and by Year-to-Date performances. Also, one can sort by size of the company or by market capitalization. |
| Select Your Default Chart Type: | |||||
| |||||
| Click on stock symbol or name for detailed view. Click on to add stock symbol to your watchlist and to view watchlist. Quick View: Move mouse or cursor over "Daily" to quickly view daily technical stock chart and over "Weekly" to view weekly technical stock chart. | |||||

 | IMAB I Mab |
| Sector: Health Care | |
| SubSector: Biotechnology | |
| MarketCap: 26187 Millions | |
| Recent Price: 1.80 Smart Investing & Trading Score : 56 | |
| Day Percent Change: -0.55% Day Change: -0.01 | |
| Week Change: -0.55% Year-to-date Change: -5.3% | |
| IMAB Links: Profile News Message Board | |
| Charts:- Daily , Weekly | |
| Add IMAB to Watchlist: View: Get Complete IMAB Trend Analysis ➞ | |
 | HCM Hutchison China MediTech Limited |
| Sector: Health Care | |
| SubSector: Drug Manufacturers - Major | |
| MarketCap: 2324.43 Millions | |
| Recent Price: 16.36 Smart Investing & Trading Score : 31 | |
| Day Percent Change: -0.55% Day Change: -0.09 | |
| Week Change: -8.5% Year-to-date Change: -9.7% | |
| HCM Links: Profile News Message Board | |
| Charts:- Daily , Weekly | |
| Add HCM to Watchlist: View: Get Complete HCM Trend Analysis ➞ | |
 | RDY Dr. Reddy s Laboratories Limited |
| Sector: Health Care | |
| SubSector: Drug Manufacturers - Other | |
| MarketCap: 6590.23 Millions | |
| Recent Price: 70.91 Smart Investing & Trading Score : 18 | |
| Day Percent Change: -0.56% Day Change: -0.40 | |
| Week Change: -0.71% Year-to-date Change: 1.9% | |
| RDY Links: Profile News Message Board | |
| Charts:- Daily , Weekly | |
| Add RDY to Watchlist: View: Get Complete RDY Trend Analysis ➞ | |
 | AIXI Xiao-I Corporation |
| Sector: Technology | |
| SubSector: Software - Application | |
| MarketCap: 431 Millions | |
| Recent Price: 1.49 Smart Investing & Trading Score : 10 | |
| Day Percent Change: -0.67% Day Change: -0.01 | |
| Week Change: -11.31% Year-to-date Change: -33.8% | |
| AIXI Links: Profile News Message Board | |
| Charts:- Daily , Weekly | |
| Add AIXI to Watchlist: View: Get Complete AIXI Trend Analysis ➞ | |
 | PBR Petroleo Brasileiro S.A. - Petrobras |
| Sector: Energy | |
| SubSector: Oil & Gas Drilling & Exploration | |
| MarketCap: 38939.2 Millions | |
| Recent Price: 15.58 Smart Investing & Trading Score : 39 | |
| Day Percent Change: -0.70% Day Change: -0.11 | |
| Week Change: -0.89% Year-to-date Change: -2.4% | |
| PBR Links: Profile News Message Board | |
| Charts:- Daily , Weekly | |
| Add PBR to Watchlist: View: Get Complete PBR Trend Analysis ➞ | |
 | ERJ Embraer S.A. |
| Sector: Industrials | |
| SubSector: Aerospace/Defense Products & Services | |
| MarketCap: 1623.71 Millions | |
| Recent Price: 24.22 Smart Investing & Trading Score : 54 | |
| Day Percent Change: -0.74% Day Change: -0.18 | |
| Week Change: -2.54% Year-to-date Change: 31.3% | |
| ERJ Links: Profile News Message Board | |
| Charts:- Daily , Weekly | |
| Add ERJ to Watchlist: View: Get Complete ERJ Trend Analysis ➞ | |
 | BBD Banco Bradesco S.A. |
| Sector: Financials | |
| SubSector: Foreign Regional Banks | |
| MarketCap: 30281.7 Millions | |
| Recent Price: 2.63 Smart Investing & Trading Score : 10 | |
| Day Percent Change: -0.75% Day Change: -0.02 | |
| Week Change: -5.05% Year-to-date Change: -24.9% | |
| BBD Links: Profile News Message Board | |
| Charts:- Daily , Weekly | |
| Add BBD to Watchlist: View: Get Complete BBD Trend Analysis ➞ | |
 | IBN ICICI Bank Limited |
| Sector: Financials | |
| SubSector: Money Center Banks | |
| MarketCap: 31194.1 Millions | |
| Recent Price: 25.43 Smart Investing & Trading Score : 44 | |
| Day Percent Change: -0.78% Day Change: -0.20 | |
| Week Change: -2.72% Year-to-date Change: 6.7% | |
| IBN Links: Profile News Message Board | |
| Charts:- Daily , Weekly | |
| Add IBN to Watchlist: View: Get Complete IBN Trend Analysis ➞ | |
 | FENG Phoenix New Media Limited |
| Sector: Technology | |
| SubSector: Internet Information Providers | |
| MarketCap: 107.08 Millions | |
| Recent Price: 1.88 Smart Investing & Trading Score : 44 | |
| Day Percent Change: -0.79% Day Change: -0.01 | |
| Week Change: -7.64% Year-to-date Change: 37.9% | |
| FENG Links: Profile News Message Board | |
| Charts:- Daily , Weekly | |
| Add FENG to Watchlist: View: Get Complete FENG Trend Analysis ➞ | |
 | UMC United Microelectronics Corporation |
| Sector: Technology | |
| SubSector: Semiconductor Equipment & Materials | |
| MarketCap: 5672.78 Millions | |
| Recent Price: 7.53 Smart Investing & Trading Score : 0 | |
| Day Percent Change: -0.79% Day Change: -0.06 | |
| Week Change: -5.52% Year-to-date Change: -11.0% | |
| UMC Links: Profile News Message Board | |
| Charts:- Daily , Weekly | |
| Add UMC to Watchlist: View: Get Complete UMC Trend Analysis ➞ | |
 | SIFY Sify Technologies Limited |
| Sector: Technology | |
| SubSector: Internet Service Providers | |
| MarketCap: 159.38 Millions | |
| Recent Price: 1.23 Smart Investing & Trading Score : 10 | |
| Day Percent Change: -0.81% Day Change: -0.01 | |
| Week Change: -1.6% Year-to-date Change: -34.1% | |
| SIFY Links: Profile News Message Board | |
| Charts:- Daily , Weekly | |
| Add SIFY to Watchlist: View: Get Complete SIFY Trend Analysis ➞ | |
 | WDH Waterdrop Inc. |
| Sector: Financials | |
| SubSector: Insurance - Diversified | |
| MarketCap: 874 Millions | |
| Recent Price: 1.22 Smart Investing & Trading Score : 53 | |
| Day Percent Change: -0.81% Day Change: -0.01 | |
| Week Change: -2.4% Year-to-date Change: 16.5% | |
| WDH Links: Profile News Message Board | |
| Charts:- Daily , Weekly | |
| Add WDH to Watchlist: View: Get Complete WDH Trend Analysis ➞ | |
 | YSG Yatsen Holding Limited |
| Sector: Services & Goods | |
| SubSector: Specialty Retail | |
| MarketCap: 11827 Millions | |
| Recent Price: 3.58 Smart Investing & Trading Score : 83 | |
| Day Percent Change: -0.83% Day Change: -0.03 | |
| Week Change: 18.94% Year-to-date Change: 389.3% | |
| YSG Links: Profile News Message Board | |
| Charts:- Daily , Weekly | |
| Add YSG to Watchlist: View: Get Complete YSG Trend Analysis ➞ | |
 | DDL Dingdong (Cayman) Limited |
| Sector: Consumer Staples | |
| SubSector: Grocery Stores | |
| MarketCap: 708 Millions | |
| Recent Price: 1.12 Smart Investing & Trading Score : 5 | |
| Day Percent Change: -0.88% Day Change: -0.01 | |
| Week Change: -7.44% Year-to-date Change: -26.3% | |
| DDL Links: Profile News Message Board | |
| Charts:- Daily , Weekly | |
| Add DDL to Watchlist: View: Get Complete DDL Trend Analysis ➞ | |
 | QD Qudian Inc. |
| Sector: Technology | |
| SubSector: Information Technology Services | |
| MarketCap: 544.968 Millions | |
| Recent Price: 2.25 Smart Investing & Trading Score : 26 | |
| Day Percent Change: -0.88% Day Change: -0.02 | |
| Week Change: -7.02% Year-to-date Change: 10.3% | |
| QD Links: Profile News Message Board | |
| Charts:- Daily , Weekly | |
| Add QD to Watchlist: View: Get Complete QD Trend Analysis ➞ | |
 | SOHU Sohu.com Limited |
| Sector: Technology | |
| SubSector: Internet Information Providers | |
| MarketCap: 243.48 Millions | |
| Recent Price: 10.91 Smart Investing & Trading Score : 51 | |
| Day Percent Change: -0.91% Day Change: -0.10 | |
| Week Change: -4.55% Year-to-date Change: 9.9% | |
| SOHU Links: Profile News Message Board | |
| Charts:- Daily , Weekly | |
| Add SOHU to Watchlist: View: Get Complete SOHU Trend Analysis ➞ | |
 | UGP Ultrapar Participacoes S.A. |
| Sector: Energy | |
| SubSector: Oil & Gas Refining & Marketing | |
| MarketCap: 3473.54 Millions | |
| Recent Price: 5.08 Smart Investing & Trading Score : 7 | |
| Day Percent Change: -0.97% Day Change: -0.05 | |
| Week Change: -3.42% Year-to-date Change: -6.3% | |
| UGP Links: Profile News Message Board | |
| Charts:- Daily , Weekly | |
| Add UGP to Watchlist: View: Get Complete UGP Trend Analysis ➞ | |
 | NIU Niu Technologies |
| Sector: Consumer Staples | |
| SubSector: Auto Manufacturers - Major | |
| MarketCap: 543.271 Millions | |
| Recent Price: 2.03 Smart Investing & Trading Score : 61 | |
| Day Percent Change: -0.98% Day Change: -0.02 | |
| Week Change: -7.73% Year-to-date Change: -7.3% | |
| NIU Links: Profile News Message Board | |
| Charts:- Daily , Weekly | |
| Add NIU to Watchlist: View: Get Complete NIU Trend Analysis ➞ | |
 | HTHT Huazhu Group Limited |
| Sector: Services & Goods | |
| SubSector: Lodging | |
| MarketCap: 9164.46 Millions | |
| Recent Price: 37.36 Smart Investing & Trading Score : 36 | |
| Day Percent Change: -1.01% Day Change: -0.38 | |
| Week Change: -0.32% Year-to-date Change: 11.7% | |
| HTHT Links: Profile News Message Board | |
| Charts:- Daily , Weekly | |
| Add HTHT to Watchlist: View: Get Complete HTHT Trend Analysis ➞ | |
 | BEKE KE Holdings Inc. |
| Sector: Financials | |
| SubSector: Real Estate Services | |
| MarketCap: 80167 Millions | |
| Recent Price: 12.75 Smart Investing & Trading Score : 10 | |
| Day Percent Change: -1.01% Day Change: -0.13 | |
| Week Change: -3.12% Year-to-date Change: -21.3% | |
| BEKE Links: Profile News Message Board | |
| Charts:- Daily , Weekly | |
| Add BEKE to Watchlist: View: Get Complete BEKE Trend Analysis ➞ | |
 | PAGS PagSeguro Digital Ltd. |
| Sector: Financials | |
| SubSector: Credit Services | |
| MarketCap: 6500.78 Millions | |
| Recent Price: 11.55 Smart Investing & Trading Score : 10 | |
| Day Percent Change: -1.03% Day Change: -0.12 | |
| Week Change: -8.19% Year-to-date Change: -7.4% | |
| PAGS Links: Profile News Message Board | |
| Charts:- Daily , Weekly | |
| Add PAGS to Watchlist: View: Get Complete PAGS Trend Analysis ➞ | |
 | MOGU MOGU Inc. |
| Sector: Services & Goods | |
| SubSector: Specialty Retail, Other | |
| MarketCap: 168.844 Millions | |
| Recent Price: 1.88 Smart Investing & Trading Score : 10 | |
| Day Percent Change: -1.05% Day Change: -0.02 | |
| Week Change: -4.57% Year-to-date Change: -1.6% | |
| MOGU Links: Profile News Message Board | |
| Charts:- Daily , Weekly | |
| Add MOGU to Watchlist: View: Get Complete MOGU Trend Analysis ➞ | |
 | CNF CNFinance Holdings Limited |
| Sector: Financials | |
| SubSector: Credit Services | |
| MarketCap: 277.408 Millions | |
| Recent Price: 1.85 Smart Investing & Trading Score : 25 | |
| Day Percent Change: -1.07% Day Change: -0.02 | |
| Week Change: 0% Year-to-date Change: -16.7% | |
| CNF Links: Profile News Message Board | |
| Charts:- Daily , Weekly | |
| Add CNF to Watchlist: View: Get Complete CNF Trend Analysis ➞ | |
 | OMAB Grupo Aeroportuario del Centro Norte, S.A.B. de C.V. |
| Sector: Transports | |
| SubSector: Air Services, Other | |
| MarketCap: 1196.38 Millions | |
| Recent Price: 75.30 Smart Investing & Trading Score : 36 | |
| Day Percent Change: -1.08% Day Change: -0.82 | |
| Week Change: -5.35% Year-to-date Change: -11.0% | |
| OMAB Links: Profile News Message Board | |
| Charts:- Daily , Weekly | |
| Add OMAB to Watchlist: View: Get Complete OMAB Trend Analysis ➞ | |
 | SID Companhia Siderurgica Nacional |
| Sector: Materials | |
| SubSector: Steel & Iron | |
| MarketCap: 2087.58 Millions | |
| Recent Price: 2.72 Smart Investing & Trading Score : 10 | |
| Day Percent Change: -1.09% Day Change: -0.03 | |
| Week Change: -3.2% Year-to-date Change: -30.8% | |
| SID Links: Profile News Message Board | |
| Charts:- Daily , Weekly | |
| Add SID to Watchlist: View: Get Complete SID Trend Analysis ➞ | |
| For tabular summary view of above stock list: Summary View ➞ 0 - 25 , 25 - 50 , 50 - 75 , 75 - 100 , 100 - 125 , 125 - 150 , 150 - 175 , 175 - 200 | ||
| Click To Change The Sort Order: By Market Cap or Company Size Performance: Year-to-date, Week and Day | |
| Select Chart Type: | ||
|
Best Stocks Today 12Stocks.com |
© 2024 12Stocks.com Terms & Conditions Privacy Contact Us
All Information Provided Only For Education And Not To Be Used For Investing or Trading. See Terms & Conditions


One More Thing ... Get Best Stocks Delivered Daily!
Never Ever Miss A Move With Our Top Ten Stocks Lists
Find Best Stocks In Any Market - Bull or Bear Market
Take A Peek At Our Top Ten Stocks Lists: Daily, Weekly, Year-to-Date & Top Trends
Find Best Stocks In Any Market - Bull or Bear Market
Take A Peek At Our Top Ten Stocks Lists: Daily, Weekly, Year-to-Date & Top Trends
Emerging Markets Stocks With Best Up Trends [0-bearish to 100-bullish]: Zhongchao [100], GigaCloud [100], Smart Share[93], HDFC Bank[93], DouYu [90], TAL Education[90], GDS [88], JOYY [88], Gold Fields[85], U Power[83], Tencent Music[83]
Best Emerging Markets Stocks Year-to-Date:
U Power[2874.33%], Zhongchao [825.77%], DouYu [745.26%], MicroCloud Hologram[734.53%], China Liberal[459.28%], Yatsen Holding[389.34%], Uxin [136.8%], QuantaSing [112.65%], GigaCloud [100.82%], Yiren Digital[55.45%], Bright Scholar[50.4%] Best Emerging Markets Stocks This Week:
Zhongchao [106.1%], Regencell Bioscience[37.01%], Yatsen Holding[18.94%], TH [18.18%], Secoo Holding[11.83%], Controladora Vuela[11.35%], Smart Share[9.93%], GigaCloud [8.8%], EHang [8.29%], Momo [7.17%], SunCar [7%] Best Emerging Markets Stocks Daily:
Zhongchao [146.72%], MicroCloud Hologram[30.04%], TH [25.00%], Golden Heaven[21.20%], Regencell Bioscience[10.20%], MingZhu Logistics[9.54%], Secoo Holding[9.32%], Cheetah Mobile[9.06%], Quhuo [8.36%], U Power[8.11%], 17 Education[7.05%]