
 Login Sign Up


| |||||
 |  | ||||

| 12Stocks.com Market Intelligence |
Best Emerging Markets Stocks
| In a hurry? Emerging Markets Stocks Lists: Trends Table, Stock Charts
Sort Emerging Markets stocks: Daily, Weekly, Year-to-Date, Market Cap & Trends. Filter Emerging Markets stocks list by sector: Show all, Tech, Finance, Energy, Staples, Retail, Industrial, Materials, Utilities and HealthCare Filter Emerging Markets stocks list by size:All Large Medium Small |
| 12Stocks.com Emerging Markets Stocks Performances & Trends Daily | |||||||||
|
|  The overall Smart Investing & Trading Score is 49 (0-bearish to 100-bullish) which puts Emerging Markets index in short term neutral trend. The Smart Investing & Trading Score from previous trading session is 48 and hence an improvement of trend.
| ||||||||
Here are the Smart Investing & Trading Scores of the most requested Emerging Markets stocks at 12Stocks.com (click stock name for detailed review):
|


| 12Stocks.com: Top Performing Emerging Markets Index Stocks | ||||||||||||||||||||||||||||||||||||||||||||||||
 The top performing Emerging Markets Index stocks year to date are
Now, more recently, over last week, the top performing Emerging Markets Index stocks on the move are


|
||||||||||||||||||||||||||||||||||||||||||||||||
| 12Stocks.com: Investing in Emerging Markets Index with Stocks | |
|
The following table helps investors and traders sort through current performance and trends (as measured by Smart Investing & Trading Score ) of various
stocks in the Emerging Markets Index. Quick View: Move mouse or cursor over stock symbol (ticker) to view short-term technical chart and over stock name to view long term chart. Click on  to add stock symbol to your watchlist and to add stock symbol to your watchlist and  to view watchlist. Click on any ticker or stock name for detailed market intelligence report for that stock. to view watchlist. Click on any ticker or stock name for detailed market intelligence report for that stock. |
12Stocks.com Performance of Stocks in Emerging Markets Index
| Ticker | Stock Name | Watchlist | Category | Recent Price | Smart Investing & Trading Score | Change % | YTD Change% |
| PDD | Pinduoduo |   | Services & Goods | 113.49 | 10 | -0.18 | -22.43% |
| AFYA | Afya | | Services & Goods | 16.00 | 10 | -0.19 | -27.04% |
| XP | XP | | Financials | 21.02 | 10 | -0.24 | -19.37% |
| ZTO | ZTO Express | | Transports | 19.94 | 68 | -0.30 | -6.30% |
| YUMC | Yum China | | Services & Goods | 37.10 | 68 | -0.32 | -12.56% |
| XNET | Xunlei | | Technology | 1.47 | 17 | -0.34 | -9.26% |
| AZUL | Azul S.A | | Transports | 5.78 | 10 | -0.34 | -40.35% |
| OMAB | Grupo Aeroportuario | | Transports | 75.04 | 36 | -0.35 | -11.33% |
| YRD | Yiren Digital | | Financials | 4.83 | 61 | -0.41 | 54.81% |
| JKS | JinkoSolar Holding | | Technology | 21.56 | 20 | -0.46 | -41.64% |
| MMYT | MakeMyTrip | | Services & Goods | 60.92 | 36 | -0.49 | 29.67% |
| EDTK | Skillful Craftsman | | Consumer Staples | 0.92 | 18 | -0.54 | -27.38% |
| CNF | CNFinance | | Financials | 1.84 | 10 | -0.54 | -17.12% |
| DAO | Youdao | | Technology | 3.55 | 41 | -0.56 | -9.90% |
| BIDU | Baidu | | Technology | 95.03 | 17 | -0.58 | -20.21% |
| EM | Smart Share | | Services & Goods | 0.65 | 86 | -0.61 | 26.21% |
| BZ | Kanzhun | | Industrials | 17.91 | 61 | -0.61 | 8.41% |
| PAGS | PagSeguro Digital | | Financials | 11.48 | 17 | -0.61 | -7.94% |
| VLRS | Controladora Vuela | | Transports | 7.80 | 67 | -0.64 | -16.84% |
| GFI | Gold Fields | | Materials | 17.65 | 85 | -0.68 | 22.06% |
| VTRU | Vitru | | Consumer Staples | 12.33 | 20 | -0.76 | -22.06% |
| BEKE | KE | | Financials | 12.65 | 10 | -0.78 | -21.96% |
| CHT | Chunghwa Telecom | | Technology | 37.85 | 26 | -0.81 | -3.12% |
| VTMX | Vesta Financials | | Financials | 34.94 | 18 | -0.84 | -12.13% |
| SSL | Sasol | | Energy | 8.20 | 43 | -0.97 | -17.51% |
| For chart view version of above stock list: Chart View ➞ 0 - 25 , 25 - 50 , 50 - 75 , 75 - 100 , 100 - 125 , 125 - 150 , 150 - 175 , 175 - 200 | ||
 | Click To Change The Sort Order: By Market Cap or Company Size Performance: Year-to-date, Week and Day |  |
|
Get the most comprehensive stock market coverage daily at 12Stocks.com ➞ Best Stocks Today ➞ Best Stocks Weekly ➞ Best Stocks Year-to-Date ➞ Best Stocks Trends ➞  Best Stocks Today 12Stocks.com Best Nasdaq Stocks ➞ Best S&P 500 Stocks ➞ Best Tech Stocks ➞ Best Biotech Stocks ➞ |
| Detailed Overview of Emerging Markets Stocks |
| Emerging Markets Technical Overview, Leaders & Laggards, Top Emerging Markets ETF Funds & Detailed Emerging Markets Stocks List, Charts, Trends & More |
| Emerging Markets: Technical Analysis, Trends & YTD Performance | |
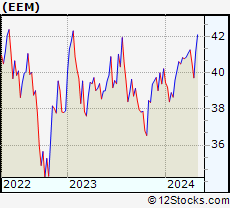
 EEM Weekly Chart |
|
| Long Term Trend: Good | |
| Medium Term Trend: Not Good | |
 EEM Daily Chart |
|
| Short Term Trend: Not Good | |
| Overall Trend Score: 49 | |
| YTD Performance: -1.24% | |
| **Trend Scores & Views Are Only For Educational Purposes And Not For Investing | |
| 12Stocks.com: Investing in Emerging Markets Index using Exchange Traded Funds | |
|
The following table shows list of key exchange traded funds (ETF) that
help investors play Emerging Markets stock market. For detailed view, check out our ETF Funds section of our website. Quick View: Move mouse or cursor over ETF symbol (ticker) to view short-term technical chart and over ETF name to view long term chart. Click on ticker or stock name for detailed view. Click on to add stock symbol to your watchlist and to view watchlist. |
12Stocks.com List of ETFs that track Emerging Markets Index
| Ticker | ETF Name | Watchlist | Recent Price | Smart Investing & Trading Score | Change % | Week % | Year-to-date % |
| EEM | Emerging Markets | | 39.71 | 49 | -0.40 | -2.02 | -1.24% |
| VWO | Emerging Markets | | 40.89 | 49 | -0.29 | -1.71 | -0.51% |
| SCHE | Emerging Markets Equity | | 24.69 | 46 | -0.36 | -1.75 | -0.4% |
| EWX | Emerging Markets Small | | 55.21 | 44 | -0.72 | -1.52 | -2.21% |
| EET | Emerging Markets | | 47.72 | 49 | -0.65 | -4.17 | -6.17% |
| EDC | Emrg Mkts Bull | | 27.03 | 49 | -1.57 | -6.41 | -11.17% |
| EEV | Short Emerging | | 20.51 | 54 | 0.69 | 3.9 | 3.99% |
| EUM | Short Emerging | | 14.50 | 62 | 0.55 | 2.22 | 2.47% |
| EDIV | Emerging Markets Dividend | | 33.01 | 36 | 0.33 | 0.21 | 1.51% |
| EMIF | Emerging Markets Infrastructure | | 21.38 | 51 | 0.14 | -1.85 | -0.09% |
| CEW | Emerging Currency Strat | | 17.61 | 21 | 0.10 | -0.45 | -2.22% |
| EBND | Em Mkts Lcl | | 19.93 | 17 | 0.35 | -0.7 | -6.17% |
| EMCB | Emerging Markets Corp | | 63.59 | 0 | -0.41 | -0.79 | -0.49% |
| VWOB | Emerging Mkts Govt | | 62.25 | 10 | 0.14 | -0.65 | -2.35% |
| EEMA | Emerging Markets Asia | | 66.09 | 49 | -0.40 | -1.85 | -0.03% |
| EELV | Em Mkts Low | | 23.16 | 10 | -0.22 | -1.51 | -3.66% |
| DVYE | Emerging Markets Dividend | | 26.48 | 56 | 0.76 | 0.08 | -0.04% |
| SDEM | SuperDividend Em Mkts | | 25.86 | 83 | 0.58 | 0.61 | 4.29% |
| DBEM | Em Mkts Hdgd | | 23.10 | 44 | -0.52 | -1.79 | 0.13% |
| PCY | Emerging Markets Sov | | 19.81 | 17 | 0.25 | -1.05 | -3.93% |
| QEMM | Emerging Mkts StratcFacts | | 55.95 | 36 | -0.41 | -1.64 | -2.11% |
| 12Stocks.com: Charts, Trends, Fundamental Data and Performances of Emerging Markets Stocks | |
|
We now take in-depth look at all Emerging Markets stocks including charts, multi-period performances and overall trends (as measured by Smart Investing & Trading Score ). One can sort Emerging Markets stocks (click link to choose) by Daily, Weekly and by Year-to-Date performances. Also, one can sort by size of the company or by market capitalization. |
| Select Your Default Chart Type: | |||||
| |||||
| Click on stock symbol or name for detailed view. Click on to add stock symbol to your watchlist and to view watchlist. Quick View: Move mouse or cursor over "Daily" to quickly view daily technical stock chart and over "Weekly" to view weekly technical stock chart. | |||||

 | PDD Pinduoduo Inc. |
| Sector: Services & Goods | |
| SubSector: Specialty Retail, Other | |
| MarketCap: 41696.2 Millions | |
| Recent Price: 113.49 Smart Investing & Trading Score : 10 | |
| Day Percent Change: -0.18% Day Change: -0.21 | |
| Week Change: -1.74% Year-to-date Change: -22.4% | |
| PDD Links: Profile News Message Board | |
| Charts:- Daily , Weekly | |
| Add PDD to Watchlist: View: Get Complete PDD Trend Analysis ➞ | |
 | AFYA Afya Limited |
| Sector: Services & Goods | |
| SubSector: Education & Training Services | |
| MarketCap: 1559.26 Millions | |
| Recent Price: 16.00 Smart Investing & Trading Score : 10 | |
| Day Percent Change: -0.19% Day Change: -0.03 | |
| Week Change: -5.66% Year-to-date Change: -27.0% | |
| AFYA Links: Profile News Message Board | |
| Charts:- Daily , Weekly | |
| Add AFYA to Watchlist: View: Get Complete AFYA Trend Analysis ➞ | |
 | XP XP Inc. |
| Sector: Financials | |
| SubSector: Asset Management | |
| MarketCap: 12990.3 Millions | |
| Recent Price: 21.02 Smart Investing & Trading Score : 10 | |
| Day Percent Change: -0.24% Day Change: -0.05 | |
| Week Change: -10.02% Year-to-date Change: -19.4% | |
| XP Links: Profile News Message Board | |
| Charts:- Daily , Weekly | |
| Add XP to Watchlist: View: Get Complete XP Trend Analysis ➞ | |
 | ZTO ZTO Express (Cayman) Inc. |
| Sector: Transports | |
| SubSector: Air Delivery & Freight Services | |
| MarketCap: 20507 Millions | |
| Recent Price: 19.94 Smart Investing & Trading Score : 68 | |
| Day Percent Change: -0.30% Day Change: -0.06 | |
| Week Change: 3.53% Year-to-date Change: -6.3% | |
| ZTO Links: Profile News Message Board | |
| Charts:- Daily , Weekly | |
| Add ZTO to Watchlist: View: Get Complete ZTO Trend Analysis ➞ | |
 | YUMC Yum China Holdings, Inc. |
| Sector: Services & Goods | |
| SubSector: Restaurants | |
| MarketCap: 16284.5 Millions | |
| Recent Price: 37.10 Smart Investing & Trading Score : 68 | |
| Day Percent Change: -0.32% Day Change: -0.12 | |
| Week Change: -0.64% Year-to-date Change: -12.6% | |
| YUMC Links: Profile News Message Board | |
| Charts:- Daily , Weekly | |
| Add YUMC to Watchlist: View: Get Complete YUMC Trend Analysis ➞ | |
 | XNET Xunlei Limited |
| Sector: Technology | |
| SubSector: Application Software | |
| MarketCap: 203.662 Millions | |
| Recent Price: 1.47 Smart Investing & Trading Score : 17 | |
| Day Percent Change: -0.34% Day Change: -0.01 | |
| Week Change: -1.67% Year-to-date Change: -9.3% | |
| XNET Links: Profile News Message Board | |
| Charts:- Daily , Weekly | |
| Add XNET to Watchlist: View: Get Complete XNET Trend Analysis ➞ | |
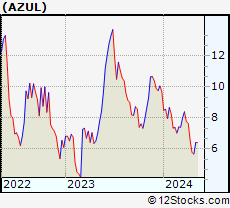 | AZUL Azul S.A. |
| Sector: Transports | |
| SubSector: Major Airlines | |
| MarketCap: 1289.85 Millions | |
| Recent Price: 5.78 Smart Investing & Trading Score : 10 | |
| Day Percent Change: -0.34% Day Change: -0.02 | |
| Week Change: -12.02% Year-to-date Change: -40.4% | |
| AZUL Links: Profile News Message Board | |
| Charts:- Daily , Weekly | |
| Add AZUL to Watchlist: View: Get Complete AZUL Trend Analysis ➞ | |
 | OMAB Grupo Aeroportuario del Centro Norte, S.A.B. de C.V. |
| Sector: Transports | |
| SubSector: Air Services, Other | |
| MarketCap: 1196.38 Millions | |
| Recent Price: 75.04 Smart Investing & Trading Score : 36 | |
| Day Percent Change: -0.35% Day Change: -0.26 | |
| Week Change: -5.68% Year-to-date Change: -11.3% | |
| OMAB Links: Profile News Message Board | |
| Charts:- Daily , Weekly | |
| Add OMAB to Watchlist: View: Get Complete OMAB Trend Analysis ➞ | |
 | YRD Yiren Digital Ltd. |
| Sector: Financials | |
| SubSector: Credit Services | |
| MarketCap: 330.208 Millions | |
| Recent Price: 4.83 Smart Investing & Trading Score : 61 | |
| Day Percent Change: -0.41% Day Change: -0.02 | |
| Week Change: -6.21% Year-to-date Change: 54.8% | |
| YRD Links: Profile News Message Board | |
| Charts:- Daily , Weekly | |
| Add YRD to Watchlist: View: Get Complete YRD Trend Analysis ➞ | |
 | JKS JinkoSolar Holding Co., Ltd. |
| Sector: Technology | |
| SubSector: Semiconductor - Specialized | |
| MarketCap: 629.36 Millions | |
| Recent Price: 21.56 Smart Investing & Trading Score : 20 | |
| Day Percent Change: -0.46% Day Change: -0.10 | |
| Week Change: -6.34% Year-to-date Change: -41.6% | |
| JKS Links: Profile News Message Board | |
| Charts:- Daily , Weekly | |
| Add JKS to Watchlist: View: Get Complete JKS Trend Analysis ➞ | |
 | MMYT MakeMyTrip Limited |
| Sector: Services & Goods | |
| SubSector: General Entertainment | |
| MarketCap: 1429.59 Millions | |
| Recent Price: 60.92 Smart Investing & Trading Score : 36 | |
| Day Percent Change: -0.49% Day Change: -0.30 | |
| Week Change: -11.22% Year-to-date Change: 29.7% | |
| MMYT Links: Profile News Message Board | |
| Charts:- Daily , Weekly | |
| Add MMYT to Watchlist: View: Get Complete MMYT Trend Analysis ➞ | |
 | EDTK Skillful Craftsman Education Technology Limited |
| Sector: Consumer Staples | |
| SubSector: Education & Training Services | |
| MarketCap: 32347 Millions | |
| Recent Price: 0.92 Smart Investing & Trading Score : 18 | |
| Day Percent Change: -0.54% Day Change: -0.01 | |
| Week Change: -0.54% Year-to-date Change: -27.4% | |
| EDTK Links: Profile News Message Board | |
| Charts:- Daily , Weekly | |
| Add EDTK to Watchlist: View: Get Complete EDTK Trend Analysis ➞ | |
 | CNF CNFinance Holdings Limited |
| Sector: Financials | |
| SubSector: Credit Services | |
| MarketCap: 277.408 Millions | |
| Recent Price: 1.84 Smart Investing & Trading Score : 10 | |
| Day Percent Change: -0.54% Day Change: -0.01 | |
| Week Change: -0.54% Year-to-date Change: -17.1% | |
| CNF Links: Profile News Message Board | |
| Charts:- Daily , Weekly | |
| Add CNF to Watchlist: View: Get Complete CNF Trend Analysis ➞ | |
 | DAO Youdao, Inc. |
| Sector: Technology | |
| SubSector: Internet Information Providers | |
| MarketCap: 2073.2 Millions | |
| Recent Price: 3.55 Smart Investing & Trading Score : 41 | |
| Day Percent Change: -0.56% Day Change: -0.02 | |
| Week Change: -11.03% Year-to-date Change: -9.9% | |
| DAO Links: Profile News Message Board | |
| Charts:- Daily , Weekly | |
| Add DAO to Watchlist: View: Get Complete DAO Trend Analysis ➞ | |
 | BIDU Baidu, Inc. |
| Sector: Technology | |
| SubSector: Internet Information Providers | |
| MarketCap: 33525.9 Millions | |
| Recent Price: 95.03 Smart Investing & Trading Score : 17 | |
| Day Percent Change: -0.58% Day Change: -0.55 | |
| Week Change: -2.58% Year-to-date Change: -20.2% | |
| BIDU Links: Profile News Message Board | |
| Charts:- Daily , Weekly | |
| Add BIDU to Watchlist: View: Get Complete BIDU Trend Analysis ➞ | |
 | EM Smart Share Global Limited |
| Sector: Services & Goods | |
| SubSector: Personal Services | |
| MarketCap: 238 Millions | |
| Recent Price: 0.65 Smart Investing & Trading Score : 86 | |
| Day Percent Change: -0.61% Day Change: 0.00 | |
| Week Change: 9.26% Year-to-date Change: 26.2% | |
| EM Links: Profile News Message Board | |
| Charts:- Daily , Weekly | |
| Add EM to Watchlist: View: Get Complete EM Trend Analysis ➞ | |
 | BZ Kanzhun Limited |
| Sector: Industrials | |
| SubSector: Staffing & Employment Services | |
| MarketCap: 6680 Millions | |
| Recent Price: 17.91 Smart Investing & Trading Score : 61 | |
| Day Percent Change: -0.61% Day Change: -0.11 | |
| Week Change: -4.4% Year-to-date Change: 8.4% | |
| BZ Links: Profile News Message Board | |
| Charts:- Daily , Weekly | |
| Add BZ to Watchlist: View: Get Complete BZ Trend Analysis ➞ | |
 | PAGS PagSeguro Digital Ltd. |
| Sector: Financials | |
| SubSector: Credit Services | |
| MarketCap: 6500.78 Millions | |
| Recent Price: 11.48 Smart Investing & Trading Score : 17 | |
| Day Percent Change: -0.61% Day Change: -0.07 | |
| Week Change: -8.74% Year-to-date Change: -7.9% | |
| PAGS Links: Profile News Message Board | |
| Charts:- Daily , Weekly | |
| Add PAGS to Watchlist: View: Get Complete PAGS Trend Analysis ➞ | |
 | VLRS Controladora Vuela Compania de Aviacion, S.A.B. de C.V. |
| Sector: Transports | |
| SubSector: Major Airlines | |
| MarketCap: 382 Millions | |
| Recent Price: 7.80 Smart Investing & Trading Score : 67 | |
| Day Percent Change: -0.64% Day Change: -0.05 | |
| Week Change: 10.64% Year-to-date Change: -16.8% | |
| VLRS Links: Profile News Message Board | |
| Charts:- Daily , Weekly | |
| Add VLRS to Watchlist: View: Get Complete VLRS Trend Analysis ➞ | |
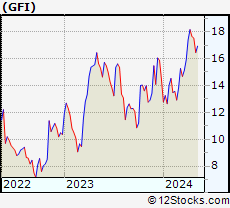 | GFI Gold Fields Limited |
| Sector: Materials | |
| SubSector: Gold | |
| MarketCap: 4908.39 Millions | |
| Recent Price: 17.65 Smart Investing & Trading Score : 85 | |
| Day Percent Change: -0.68% Day Change: -0.12 | |
| Week Change: -2.81% Year-to-date Change: 22.1% | |
| GFI Links: Profile News Message Board | |
| Charts:- Daily , Weekly | |
| Add GFI to Watchlist: View: Get Complete GFI Trend Analysis ➞ | |
 | VTRU Vitru Limited |
| Sector: Consumer Staples | |
| SubSector: Education & Training Services | |
| MarketCap: 33347 Millions | |
| Recent Price: 12.33 Smart Investing & Trading Score : 20 | |
| Day Percent Change: -0.76% Day Change: -0.10 | |
| Week Change: -11.93% Year-to-date Change: -22.1% | |
| VTRU Links: Profile News Message Board | |
| Charts:- Daily , Weekly | |
| Add VTRU to Watchlist: View: Get Complete VTRU Trend Analysis ➞ | |
 | BEKE KE Holdings Inc. |
| Sector: Financials | |
| SubSector: Real Estate Services | |
| MarketCap: 80167 Millions | |
| Recent Price: 12.65 Smart Investing & Trading Score : 10 | |
| Day Percent Change: -0.78% Day Change: -0.10 | |
| Week Change: -3.88% Year-to-date Change: -22.0% | |
| BEKE Links: Profile News Message Board | |
| Charts:- Daily , Weekly | |
| Add BEKE to Watchlist: View: Get Complete BEKE Trend Analysis ➞ | |
 | CHT Chunghwa Telecom Co., Ltd. |
| Sector: Technology | |
| SubSector: Telecom Services - Domestic | |
| MarketCap: 28101.3 Millions | |
| Recent Price: 37.85 Smart Investing & Trading Score : 26 | |
| Day Percent Change: -0.81% Day Change: -0.31 | |
| Week Change: -1.69% Year-to-date Change: -3.1% | |
| CHT Links: Profile News Message Board | |
| Charts:- Daily , Weekly | |
| Add CHT to Watchlist: View: Get Complete CHT Trend Analysis ➞ | |
 | VTMX Vesta Financials Corp SAB de CV |
| Sector: Financials | |
| SubSector: REIT - Industrial | |
| MarketCap: 2270 Millions | |
| Recent Price: 34.94 Smart Investing & Trading Score : 18 | |
| Day Percent Change: -0.84% Day Change: -0.30 | |
| Week Change: -2.1% Year-to-date Change: -12.1% | |
| VTMX Links: Profile News Message Board | |
| Charts:- Daily , Weekly | |
| Add VTMX to Watchlist: View: Get Complete VTMX Trend Analysis ➞ | |
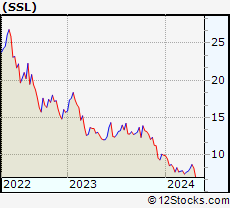 | SSL Sasol Limited |
| Sector: Energy | |
| SubSector: Major Integrated Oil & Gas | |
| MarketCap: 1233.85 Millions | |
| Recent Price: 8.20 Smart Investing & Trading Score : 43 | |
| Day Percent Change: -0.97% Day Change: -0.08 | |
| Week Change: -5.64% Year-to-date Change: -17.5% | |
| SSL Links: Profile News Message Board | |
| Charts:- Daily , Weekly | |
| Add SSL to Watchlist: View: Get Complete SSL Trend Analysis ➞ | |
| For tabular summary view of above stock list: Summary View ➞ 0 - 25 , 25 - 50 , 50 - 75 , 75 - 100 , 100 - 125 , 125 - 150 , 150 - 175 , 175 - 200 | ||
| Click To Change The Sort Order: By Market Cap or Company Size Performance: Year-to-date, Week and Day | |
| Select Chart Type: | ||
|
Best Stocks Today 12Stocks.com |
© 2024 12Stocks.com Terms & Conditions Privacy Contact Us
All Information Provided Only For Education And Not To Be Used For Investing or Trading. See Terms & Conditions


One More Thing ... Get Best Stocks Delivered Daily!
Never Ever Miss A Move With Our Top Ten Stocks Lists
Find Best Stocks In Any Market - Bull or Bear Market
Take A Peek At Our Top Ten Stocks Lists: Daily, Weekly, Year-to-Date & Top Trends
Find Best Stocks In Any Market - Bull or Bear Market
Take A Peek At Our Top Ten Stocks Lists: Daily, Weekly, Year-to-Date & Top Trends
Emerging Markets Stocks With Best Up Trends [0-bearish to 100-bullish]: HDFC Bank[93], Full Truck[93], Bright Scholar[90], DouYu [90], Harmony Gold[88], GDS [88], GigaCloud [88], Smart Share[86], Gold Fields[85], Lufax Holding[83], So-Young [83]
Best Emerging Markets Stocks Year-to-Date:
U Power[2812.95%], DouYu [747.37%], MicroCloud Hologram[664.03%], China Liberal[476.51%], Zhongchao [412.19%], Yatsen Holding[394.12%], Uxin [141.08%], QuantaSing [117.28%], GigaCloud [95.49%], Bright Scholar[60.8%], Cheetah Mobile[55.26%] Best Emerging Markets Stocks This Week:
Regencell Bioscience[37.01%], Yatsen Holding[20.1%], MingZhu Logistics[17.48%], Secoo Holding[17.14%], Zhongchao [14.02%], Controladora Vuela[10.64%], TH [10%], Smart Share[9.26%], Bright Scholar[9.24%], Quhuo [8.87%], DouYu [6.62%] Best Emerging Markets Stocks Daily:
Hywin [17.78%], Ambipar Emergency[13.26%], MingZhu Logistics[10.31%], Lanvin [8.39%], Bright Scholar[6.91%], MOGU [5.85%], Petroleo Brasileiro[5.71%], Cheetah Mobile[5.04%], Dingdong (Cayman)[4.91%], Secoo Holding[4.75%], Fanhua [4.69%]