
 Login Sign Up


| |||||
 |  | ||||

| 12Stocks.com Market Intelligence |
Best Emerging Markets Stocks
| In a hurry? Emerging Markets Stocks Lists: Trends Table, Stock Charts
Sort Emerging Markets stocks: Daily, Weekly, Year-to-Date, Market Cap & Trends. Filter Emerging Markets stocks list by sector: Show all, Tech, Finance, Energy, Staples, Retail, Industrial, Materials, Utilities and HealthCare Filter Emerging Markets stocks list by size:All Large Medium Small |
| 12Stocks.com Emerging Markets Stocks Performances & Trends Daily | |||||||||
|
|  The overall Smart Investing & Trading Score is 56 (0-bearish to 100-bullish) which puts Emerging Markets index in short term neutral trend. The Smart Investing & Trading Score from previous trading session is 38 and hence an improvement of trend.
| ||||||||
Here are the Smart Investing & Trading Scores of the most requested Emerging Markets stocks at 12Stocks.com (click stock name for detailed review):
|


| 12Stocks.com: Top Performing Emerging Markets Index Stocks | ||||||||||||||||||||||||||||||||||||||||||||||||
 The top performing Emerging Markets Index stocks year to date are
Now, more recently, over last week, the top performing Emerging Markets Index stocks on the move are


|
||||||||||||||||||||||||||||||||||||||||||||||||
| 12Stocks.com: Investing in Emerging Markets Index with Stocks | |
|
The following table helps investors and traders sort through current performance and trends (as measured by Smart Investing & Trading Score ) of various
stocks in the Emerging Markets Index. Quick View: Move mouse or cursor over stock symbol (ticker) to view short-term technical chart and over stock name to view long term chart. Click on  to add stock symbol to your watchlist and to add stock symbol to your watchlist and  to view watchlist. Click on any ticker or stock name for detailed market intelligence report for that stock. to view watchlist. Click on any ticker or stock name for detailed market intelligence report for that stock. |
12Stocks.com Performance of Stocks in Emerging Markets Index
| Ticker | Stock Name | Watchlist | Category | Recent Price | Smart Investing & Trading Score | Change % | Weekly Change% |
| XPEV | XPeng |   | Services & Goods | 7.24 | 28 | -2.49% | -3.02% |
| VIV | Telefonica Brasil | | Technology | 9.27 | 10 | -0.54% | -3.03% |
| DQ | Daqo New | | Technology | 22.63 | 46 | 1.07% | -3.04% |
| IMOS | ChipMOS | | Technology | 28.88 | 53 | 0.00% | -3.25% |
| SOHU | Sohu.com | | Technology | 11.05 | 51 | 0.36% | -3.32% |
| NU | Nu | | Financials | 10.91 | 49 | 1.11% | -3.37% |
| ASX | ASE | | Technology | 10.48 | 31 | -1.04% | -3.41% |
| UGP | Ultrapar Participacoes | | Energy | 5.08 | 7 | -0.97% | -3.42% |
| HSAI | Hesai | | Services & Goods | 4.37 | 37 | 1.63% | -3.43% |
| HOLO | MicroCloud Hologram | | Technology | 2.81 | 58 | 26.01% | -3.44% |
| MOGU | MOGU | | Services & Goods | 1.90 | 25 | 0.00% | -3.55% |
| ASR | Grupo Aeroportuario | | Transports | 305.47 | 36 | 0.57% | -3.64% |
| ATHM | Autohome | | Technology | 24.30 | 10 | 0.12% | -3.72% |
| BSBR | Banco Santander | | Financials | 5.13 | 17 | 0.00% | -3.75% |
| BZ | Kanzhun | | Industrials | 18.02 | 51 | -0.50% | -3.82% |
| ABEV | Ambev S.A | | Consumer Staples | 2.26 | 10 | 0.00% | -3.83% |
| EBON | Ebang | | Technology | 8.01 | 32 | 2.04% | -3.84% |
| CX | CEMEX S.A.B. | | Industrials | 8.22 | 23 | 0.55% | -3.91% |
| FMX | Fomento Economico | | Consumer Staples | 119.36 | 17 | 0.35% | -3.93% |
| LVRO | Lavoro | | Materials | 5.84 | 17 | 0.09% | -4.02% |
| TUYA | Tuya | | Technology | 1.64 | 17 | -1.20% | -4.09% |
| PAC | Grupo Aeroportuario | | Transports | 156.10 | 23 | 1.17% | -4.09% |
| BBD | Banco Bradesco | | Financials | 2.65 | 10 | 0.19% | -4.15% |
| BGNE | BeiGene | | Health Care | 135.20 | 17 | 2.53% | -4.32% |
| SSL | Sasol | | Energy | 8.30 | 35 | 1.78% | -4.43% |
| For chart view version of above stock list: Chart View ➞ 0 - 25 , 25 - 50 , 50 - 75 , 75 - 100 , 100 - 125 , 125 - 150 | ||
 | Click To Change The Sort Order: By Market Cap or Company Size Performance: Year-to-date, Week and Day |  |
|
Get the most comprehensive stock market coverage daily at 12Stocks.com ➞ Best Stocks Today ➞ Best Stocks Weekly ➞ Best Stocks Year-to-Date ➞ Best Stocks Trends ➞  Best Stocks Today 12Stocks.com Best Nasdaq Stocks ➞ Best S&P 500 Stocks ➞ Best Tech Stocks ➞ Best Biotech Stocks ➞ |
| Detailed Overview of Emerging Markets Stocks |
| Emerging Markets Technical Overview, Leaders & Laggards, Top Emerging Markets ETF Funds & Detailed Emerging Markets Stocks List, Charts, Trends & More |
| Emerging Markets: Technical Analysis, Trends & YTD Performance | |
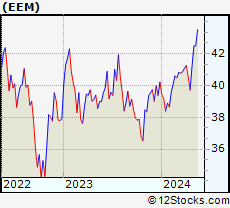
 EEM Weekly Chart |
|
| Long Term Trend: Very Good | |
| Medium Term Trend: Not Good | |
 EEM Daily Chart |
|
| Short Term Trend: Deteriorating | |
| Overall Trend Score: 56 | |
| YTD Performance: -0.37% | |
| **Trend Scores & Views Are Only For Educational Purposes And Not For Investing | |
| 12Stocks.com: Investing in Emerging Markets Index using Exchange Traded Funds | |
|
The following table shows list of key exchange traded funds (ETF) that
help investors play Emerging Markets stock market. For detailed view, check out our ETF Funds section of our website. Quick View: Move mouse or cursor over ETF symbol (ticker) to view short-term technical chart and over ETF name to view long term chart. Click on ticker or stock name for detailed view. Click on to add stock symbol to your watchlist and to view watchlist. |
12Stocks.com List of ETFs that track Emerging Markets Index
| Ticker | ETF Name | Watchlist | Recent Price | Smart Investing & Trading Score | Change % | Week % | Year-to-date % |
| EEM | Emerging Markets | | 40.06 | 56 | 0.88 | -1.16 | -0.37% |
| VWO | Emerging Markets | | 41.16 | 61 | 0.64 | -1.06 | 0.15% |
| SCHE | Emerging Markets Equity | | 24.78 | 53 | 0.32 | -1.39 | -0.04% |
| EET | Emerging Markets | | 48.59 | 41 | 1.33 | -2.43 | -4.47% |
| EDC | Emrg Mkts Bull | | 27.79 | 48 | 2.47 | -3.77 | -8.68% |
| EEV | Short Emerging | | 20.34 | 62 | -1.07 | 3.04 | 3.13% |
| EUM | Short Emerging | | 14.38 | 45 | -0.86 | 1.34 | 1.59% |
| PCY | Emerging Markets Sov | | 19.82 | 25 | 0.08 | -1.02 | -3.9% |
| 12Stocks.com: Charts, Trends, Fundamental Data and Performances of Emerging Markets Stocks | |
|
We now take in-depth look at all Emerging Markets stocks including charts, multi-period performances and overall trends (as measured by Smart Investing & Trading Score ). One can sort Emerging Markets stocks (click link to choose) by Daily, Weekly and by Year-to-Date performances. Also, one can sort by size of the company or by market capitalization. |
| Select Your Default Chart Type: | |||||
| |||||
| Click on stock symbol or name for detailed view. Click on to add stock symbol to your watchlist and to view watchlist. Quick View: Move mouse or cursor over "Daily" to quickly view daily technical stock chart and over "Weekly" to view weekly technical stock chart. | |||||

 | XPEV XPeng Inc. |
| Sector: Services & Goods | |
| SubSector: Auto Manufacturers | |
| MarketCap: 32917 Millions | |
| Recent Price: 7.24 Smart Investing & Trading Score : 28 | |
| Day Percent Change: -2.49% Day Change: -0.18 | |
| Week Change: -3.02% Year-to-date Change: -50.4% | |
| XPEV Links: Profile News Message Board | |
| Charts:- Daily , Weekly | |
| Add XPEV to Watchlist: View: Get Complete XPEV Trend Analysis ➞ | |
 | VIV Telefonica Brasil S.A. |
| Sector: Technology | |
| SubSector: Wireless Communications | |
| MarketCap: 19611.1 Millions | |
| Recent Price: 9.27 Smart Investing & Trading Score : 10 | |
| Day Percent Change: -0.54% Day Change: -0.05 | |
| Week Change: -3.03% Year-to-date Change: -15.3% | |
| VIV Links: Profile News Message Board | |
| Charts:- Daily , Weekly | |
| Add VIV to Watchlist: View: Get Complete VIV Trend Analysis ➞ | |
 | DQ Daqo New Energy Corp. |
| Sector: Technology | |
| SubSector: Semiconductor Equipment & Materials | |
| MarketCap: 660.918 Millions | |
| Recent Price: 22.63 Smart Investing & Trading Score : 46 | |
| Day Percent Change: 1.07% Day Change: 0.24 | |
| Week Change: -3.04% Year-to-date Change: -14.9% | |
| DQ Links: Profile News Message Board | |
| Charts:- Daily , Weekly | |
| Add DQ to Watchlist: View: Get Complete DQ Trend Analysis ➞ | |
 | IMOS ChipMOS TECHNOLOGIES INC. |
| Sector: Technology | |
| SubSector: Semiconductor Equipment & Materials | |
| MarketCap: 658.918 Millions | |
| Recent Price: 28.88 Smart Investing & Trading Score : 53 | |
| Day Percent Change: 0.00% Day Change: 0.00 | |
| Week Change: -3.25% Year-to-date Change: 6.1% | |
| IMOS Links: Profile News Message Board | |
| Charts:- Daily , Weekly | |
| Add IMOS to Watchlist: View: Get Complete IMOS Trend Analysis ➞ | |
 | SOHU Sohu.com Limited |
| Sector: Technology | |
| SubSector: Internet Information Providers | |
| MarketCap: 243.48 Millions | |
| Recent Price: 11.05 Smart Investing & Trading Score : 51 | |
| Day Percent Change: 0.36% Day Change: 0.04 | |
| Week Change: -3.32% Year-to-date Change: 11.3% | |
| SOHU Links: Profile News Message Board | |
| Charts:- Daily , Weekly | |
| Add SOHU to Watchlist: View: Get Complete SOHU Trend Analysis ➞ | |
 | NU Nu Holdings Ltd. |
| Sector: Financials | |
| SubSector: Banks - Diversified | |
| MarketCap: 37240 Millions | |
| Recent Price: 10.91 Smart Investing & Trading Score : 49 | |
| Day Percent Change: 1.11% Day Change: 0.12 | |
| Week Change: -3.37% Year-to-date Change: 30.8% | |
| NU Links: Profile News Message Board | |
| Charts:- Daily , Weekly | |
| Add NU to Watchlist: View: Get Complete NU Trend Analysis ➞ | |
 | ASX ASE Technology Holding Co., Ltd. |
| Sector: Technology | |
| SubSector: Semiconductor Equipment & Materials | |
| MarketCap: 8513.18 Millions | |
| Recent Price: 10.48 Smart Investing & Trading Score : 31 | |
| Day Percent Change: -1.04% Day Change: -0.11 | |
| Week Change: -3.41% Year-to-date Change: 11.4% | |
| ASX Links: Profile News Message Board | |
| Charts:- Daily , Weekly | |
| Add ASX to Watchlist: View: Get Complete ASX Trend Analysis ➞ | |
 | UGP Ultrapar Participacoes S.A. |
| Sector: Energy | |
| SubSector: Oil & Gas Refining & Marketing | |
| MarketCap: 3473.54 Millions | |
| Recent Price: 5.08 Smart Investing & Trading Score : 7 | |
| Day Percent Change: -0.97% Day Change: -0.05 | |
| Week Change: -3.42% Year-to-date Change: -6.3% | |
| UGP Links: Profile News Message Board | |
| Charts:- Daily , Weekly | |
| Add UGP to Watchlist: View: Get Complete UGP Trend Analysis ➞ | |
 | HSAI Hesai Group |
| Sector: Services & Goods | |
| SubSector: Auto Parts | |
| MarketCap: 1330 Millions | |
| Recent Price: 4.37 Smart Investing & Trading Score : 37 | |
| Day Percent Change: 1.63% Day Change: 0.07 | |
| Week Change: -3.43% Year-to-date Change: -51.9% | |
| HSAI Links: Profile News Message Board | |
| Charts:- Daily , Weekly | |
| Add HSAI to Watchlist: View: Get Complete HSAI Trend Analysis ➞ | |
 | HOLO MicroCloud Hologram Inc. |
| Sector: Technology | |
| SubSector: Electronic Components | |
| MarketCap: 159 Millions | |
| Recent Price: 2.81 Smart Investing & Trading Score : 58 | |
| Day Percent Change: 26.01% Day Change: 0.58 | |
| Week Change: -3.44% Year-to-date Change: 708.6% | |
| HOLO Links: Profile News Message Board | |
| Charts:- Daily , Weekly | |
| Add HOLO to Watchlist: View: Get Complete HOLO Trend Analysis ➞ | |
 | MOGU MOGU Inc. |
| Sector: Services & Goods | |
| SubSector: Specialty Retail, Other | |
| MarketCap: 168.844 Millions | |
| Recent Price: 1.90 Smart Investing & Trading Score : 25 | |
| Day Percent Change: 0.00% Day Change: 0.00 | |
| Week Change: -3.55% Year-to-date Change: -0.5% | |
| MOGU Links: Profile News Message Board | |
| Charts:- Daily , Weekly | |
| Add MOGU to Watchlist: View: Get Complete MOGU Trend Analysis ➞ | |
 | ASR Grupo Aeroportuario del Sureste, S. A. B. de C. V. |
| Sector: Transports | |
| SubSector: Air Services, Other | |
| MarketCap: 2739.98 Millions | |
| Recent Price: 305.47 Smart Investing & Trading Score : 36 | |
| Day Percent Change: 0.57% Day Change: 1.73 | |
| Week Change: -3.64% Year-to-date Change: 3.8% | |
| ASR Links: Profile News Message Board | |
| Charts:- Daily , Weekly | |
| Add ASR to Watchlist: View: Get Complete ASR Trend Analysis ➞ | |
 | ATHM Autohome Inc. |
| Sector: Technology | |
| SubSector: Internet Information Providers | |
| MarketCap: 7984.2 Millions | |
| Recent Price: 24.30 Smart Investing & Trading Score : 10 | |
| Day Percent Change: 0.12% Day Change: 0.03 | |
| Week Change: -3.72% Year-to-date Change: -13.4% | |
| ATHM Links: Profile News Message Board | |
| Charts:- Daily , Weekly | |
| Add ATHM to Watchlist: View: Get Complete ATHM Trend Analysis ➞ | |
 | BSBR Banco Santander (Brasil) S.A. |
| Sector: Financials | |
| SubSector: Foreign Regional Banks | |
| MarketCap: 21961.4 Millions | |
| Recent Price: 5.13 Smart Investing & Trading Score : 17 | |
| Day Percent Change: 0.00% Day Change: 0.00 | |
| Week Change: -3.75% Year-to-date Change: -21.7% | |
| BSBR Links: Profile News Message Board | |
| Charts:- Daily , Weekly | |
| Add BSBR to Watchlist: View: Get Complete BSBR Trend Analysis ➞ | |
 | BZ Kanzhun Limited |
| Sector: Industrials | |
| SubSector: Staffing & Employment Services | |
| MarketCap: 6680 Millions | |
| Recent Price: 18.02 Smart Investing & Trading Score : 51 | |
| Day Percent Change: -0.50% Day Change: -0.09 | |
| Week Change: -3.82% Year-to-date Change: 9.1% | |
| BZ Links: Profile News Message Board | |
| Charts:- Daily , Weekly | |
| Add BZ to Watchlist: View: Get Complete BZ Trend Analysis ➞ | |
 | ABEV Ambev S.A. |
| Sector: Consumer Staples | |
| SubSector: Beverages - Brewers | |
| MarketCap: 37753.5 Millions | |
| Recent Price: 2.26 Smart Investing & Trading Score : 10 | |
| Day Percent Change: 0.00% Day Change: 0.00 | |
| Week Change: -3.83% Year-to-date Change: -19.3% | |
| ABEV Links: Profile News Message Board | |
| Charts:- Daily , Weekly | |
| Add ABEV to Watchlist: View: Get Complete ABEV Trend Analysis ➞ | |
 | EBON Ebang International Holdings Inc. |
| Sector: Technology | |
| SubSector: Computer Hardware | |
| MarketCap: 33787 Millions | |
| Recent Price: 8.01 Smart Investing & Trading Score : 32 | |
| Day Percent Change: 2.04% Day Change: 0.16 | |
| Week Change: -3.84% Year-to-date Change: -47.6% | |
| EBON Links: Profile News Message Board | |
| Charts:- Daily , Weekly | |
| Add EBON to Watchlist: View: Get Complete EBON Trend Analysis ➞ | |
 | CX CEMEX, S.A.B. de C.V. |
| Sector: Industrials | |
| SubSector: Cement | |
| MarketCap: 2948.23 Millions | |
| Recent Price: 8.22 Smart Investing & Trading Score : 23 | |
| Day Percent Change: 0.55% Day Change: 0.04 | |
| Week Change: -3.91% Year-to-date Change: 6.1% | |
| CX Links: Profile News Message Board | |
| Charts:- Daily , Weekly | |
| Add CX to Watchlist: View: Get Complete CX Trend Analysis ➞ | |
 | FMX Fomento Economico Mexicano, S.A.B. de C.V. |
| Sector: Consumer Staples | |
| SubSector: Beverages - Brewers | |
| MarketCap: 22018.7 Millions | |
| Recent Price: 119.36 Smart Investing & Trading Score : 17 | |
| Day Percent Change: 0.35% Day Change: 0.42 | |
| Week Change: -3.93% Year-to-date Change: -8.4% | |
| FMX Links: Profile News Message Board | |
| Charts:- Daily , Weekly | |
| Add FMX to Watchlist: View: Get Complete FMX Trend Analysis ➞ | |
 | LVRO Lavoro Limited |
| Sector: Materials | |
| SubSector: Agricultural Inputs | |
| MarketCap: 686 Millions | |
| Recent Price: 5.84 Smart Investing & Trading Score : 17 | |
| Day Percent Change: 0.09% Day Change: 0.00 | |
| Week Change: -4.02% Year-to-date Change: -34.2% | |
| LVRO Links: Profile News Message Board | |
| Charts:- Daily , Weekly | |
| Add LVRO to Watchlist: View: Get Complete LVRO Trend Analysis ➞ | |
 | TUYA Tuya Inc. |
| Sector: Technology | |
| SubSector: Software - Infrastructure | |
| MarketCap: 1050 Millions | |
| Recent Price: 1.64 Smart Investing & Trading Score : 17 | |
| Day Percent Change: -1.20% Day Change: -0.02 | |
| Week Change: -4.09% Year-to-date Change: -28.5% | |
| TUYA Links: Profile News Message Board | |
| Charts:- Daily , Weekly | |
| Add TUYA to Watchlist: View: Get Complete TUYA Trend Analysis ➞ | |
 | PAC Grupo Aeroportuario del Pacifico, S.A.B. de C.V. |
| Sector: Transports | |
| SubSector: Air Services, Other | |
| MarketCap: 3204.18 Millions | |
| Recent Price: 156.10 Smart Investing & Trading Score : 23 | |
| Day Percent Change: 1.17% Day Change: 1.81 | |
| Week Change: -4.09% Year-to-date Change: -10.9% | |
| PAC Links: Profile News Message Board | |
| Charts:- Daily , Weekly | |
| Add PAC to Watchlist: View: Get Complete PAC Trend Analysis ➞ | |
 | BBD Banco Bradesco S.A. |
| Sector: Financials | |
| SubSector: Foreign Regional Banks | |
| MarketCap: 30281.7 Millions | |
| Recent Price: 2.65 Smart Investing & Trading Score : 10 | |
| Day Percent Change: 0.19% Day Change: 0.00 | |
| Week Change: -4.15% Year-to-date Change: -24.1% | |
| BBD Links: Profile News Message Board | |
| Charts:- Daily , Weekly | |
| Add BBD to Watchlist: View: Get Complete BBD Trend Analysis ➞ | |
 | BGNE BeiGene, Ltd. |
| Sector: Health Care | |
| SubSector: Biotechnology | |
| MarketCap: 10838.5 Millions | |
| Recent Price: 135.20 Smart Investing & Trading Score : 17 | |
| Day Percent Change: 2.53% Day Change: 3.34 | |
| Week Change: -4.32% Year-to-date Change: -25.0% | |
| BGNE Links: Profile News Message Board | |
| Charts:- Daily , Weekly | |
| Add BGNE to Watchlist: View: Get Complete BGNE Trend Analysis ➞ | |
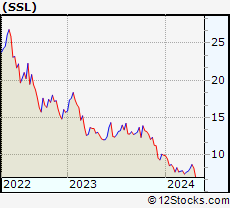 | SSL Sasol Limited |
| Sector: Energy | |
| SubSector: Major Integrated Oil & Gas | |
| MarketCap: 1233.85 Millions | |
| Recent Price: 8.30 Smart Investing & Trading Score : 35 | |
| Day Percent Change: 1.78% Day Change: 0.14 | |
| Week Change: -4.43% Year-to-date Change: -16.5% | |
| SSL Links: Profile News Message Board | |
| Charts:- Daily , Weekly | |
| Add SSL to Watchlist: View: Get Complete SSL Trend Analysis ➞ | |
| For tabular summary view of above stock list: Summary View ➞ 0 - 25 , 25 - 50 , 50 - 75 , 75 - 100 , 100 - 125 , 125 - 150 | ||
| Click To Change The Sort Order: By Market Cap or Company Size Performance: Year-to-date, Week and Day | |
| Select Chart Type: | ||
|
Best Stocks Today 12Stocks.com |
© 2024 12Stocks.com Terms & Conditions Privacy Contact Us
All Information Provided Only For Education And Not To Be Used For Investing or Trading. See Terms & Conditions


One More Thing ... Get Best Stocks Delivered Daily!
Never Ever Miss A Move With Our Top Ten Stocks Lists
Find Best Stocks In Any Market - Bull or Bear Market
Take A Peek At Our Top Ten Stocks Lists: Daily, Weekly, Year-to-Date & Top Trends
Find Best Stocks In Any Market - Bull or Bear Market
Take A Peek At Our Top Ten Stocks Lists: Daily, Weekly, Year-to-Date & Top Trends
Emerging Markets Stocks With Best Up Trends [0-bearish to 100-bullish]: GigaCloud [100], Baozun [95], HDFC Bank[93], TAL Education[90], Yatsen Holding[88], Harmony Gold[88], JOYY [88], GDS [88], DRDGOLD [88], Gold Fields[85], U Power[83]
Best Emerging Markets Stocks Year-to-Date:
U Power[2874.33%], MicroCloud Hologram[708.63%], China Liberal[459.28%], Yatsen Holding[403.01%], Zhongchao [275.24%], QuantaSing [112.65%], GigaCloud [101.28%], Yiren Digital[57.37%], Harmony Gold[50.49%], Cheetah Mobile[50.44%], Lufax Holding[39.58%] Best Emerging Markets Stocks This Week:
Regencell Bioscience[24.34%], Yatsen Holding[22.26%], TH [18.18%], GigaCloud [9.05%], Controladora Vuela[8.44%], Momo [7.92%], Smart Share[7.58%], SunCar [7%], Quhuo [6.85%], Weibo [5.24%], Baozun [5.06%] Best Emerging Markets Stocks Daily:
MicroCloud Hologram[26.01%], TH [25.00%], Cheetah Mobile[11.00%], Quhuo [8.36%], U Power[8.11%], WiMi Hologram[6.52%], Baozun [5.96%], GigaCloud [5.51%], Yiren Digital[4.25%], Lixiang Education[4.00%], Atour Lifestyle[3.67%]