
 Login Sign Up


| |||||
 |  | ||||

| 12Stocks.com Market Intelligence |
Best Emerging Markets Stocks
| In a hurry? Emerging Markets Stocks Lists: Trends Table, Stock Charts
Sort Emerging Markets stocks: Daily, Weekly, Year-to-Date, Market Cap & Trends. Filter Emerging Markets stocks list by sector: Show all, Tech, Finance, Energy, Staples, Retail, Industrial, Materials, Utilities and HealthCare Filter Emerging Markets stocks list by size:All Large Medium Small |
| 12Stocks.com Emerging Markets Stocks Performances & Trends Daily | |||||||||
|
|  The overall Smart Investing & Trading Score is 49 (0-bearish to 100-bullish) which puts Emerging Markets index in short term neutral trend. The Smart Investing & Trading Score from previous trading session is 48 and hence an improvement of trend.
| ||||||||
Here are the Smart Investing & Trading Scores of the most requested Emerging Markets stocks at 12Stocks.com (click stock name for detailed review):
|


| 12Stocks.com: Top Performing Emerging Markets Index Stocks | ||||||||||||||||||||||||||||||||||||||||||||||||
 The top performing Emerging Markets Index stocks year to date are
Now, more recently, over last week, the top performing Emerging Markets Index stocks on the move are


|
||||||||||||||||||||||||||||||||||||||||||||||||
| 12Stocks.com: Investing in Emerging Markets Index with Stocks | |
|
The following table helps investors and traders sort through current performance and trends (as measured by Smart Investing & Trading Score ) of various
stocks in the Emerging Markets Index. Quick View: Move mouse or cursor over stock symbol (ticker) to view short-term technical chart and over stock name to view long term chart. Click on  to add stock symbol to your watchlist and to add stock symbol to your watchlist and  to view watchlist. Click on any ticker or stock name for detailed market intelligence report for that stock. to view watchlist. Click on any ticker or stock name for detailed market intelligence report for that stock. |
12Stocks.com Performance of Stocks in Emerging Markets Index
| Ticker | Stock Name | Watchlist | Category | Recent Price | Smart Investing & Trading Score | Change % | YTD Change% |
| TOP | TOP Financial |   | Financials | 2.35 | 42 | 1.29 | -36.83% |
| EBR | Centrais Eletricas | | Utilities | 7.34 | 25 | 1.24 | -14.85% |
| LX | LexinFintech | | Financials | 1.63 | 17 | 1.24 | -11.41% |
| NTES | NetEase | | Technology | 93.51 | 32 | 1.09 | 0.38% |
| VINP | Vi Partners | | Financials | 10.25 | 17 | 0.99 | -6.73% |
| IH | iHuman | | Consumer Staples | 1.73 | 25 | 0.99 | -43.21% |
| HOLI | Hollysys Automation | | Industrials | 24.55 | 31 | 0.99 | -6.83% |
| IBN | ICICI Bank | | Financials | 25.68 | 61 | 0.98 | 7.72% |
| YSG | Yatsen Holding | | Services & Goods | 3.62 | 76 | 0.98 | 394.12% |
| BBDO | Banco Bradesco | | Financials | 2.33 | 17 | 0.87 | -26.73% |
| VIV | Telefonica Brasil | | Technology | 9.35 | 25 | 0.86 | -14.53% |
| DRD | DRDGOLD | | Materials | 8.55 | 81 | 0.83 | 7.55% |
| HCM | Hutchison China | | Health Care | 16.49 | 31 | 0.79 | -8.95% |
| LVRO | Lavoro | | Materials | 5.88 | 42 | 0.60 | -33.78% |
| IMAB | I Mab | | Health Care | 1.81 | 63 | 0.56 | -4.74% |
| SOHU | Sohu.com | | Technology | 10.97 | 66 | 0.55 | 10.47% |
| FMX | Fomento Economico | | Consumer Staples | 119.69 | 25 | 0.52 | -8.18% |
| ABEV | Ambev S.A | | Consumer Staples | 2.29 | 32 | 0.44 | -18.21% |
| BBD | Banco Bradesco | | Financials | 2.64 | 10 | 0.38 | -24.57% |
| ASR | Grupo Aeroportuario | | Transports | 308.21 | 54 | 0.35 | 4.74% |
| XNET | Xunlei | | Technology | 1.48 | 20 | 0.34 | -8.64% |
| HKD | AMTD Digital | | Technology | 3.08 | 10 | 0.33 | -25.42% |
| ITUB | Itau Unibanco | | Financials | 6.05 | 25 | 0.33 | -12.95% |
| RDY | Dr. Reddy | | Health Care | 71.14 | 18 | 0.32 | 2.24% |
| BRFS | BRF S.A | | Consumer Staples | 3.28 | 45 | 0.31 | 17.99% |
| For chart view version of above stock list: Chart View ➞ 0 - 25 , 25 - 50 , 50 - 75 , 75 - 100 , 100 - 125 , 125 - 150 , 150 - 175 , 175 - 200 | ||
 | Click To Change The Sort Order: By Market Cap or Company Size Performance: Year-to-date, Week and Day |  |
|
Get the most comprehensive stock market coverage daily at 12Stocks.com ➞ Best Stocks Today ➞ Best Stocks Weekly ➞ Best Stocks Year-to-Date ➞ Best Stocks Trends ➞  Best Stocks Today 12Stocks.com Best Nasdaq Stocks ➞ Best S&P 500 Stocks ➞ Best Tech Stocks ➞ Best Biotech Stocks ➞ |
| Detailed Overview of Emerging Markets Stocks |
| Emerging Markets Technical Overview, Leaders & Laggards, Top Emerging Markets ETF Funds & Detailed Emerging Markets Stocks List, Charts, Trends & More |
| Emerging Markets: Technical Analysis, Trends & YTD Performance | |
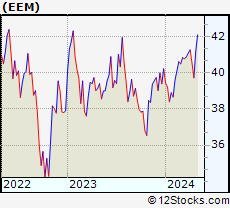
 EEM Weekly Chart |
|
| Long Term Trend: Good | |
| Medium Term Trend: Not Good | |
 EEM Daily Chart |
|
| Short Term Trend: Not Good | |
| Overall Trend Score: 49 | |
| YTD Performance: -1.24% | |
| **Trend Scores & Views Are Only For Educational Purposes And Not For Investing | |
| 12Stocks.com: Investing in Emerging Markets Index using Exchange Traded Funds | |
|
The following table shows list of key exchange traded funds (ETF) that
help investors play Emerging Markets stock market. For detailed view, check out our ETF Funds section of our website. Quick View: Move mouse or cursor over ETF symbol (ticker) to view short-term technical chart and over ETF name to view long term chart. Click on ticker or stock name for detailed view. Click on to add stock symbol to your watchlist and to view watchlist. |
12Stocks.com List of ETFs that track Emerging Markets Index
| Ticker | ETF Name | Watchlist | Recent Price | Smart Investing & Trading Score | Change % | Week % | Year-to-date % |
| EEM | Emerging Markets | | 39.71 | 49 | -0.40 | -2.02 | -1.24% |
| VWO | Emerging Markets | | 40.89 | 49 | -0.29 | -1.71 | -0.51% |
| SCHE | Emerging Markets Equity | | 24.69 | 41 | -0.36 | -1.75 | -0.4% |
| EWX | Emerging Markets Small | | 55.17 | 41 | -0.79 | -1.59 | -2.28% |
| EET | Emerging Markets | | 47.72 | 49 | -0.65 | -4.18 | -6.18% |
| EDC | Emrg Mkts Bull | | 27.07 | 49 | -1.42 | -6.27 | -11.04% |
| EEV | Short Emerging | | 20.52 | 62 | 0.73 | 3.94 | 4.03% |
| EUM | Short Emerging | | 14.49 | 62 | 0.50 | 2.16 | 2.42% |
| EDIV | Emerging Markets Dividend | | 33.01 | 51 | 0.33 | 0.21 | 1.51% |
| EMIF | Emerging Markets Infrastructure | | 21.38 | 51 | 0.14 | -1.85 | -0.09% |
| CEW | Emerging Currency Strat | | 17.61 | 38 | 0.10 | -0.45 | -2.22% |
| EBND | Em Mkts Lcl | | 19.93 | 32 | 0.35 | -0.7 | -6.17% |
| EMCB | Emerging Markets Corp | | 63.59 | 0 | -0.41 | -0.79 | -0.49% |
| VWOB | Emerging Mkts Govt | | 62.33 | 32 | 0.27 | -0.53 | -2.23% |
| EEMA | Emerging Markets Asia | | 66.09 | 49 | -0.40 | -1.85 | -0.03% |
| EELV | Em Mkts Low | | 23.16 | 18 | -0.22 | -1.51 | -3.66% |
| DVYE | Emerging Markets Dividend | | 26.48 | 88 | 0.76 | 0.08 | -0.04% |
| SDEM | SuperDividend Em Mkts | | 25.86 | 83 | 0.58 | 0.61 | 4.29% |
| DBEM | Em Mkts Hdgd | | 23.10 | 49 | -0.52 | -1.79 | 0.13% |
| PCY | Emerging Markets Sov | | 19.81 | 32 | 0.25 | -1.05 | -3.93% |
| QEMM | Emerging Mkts StratcFacts | | 56.16 | 44 | -0.04 | -1.27 | -1.74% |
| 12Stocks.com: Charts, Trends, Fundamental Data and Performances of Emerging Markets Stocks | |
|
We now take in-depth look at all Emerging Markets stocks including charts, multi-period performances and overall trends (as measured by Smart Investing & Trading Score ). One can sort Emerging Markets stocks (click link to choose) by Daily, Weekly and by Year-to-Date performances. Also, one can sort by size of the company or by market capitalization. |
| Select Your Default Chart Type: | |||||
| |||||
| Click on stock symbol or name for detailed view. Click on to add stock symbol to your watchlist and to view watchlist. Quick View: Move mouse or cursor over "Daily" to quickly view daily technical stock chart and over "Weekly" to view weekly technical stock chart. | |||||

 | TOP TOP Financial Group Limited |
| Sector: Financials | |
| SubSector: Capital Markets | |
| MarketCap: 329 Millions | |
| Recent Price: 2.35 Smart Investing & Trading Score : 42 | |
| Day Percent Change: 1.29% Day Change: 0.03 | |
| Week Change: -8.91% Year-to-date Change: -36.8% | |
| TOP Links: Profile News Message Board | |
| Charts:- Daily , Weekly | |
| Add TOP to Watchlist: View: Get Complete TOP Trend Analysis ➞ | |
 | EBR Centrais Eletricas Brasileiras S.A. - Eletrobras |
| Sector: Utilities | |
| SubSector: Electric Utilities | |
| MarketCap: 5459.84 Millions | |
| Recent Price: 7.34 Smart Investing & Trading Score : 25 | |
| Day Percent Change: 1.24% Day Change: 0.09 | |
| Week Change: -4.05% Year-to-date Change: -14.9% | |
| EBR Links: Profile News Message Board | |
| Charts:- Daily , Weekly | |
| Add EBR to Watchlist: View: Get Complete EBR Trend Analysis ➞ | |
 | LX LexinFintech Holdings Ltd. |
| Sector: Financials | |
| SubSector: Credit Services | |
| MarketCap: 1674.18 Millions | |
| Recent Price: 1.63 Smart Investing & Trading Score : 17 | |
| Day Percent Change: 1.24% Day Change: 0.02 | |
| Week Change: -7.39% Year-to-date Change: -11.4% | |
| LX Links: Profile News Message Board | |
| Charts:- Daily , Weekly | |
| Add LX to Watchlist: View: Get Complete LX Trend Analysis ➞ | |
 | NTES NetEase, Inc. |
| Sector: Technology | |
| SubSector: Internet Software & Services | |
| MarketCap: 40105.1 Millions | |
| Recent Price: 93.51 Smart Investing & Trading Score : 32 | |
| Day Percent Change: 1.09% Day Change: 1.01 | |
| Week Change: 1.48% Year-to-date Change: 0.4% | |
| NTES Links: Profile News Message Board | |
| Charts:- Daily , Weekly | |
| Add NTES to Watchlist: View: Get Complete NTES Trend Analysis ➞ | |
 | VINP Vinci Partners Investments Ltd. |
| Sector: Financials | |
| SubSector: Asset Management | |
| MarketCap: 537 Millions | |
| Recent Price: 10.25 Smart Investing & Trading Score : 17 | |
| Day Percent Change: 0.99% Day Change: 0.10 | |
| Week Change: -5.09% Year-to-date Change: -6.7% | |
| VINP Links: Profile News Message Board | |
| Charts:- Daily , Weekly | |
| Add VINP to Watchlist: View: Get Complete VINP Trend Analysis ➞ | |
 | IH iHuman Inc. |
| Sector: Consumer Staples | |
| SubSector: Education & Training Services | |
| MarketCap: 12247 Millions | |
| Recent Price: 1.73 Smart Investing & Trading Score : 25 | |
| Day Percent Change: 0.99% Day Change: 0.02 | |
| Week Change: -2.7% Year-to-date Change: -43.2% | |
| IH Links: Profile News Message Board | |
| Charts:- Daily , Weekly | |
| Add IH to Watchlist: View: Get Complete IH Trend Analysis ➞ | |
 | HOLI Hollysys Automation Technologies Ltd. |
| Sector: Industrials | |
| SubSector: Industrial Electrical Equipment | |
| MarketCap: 668.379 Millions | |
| Recent Price: 24.55 Smart Investing & Trading Score : 31 | |
| Day Percent Change: 0.99% Day Change: 0.24 | |
| Week Change: -3.31% Year-to-date Change: -6.8% | |
| HOLI Links: Profile News Message Board | |
| Charts:- Daily , Weekly | |
| Add HOLI to Watchlist: View: Get Complete HOLI Trend Analysis ➞ | |
 | IBN ICICI Bank Limited |
| Sector: Financials | |
| SubSector: Money Center Banks | |
| MarketCap: 31194.1 Millions | |
| Recent Price: 25.68 Smart Investing & Trading Score : 61 | |
| Day Percent Change: 0.98% Day Change: 0.25 | |
| Week Change: -1.76% Year-to-date Change: 7.7% | |
| IBN Links: Profile News Message Board | |
| Charts:- Daily , Weekly | |
| Add IBN to Watchlist: View: Get Complete IBN Trend Analysis ➞ | |
 | YSG Yatsen Holding Limited |
| Sector: Services & Goods | |
| SubSector: Specialty Retail | |
| MarketCap: 11827 Millions | |
| Recent Price: 3.62 Smart Investing & Trading Score : 76 | |
| Day Percent Change: 0.98% Day Change: 0.04 | |
| Week Change: 20.1% Year-to-date Change: 394.1% | |
| YSG Links: Profile News Message Board | |
| Charts:- Daily , Weekly | |
| Add YSG to Watchlist: View: Get Complete YSG Trend Analysis ➞ | |
 | BBDO Banco Bradesco S.A. |
| Sector: Financials | |
| SubSector: Foreign Regional Banks | |
| MarketCap: 27711.4 Millions | |
| Recent Price: 2.33 Smart Investing & Trading Score : 17 | |
| Day Percent Change: 0.87% Day Change: 0.02 | |
| Week Change: -5.28% Year-to-date Change: -26.7% | |
| BBDO Links: Profile News Message Board | |
| Charts:- Daily , Weekly | |
| Add BBDO to Watchlist: View: Get Complete BBDO Trend Analysis ➞ | |
 | VIV Telefonica Brasil S.A. |
| Sector: Technology | |
| SubSector: Wireless Communications | |
| MarketCap: 19611.1 Millions | |
| Recent Price: 9.35 Smart Investing & Trading Score : 25 | |
| Day Percent Change: 0.86% Day Change: 0.08 | |
| Week Change: -2.2% Year-to-date Change: -14.5% | |
| VIV Links: Profile News Message Board | |
| Charts:- Daily , Weekly | |
| Add VIV to Watchlist: View: Get Complete VIV Trend Analysis ➞ | |
 | DRD DRDGOLD Limited |
| Sector: Materials | |
| SubSector: Gold | |
| MarketCap: 556.919 Millions | |
| Recent Price: 8.55 Smart Investing & Trading Score : 81 | |
| Day Percent Change: 0.83% Day Change: 0.07 | |
| Week Change: 1.18% Year-to-date Change: 7.6% | |
| DRD Links: Profile News Message Board | |
| Charts:- Daily , Weekly | |
| Add DRD to Watchlist: View: Get Complete DRD Trend Analysis ➞ | |
 | HCM Hutchison China MediTech Limited |
| Sector: Health Care | |
| SubSector: Drug Manufacturers - Major | |
| MarketCap: 2324.43 Millions | |
| Recent Price: 16.49 Smart Investing & Trading Score : 31 | |
| Day Percent Change: 0.79% Day Change: 0.13 | |
| Week Change: -7.77% Year-to-date Change: -9.0% | |
| HCM Links: Profile News Message Board | |
| Charts:- Daily , Weekly | |
| Add HCM to Watchlist: View: Get Complete HCM Trend Analysis ➞ | |
 | LVRO Lavoro Limited |
| Sector: Materials | |
| SubSector: Agricultural Inputs | |
| MarketCap: 686 Millions | |
| Recent Price: 5.88 Smart Investing & Trading Score : 42 | |
| Day Percent Change: 0.60% Day Change: 0.04 | |
| Week Change: -3.45% Year-to-date Change: -33.8% | |
| LVRO Links: Profile News Message Board | |
| Charts:- Daily , Weekly | |
| Add LVRO to Watchlist: View: Get Complete LVRO Trend Analysis ➞ | |
 | IMAB I Mab |
| Sector: Health Care | |
| SubSector: Biotechnology | |
| MarketCap: 26187 Millions | |
| Recent Price: 1.81 Smart Investing & Trading Score : 63 | |
| Day Percent Change: 0.56% Day Change: 0.01 | |
| Week Change: 0% Year-to-date Change: -4.7% | |
| IMAB Links: Profile News Message Board | |
| Charts:- Daily , Weekly | |
| Add IMAB to Watchlist: View: Get Complete IMAB Trend Analysis ➞ | |
 | SOHU Sohu.com Limited |
| Sector: Technology | |
| SubSector: Internet Information Providers | |
| MarketCap: 243.48 Millions | |
| Recent Price: 10.97 Smart Investing & Trading Score : 66 | |
| Day Percent Change: 0.55% Day Change: 0.06 | |
| Week Change: -4.02% Year-to-date Change: 10.5% | |
| SOHU Links: Profile News Message Board | |
| Charts:- Daily , Weekly | |
| Add SOHU to Watchlist: View: Get Complete SOHU Trend Analysis ➞ | |
 | FMX Fomento Economico Mexicano, S.A.B. de C.V. |
| Sector: Consumer Staples | |
| SubSector: Beverages - Brewers | |
| MarketCap: 22018.7 Millions | |
| Recent Price: 119.69 Smart Investing & Trading Score : 25 | |
| Day Percent Change: 0.52% Day Change: 0.62 | |
| Week Change: -3.66% Year-to-date Change: -8.2% | |
| FMX Links: Profile News Message Board | |
| Charts:- Daily , Weekly | |
| Add FMX to Watchlist: View: Get Complete FMX Trend Analysis ➞ | |
 | ABEV Ambev S.A. |
| Sector: Consumer Staples | |
| SubSector: Beverages - Brewers | |
| MarketCap: 37753.5 Millions | |
| Recent Price: 2.29 Smart Investing & Trading Score : 32 | |
| Day Percent Change: 0.44% Day Change: 0.01 | |
| Week Change: -2.55% Year-to-date Change: -18.2% | |
| ABEV Links: Profile News Message Board | |
| Charts:- Daily , Weekly | |
| Add ABEV to Watchlist: View: Get Complete ABEV Trend Analysis ➞ | |
 | BBD Banco Bradesco S.A. |
| Sector: Financials | |
| SubSector: Foreign Regional Banks | |
| MarketCap: 30281.7 Millions | |
| Recent Price: 2.64 Smart Investing & Trading Score : 10 | |
| Day Percent Change: 0.38% Day Change: 0.01 | |
| Week Change: -4.69% Year-to-date Change: -24.6% | |
| BBD Links: Profile News Message Board | |
| Charts:- Daily , Weekly | |
| Add BBD to Watchlist: View: Get Complete BBD Trend Analysis ➞ | |
 | ASR Grupo Aeroportuario del Sureste, S. A. B. de C. V. |
| Sector: Transports | |
| SubSector: Air Services, Other | |
| MarketCap: 2739.98 Millions | |
| Recent Price: 308.21 Smart Investing & Trading Score : 54 | |
| Day Percent Change: 0.35% Day Change: 1.07 | |
| Week Change: -2.78% Year-to-date Change: 4.7% | |
| ASR Links: Profile News Message Board | |
| Charts:- Daily , Weekly | |
| Add ASR to Watchlist: View: Get Complete ASR Trend Analysis ➞ | |
 | XNET Xunlei Limited |
| Sector: Technology | |
| SubSector: Application Software | |
| MarketCap: 203.662 Millions | |
| Recent Price: 1.48 Smart Investing & Trading Score : 20 | |
| Day Percent Change: 0.34% Day Change: 0.00 | |
| Week Change: -1% Year-to-date Change: -8.6% | |
| XNET Links: Profile News Message Board | |
| Charts:- Daily , Weekly | |
| Add XNET to Watchlist: View: Get Complete XNET Trend Analysis ➞ | |
 | HKD AMTD Digital Inc. |
| Sector: Technology | |
| SubSector: Software - Application | |
| MarketCap: 1200 Millions | |
| Recent Price: 3.08 Smart Investing & Trading Score : 10 | |
| Day Percent Change: 0.33% Day Change: 0.01 | |
| Week Change: -8.33% Year-to-date Change: -25.4% | |
| HKD Links: Profile News Message Board | |
| Charts:- Daily , Weekly | |
| Add HKD to Watchlist: View: Get Complete HKD Trend Analysis ➞ | |
 | ITUB Itau Unibanco Holding S.A. |
| Sector: Financials | |
| SubSector: Foreign Regional Banks | |
| MarketCap: 48121 Millions | |
| Recent Price: 6.05 Smart Investing & Trading Score : 25 | |
| Day Percent Change: 0.33% Day Change: 0.02 | |
| Week Change: -4.72% Year-to-date Change: -13.0% | |
| ITUB Links: Profile News Message Board | |
| Charts:- Daily , Weekly | |
| Add ITUB to Watchlist: View: Get Complete ITUB Trend Analysis ➞ | |
 | RDY Dr. Reddy s Laboratories Limited |
| Sector: Health Care | |
| SubSector: Drug Manufacturers - Other | |
| MarketCap: 6590.23 Millions | |
| Recent Price: 71.14 Smart Investing & Trading Score : 18 | |
| Day Percent Change: 0.32% Day Change: 0.23 | |
| Week Change: -0.39% Year-to-date Change: 2.2% | |
| RDY Links: Profile News Message Board | |
| Charts:- Daily , Weekly | |
| Add RDY to Watchlist: View: Get Complete RDY Trend Analysis ➞ | |
 | BRFS BRF S.A. |
| Sector: Consumer Staples | |
| SubSector: Meat Products | |
| MarketCap: 2635.51 Millions | |
| Recent Price: 3.28 Smart Investing & Trading Score : 45 | |
| Day Percent Change: 0.31% Day Change: 0.01 | |
| Week Change: 2.82% Year-to-date Change: 18.0% | |
| BRFS Links: Profile News Message Board | |
| Charts:- Daily , Weekly | |
| Add BRFS to Watchlist: View: Get Complete BRFS Trend Analysis ➞ | |
| For tabular summary view of above stock list: Summary View ➞ 0 - 25 , 25 - 50 , 50 - 75 , 75 - 100 , 100 - 125 , 125 - 150 , 150 - 175 , 175 - 200 | ||
| Click To Change The Sort Order: By Market Cap or Company Size Performance: Year-to-date, Week and Day | |
| Select Chart Type: | ||
|
Best Stocks Today 12Stocks.com |
© 2024 12Stocks.com Terms & Conditions Privacy Contact Us
All Information Provided Only For Education And Not To Be Used For Investing or Trading. See Terms & Conditions


One More Thing ... Get Best Stocks Delivered Daily!
Never Ever Miss A Move With Our Top Ten Stocks Lists
Find Best Stocks In Any Market - Bull or Bear Market
Take A Peek At Our Top Ten Stocks Lists: Daily, Weekly, Year-to-Date & Top Trends
Find Best Stocks In Any Market - Bull or Bear Market
Take A Peek At Our Top Ten Stocks Lists: Daily, Weekly, Year-to-Date & Top Trends
Emerging Markets Stocks With Best Up Trends [0-bearish to 100-bullish]: HDFC Bank[93], Full Truck[93], DouYu [90], Harmony Gold[88], GDS [88], Bright Scholar[85], Gold Fields[85], MOGU [83], Lufax Holding[83], So-Young [83], DRDGOLD [81]
Best Emerging Markets Stocks Year-to-Date:
U Power[2768.3%], DouYu [747.37%], MicroCloud Hologram[702.88%], China Liberal[476.51%], Zhongchao [412.19%], Yatsen Holding[394.12%], Uxin [141.08%], QuantaSing [106.79%], GigaCloud [89.46%], Bright Scholar[60.8%], Cheetah Mobile[55.26%] Best Emerging Markets Stocks This Week:
Regencell Bioscience[45.67%], Yatsen Holding[20.1%], MingZhu Logistics[17.48%], Secoo Holding[17.14%], Zhongchao [14.02%], TH [11.82%], Controladora Vuela[10.64%], Bright Scholar[9.24%], Quhuo [8.87%], Smart Share[7.58%], DouYu [6.62%] Best Emerging Markets Stocks Daily:
Lanvin [11.19%], MingZhu Logistics[10.31%], Bright Scholar[6.91%], Regencell Bioscience[6.32%], Ambipar Emergency[6.09%], MOGU [5.85%], Petroleo Brasileiro[5.71%], Cheetah Mobile[5.04%], Secoo Holding[4.75%], BrasilAgro -[4.38%], Companhia Siderurgica[3.68%]