
 Login Sign Up


| |||||
 |  | ||||

| 12Stocks.com Market Intelligence |
Best Consumer Staples Stocks
| In a hurry? Consumer Staples Stocks: Performance Trends Table, Stock Charts
Sort Consumer Staples : Daily, Weekly, Year-to-Date, Market Cap & Trends. Filter Consumer Staples stocks list by size: All Large Mid-Range Small |
| 12Stocks.com Consumer Staples Stocks Performances & Trends Daily | |||||||||
|
|  The overall Smart Investing & Trading Score is 68 (0-bearish to 100-bullish) which puts Consumer Staples sector in short term neutral to bullish trend. The Smart Investing & Trading Score from previous trading session is 30 and an improvement of trend continues.
| ||||||||
Here are the Smart Investing & Trading Scores of the most requested Consumer Staples stocks at 12Stocks.com (click stock name for detailed review):
|


| 12Stocks.com: Investing in Consumer Staples sector with Stocks | |
|
The following table helps investors and traders sort through current performance and trends (as measured by Smart Investing & Trading Score) of various
stocks in the Consumer Staples sector. Quick View: Move mouse or cursor over stock symbol (ticker) to view short-term Technical chart and over stock name to view long term chart. Click on  to add stock symbol to your watchlist and to add stock symbol to your watchlist and  to view watchlist. Click on any ticker or stock name for detailed market intelligence report for that stock. to view watchlist. Click on any ticker or stock name for detailed market intelligence report for that stock. |
12Stocks.com Performance of Stocks in Consumer Staples Sector
| Ticker | Stock Name | Watchlist | Category | Recent Price | Smart Investing & Trading Score | Change % | YTD Change% |
| UNF | UniFirst |   | Textile - Apparel Clothing | 158.51 | 32 | 1.67 | -13.34% |
| FDP | Fresh Del | | Farm | 25.78 | 86 | 1.66 | -1.79% |
| HELE | Helen of Troy | | Housewares & Accessories | 100.00 | 32 | 1.64 | -17.23% |
| SPB | Spectrum Brands | | Household | 80.37 | 58 | 1.61 | 0.75% |
| GOOS | Canada Goose | | Textile - Apparel Clothing | 11.42 | 49 | 1.60 | -3.63% |
| JOUT | Johnson Outdoors | | Sporting Goods | 43.46 | 47 | 1.59 | -18.64% |
| ENR | Energizer | | Household | 28.41 | 42 | 1.57 | -10.32% |
| JBSS | John B. | | Processed | 98.17 | 32 | 1.57 | -4.73% |
| OXM | Oxford Industries | | Textile - Apparel Clothing | 104.72 | 68 | 1.55 | 4.72% |
| CCEP | Coca-Cola European | | Beverages | 67.61 | 32 | 1.52 | 1.30% |
| THO | Thor Industries | | Recreational Vehicles | 99.38 | 25 | 1.51 | -15.96% |
| K | Kellogg | | Processed | 57.38 | 86 | 1.49 | 2.63% |
| SHOO | Steven Madden | | Textile - Apparel Footwear & Accessories | 39.12 | 18 | 1.48 | -6.86% |
| CALM | Cal-Maine Foods | | Food | 60.09 | 61 | 1.47 | 4.70% |
| GT | Goodyear Tire | | Rubber & Plastics | 11.88 | 10 | 1.45 | -17.04% |
| SYY | Sysco | | Food Wholesale | 76.73 | 32 | 1.44 | 4.92% |
| HOFT | Hooker Furniture | | Home Furnishings & Fixtures | 18.32 | 32 | 1.44 | -29.75% |
| YQ | 17 Education | | Education & Training | 2.46 | 58 | 1.44 | 20.83% |
| AXL | American Axle | | Auto Parts | 7.08 | 45 | 1.43 | -19.64% |
| ADM | Archer-Daniels-Midland | | Farm | 62.60 | 86 | 1.43 | -13.32% |
| BUD | Anheuser-Busch InBev | | Beverages | 58.74 | 42 | 1.43 | -9.10% |
| LULU | Lululemon Athletica | | Textile - Apparel Clothing | 352.47 | 42 | 1.43 | -31.06% |
| BGS | B&G Foods | | Processed | 10.73 | 68 | 1.42 | 2.19% |
| MYE | Myers Industries | | Rubber & Plastics | 21.57 | 61 | 1.41 | 10.33% |
| EPC | Edgewell Personal | | Household | 36.65 | 42 | 1.41 | 0.05% |
| For chart view version of above stock list: Chart View ➞ 0 - 25 , 25 - 50 , 50 - 75 , 75 - 100 , 100 - 125 , 125 - 150 , 150 - 175 , 175 - 200 , 200 - 225 , 225 - 250 , 250 - 275 , 275 - 300 | ||
 | Click To Change The Sort Order: By Market Cap or Company Size Performance: Year-to-date, Week and Day |  |
|
Get the most comprehensive stock market coverage daily at 12Stocks.com ➞ Best Stocks Today ➞ Best Stocks Weekly ➞ Best Stocks Year-to-Date ➞ Best Stocks Trends ➞  Best Stocks Today 12Stocks.com Best Nasdaq Stocks ➞ Best S&P 500 Stocks ➞ Best Tech Stocks ➞ Best Biotech Stocks ➞ |
| Detailed Overview of Consumer Staples Stocks |
| Consumer Staples Technical Overview, Leaders & Laggards, Top Consumer Staples ETF Funds & Detailed Consumer Staples Stocks List, Charts, Trends & More |
| Consumer Staples Sector: Technical Analysis, Trends & YTD Performance | |
| Consumer Staples sector is composed of stocks
from household consumer products, food, farm, cosmetics, tobacco,
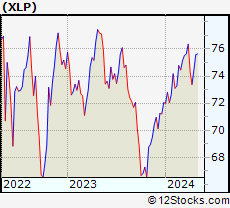
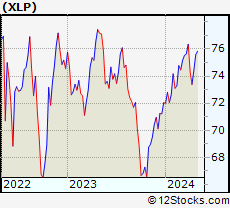
and beverages subsectors. Consumer Staples sector, as represented by XLP, an exchange-traded fund [ETF] that holds basket of Consumer Staples stocks (e.g, Proctor & Gamble, Pepsi) is up by 3.35% and is currently underperforming the overall market by -0.03% year-to-date. Below is a quick view of Technical charts and trends: |
|
 XLP Weekly Chart |
|
| Long Term Trend: Very Good | |
| Medium Term Trend: Not Good | |
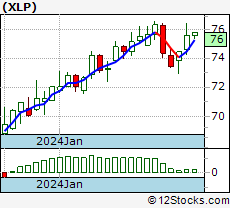
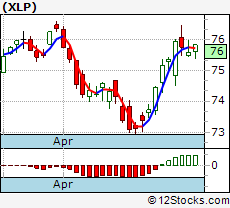 XLP Daily Chart |
|
| Short Term Trend: Very Good | |
| Overall Trend Score: 68 | |
| YTD Performance: 3.35% | |
| **Trend Scores & Views Are Only For Educational Purposes And Not For Investing | |
| 12Stocks.com: Top Performing Consumer Staples Sector Stocks | ||||||||||||||||||||||||||||||||||||||||||||||||
 The top performing Consumer Staples sector stocks year to date are
Now, more recently, over last week, the top performing Consumer Staples sector stocks on the move are


|
||||||||||||||||||||||||||||||||||||||||||||||||
| 12Stocks.com: Investing in Consumer Staples Sector using Exchange Traded Funds | |
|
The following table shows list of key exchange traded funds (ETF) that
help investors track Consumer Staples Index. For detailed view, check out our ETF Funds section of our website. Quick View: Move mouse or cursor over ETF symbol (ticker) to view short-term Technical chart and over ETF name to view long term chart. Click on ticker or stock name for detailed view. Click on to add stock symbol to your watchlist and to view watchlist. |
12Stocks.com List of ETFs that track Consumer Staples Index
| Ticker | ETF Name | Watchlist | Recent Price | Smart Investing & Trading Score | Change % | Week % | Year-to-date % |
| XLP | Consumer Staples | | 74.44 | 68 | 0.98 | 1.44 | 3.35% |
| VDC | Consumer Staples | | 198.19 | 68 | 0.98 | 1.36 | 3.79% |
| KXI | Global Consumer Staples | | 59.26 | 55 | 1.04 | 1.72 | -0.05% |
| PSL | DWA Consumer Staples | | 91.83 | 44 | -0.09 | -0.93 | 0.36% |
| FSTA | Consumer Staples | | 46.24 | 68 | 1.02 | 1.36 | 3.61% |
| 12Stocks.com: Charts, Trends, Fundamental Data and Performances of Consumer Staples Stocks | |
|
We now take in-depth look at all Consumer Staples stocks including charts, multi-period performances and overall trends (as measured by Smart Investing & Trading Score). One can sort Consumer Staples stocks (click link to choose) by Daily, Weekly and by Year-to-Date performances. Also, one can sort by size of the company or by market capitalization. |
| Select Your Default Chart Type: | |||||
| |||||
| Click on stock symbol or name for detailed view. Click on to add stock symbol to your watchlist and to view watchlist. Quick View: Move mouse or cursor over "Daily" to quickly view daily Technical stock chart and over "Weekly" to view weekly Technical stock chart. | |||||
 | UNF UniFirst Corporation |
| Sector: Consumer Staples | |
| SubSector: Textile - Apparel Clothing | |
| MarketCap: 2605.65 Millions | |
| Recent Price: 158.51 Smart Investing & Trading Score: 32 | |
| Day Percent Change: 1.67% Day Change: 2.60 | |
| Week Change: -1.78% Year-to-date Change: -13.3% | |
| UNF Links: Profile News Message Board | |
| Charts:- Daily , Weekly | |
| Add UNF to Watchlist: View: Get Complete UNF Trend Analysis ➞ | |
 | FDP Fresh Del Monte Produce Inc. |
| Sector: Consumer Staples | |
| SubSector: Farm Products | |
| MarketCap: 1862.37 Millions | |
| Recent Price: 25.78 Smart Investing & Trading Score: 86 | |
| Day Percent Change: 1.66% Day Change: 0.42 | |
| Week Change: 3.41% Year-to-date Change: -1.8% | |
| FDP Links: Profile News Message Board | |
| Charts:- Daily , Weekly | |
| Add FDP to Watchlist: View: Get Complete FDP Trend Analysis ➞ | |
 | HELE Helen of Troy Limited |
| Sector: Consumer Staples | |
| SubSector: Housewares & Accessories | |
| MarketCap: 3199.53 Millions | |
| Recent Price: 100.00 Smart Investing & Trading Score: 32 | |
| Day Percent Change: 1.64% Day Change: 1.61 | |
| Week Change: 0.15% Year-to-date Change: -17.2% | |
| HELE Links: Profile News Message Board | |
| Charts:- Daily , Weekly | |
| Add HELE to Watchlist: View: Get Complete HELE Trend Analysis ➞ | |
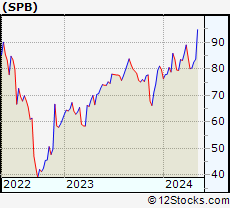 | SPB Spectrum Brands Holdings, Inc. |
| Sector: Consumer Staples | |
| SubSector: Personal Products | |
| MarketCap: 1460.85 Millions | |
| Recent Price: 80.37 Smart Investing & Trading Score: 58 | |
| Day Percent Change: 1.61% Day Change: 1.27 | |
| Week Change: 0.37% Year-to-date Change: 0.8% | |
| SPB Links: Profile News Message Board | |
| Charts:- Daily , Weekly | |
| Add SPB to Watchlist: View: Get Complete SPB Trend Analysis ➞ | |
 | GOOS Canada Goose Holdings Inc. |
| Sector: Consumer Staples | |
| SubSector: Textile - Apparel Clothing | |
| MarketCap: 881.465 Millions | |
| Recent Price: 11.42 Smart Investing & Trading Score: 49 | |
| Day Percent Change: 1.60% Day Change: 0.18 | |
| Week Change: 5.84% Year-to-date Change: -3.6% | |
| GOOS Links: Profile News Message Board | |
| Charts:- Daily , Weekly | |
| Add GOOS to Watchlist: View: Get Complete GOOS Trend Analysis ➞ | |
 | JOUT Johnson Outdoors Inc. |
| Sector: Consumer Staples | |
| SubSector: Sporting Goods | |
| MarketCap: 572.844 Millions | |
| Recent Price: 43.46 Smart Investing & Trading Score: 47 | |
| Day Percent Change: 1.59% Day Change: 0.68 | |
| Week Change: 1.23% Year-to-date Change: -18.6% | |
| JOUT Links: Profile News Message Board | |
| Charts:- Daily , Weekly | |
| Add JOUT to Watchlist: View: Get Complete JOUT Trend Analysis ➞ | |
 | ENR Energizer Holdings, Inc. |
| Sector: Consumer Staples | |
| SubSector: Personal Products | |
| MarketCap: 2469.55 Millions | |
| Recent Price: 28.41 Smart Investing & Trading Score: 42 | |
| Day Percent Change: 1.57% Day Change: 0.44 | |
| Week Change: 3.53% Year-to-date Change: -10.3% | |
| ENR Links: Profile News Message Board | |
| Charts:- Daily , Weekly | |
| Add ENR to Watchlist: View: Get Complete ENR Trend Analysis ➞ | |
 | JBSS John B. Sanfilippo & Son, Inc. |
| Sector: Consumer Staples | |
| SubSector: Processed & Packaged Goods | |
| MarketCap: 899.748 Millions | |
| Recent Price: 98.17 Smart Investing & Trading Score: 32 | |
| Day Percent Change: 1.57% Day Change: 1.52 | |
| Week Change: 0.84% Year-to-date Change: -4.7% | |
| JBSS Links: Profile News Message Board | |
| Charts:- Daily , Weekly | |
| Add JBSS to Watchlist: View: Get Complete JBSS Trend Analysis ➞ | |
 | OXM Oxford Industries, Inc. |
| Sector: Consumer Staples | |
| SubSector: Textile - Apparel Clothing | |
| MarketCap: 647.665 Millions | |
| Recent Price: 104.72 Smart Investing & Trading Score: 68 | |
| Day Percent Change: 1.55% Day Change: 1.60 | |
| Week Change: -0.31% Year-to-date Change: 4.7% | |
| OXM Links: Profile News Message Board | |
| Charts:- Daily , Weekly | |
| Add OXM to Watchlist: View: Get Complete OXM Trend Analysis ➞ | |
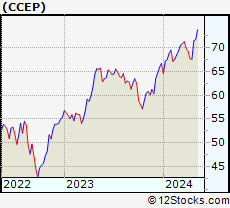 | CCEP Coca-Cola European Partners plc |
| Sector: Consumer Staples | |
| SubSector: Beverages - Soft Drinks | |
| MarketCap: 16714 Millions | |
| Recent Price: 67.61 Smart Investing & Trading Score: 32 | |
| Day Percent Change: 1.52% Day Change: 1.01 | |
| Week Change: -0.19% Year-to-date Change: 1.3% | |
| CCEP Links: Profile News Message Board | |
| Charts:- Daily , Weekly | |
| Add CCEP to Watchlist: View: Get Complete CCEP Trend Analysis ➞ | |
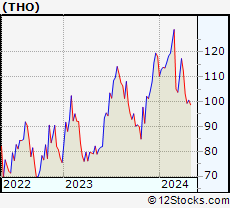 | THO Thor Industries, Inc. |
| Sector: Consumer Staples | |
| SubSector: Recreational Vehicles | |
| MarketCap: 2279.29 Millions | |
| Recent Price: 99.38 Smart Investing & Trading Score: 25 | |
| Day Percent Change: 1.51% Day Change: 1.48 | |
| Week Change: -3.65% Year-to-date Change: -16.0% | |
| THO Links: Profile News Message Board | |
| Charts:- Daily , Weekly | |
| Add THO to Watchlist: View: Get Complete THO Trend Analysis ➞ | |
 | K Kellogg Company |
| Sector: Consumer Staples | |
| SubSector: Processed & Packaged Goods | |
| MarketCap: 20264.6 Millions | |
| Recent Price: 57.38 Smart Investing & Trading Score: 86 | |
| Day Percent Change: 1.49% Day Change: 0.84 | |
| Week Change: 3.54% Year-to-date Change: 2.6% | |
| K Links: Profile News Message Board | |
| Charts:- Daily , Weekly | |
| Add K to Watchlist: View: Get Complete K Trend Analysis ➞ | |
 | SHOO Steven Madden, Ltd. |
| Sector: Consumer Staples | |
| SubSector: Textile - Apparel Footwear & Accessories | |
| MarketCap: 1756.3 Millions | |
| Recent Price: 39.12 Smart Investing & Trading Score: 18 | |
| Day Percent Change: 1.48% Day Change: 0.57 | |
| Week Change: 0.08% Year-to-date Change: -6.9% | |
| SHOO Links: Profile News Message Board | |
| Charts:- Daily , Weekly | |
| Add SHOO to Watchlist: View: Get Complete SHOO Trend Analysis ➞ | |
 | CALM Cal-Maine Foods, Inc. |
| Sector: Consumer Staples | |
| SubSector: Food - Major Diversified | |
| MarketCap: 2177.13 Millions | |
| Recent Price: 60.09 Smart Investing & Trading Score: 61 | |
| Day Percent Change: 1.47% Day Change: 0.87 | |
| Week Change: -0.61% Year-to-date Change: 4.7% | |
| CALM Links: Profile News Message Board | |
| Charts:- Daily , Weekly | |
| Add CALM to Watchlist: View: Get Complete CALM Trend Analysis ➞ | |
 | GT The Goodyear Tire & Rubber Company |
| Sector: Consumer Staples | |
| SubSector: Rubber & Plastics | |
| MarketCap: 1483.7 Millions | |
| Recent Price: 11.88 Smart Investing & Trading Score: 10 | |
| Day Percent Change: 1.45% Day Change: 0.17 | |
| Week Change: -3.18% Year-to-date Change: -17.0% | |
| GT Links: Profile News Message Board | |
| Charts:- Daily , Weekly | |
| Add GT to Watchlist: View: Get Complete GT Trend Analysis ➞ | |
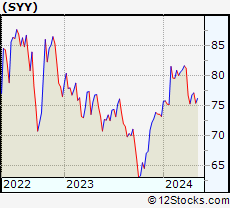 | SYY Sysco Corporation |
| Sector: Consumer Staples | |
| SubSector: Food Wholesale | |
| MarketCap: 22771.9 Millions | |
| Recent Price: 76.73 Smart Investing & Trading Score: 32 | |
| Day Percent Change: 1.44% Day Change: 1.09 | |
| Week Change: 1.97% Year-to-date Change: 4.9% | |
| SYY Links: Profile News Message Board | |
| Charts:- Daily , Weekly | |
| Add SYY to Watchlist: View: Get Complete SYY Trend Analysis ➞ | |
 | HOFT Hooker Furniture Corporation |
| Sector: Consumer Staples | |
| SubSector: Home Furnishings & Fixtures | |
| MarketCap: 173.235 Millions | |
| Recent Price: 18.32 Smart Investing & Trading Score: 32 | |
| Day Percent Change: 1.44% Day Change: 0.26 | |
| Week Change: -0.43% Year-to-date Change: -29.8% | |
| HOFT Links: Profile News Message Board | |
| Charts:- Daily , Weekly | |
| Add HOFT to Watchlist: View: Get Complete HOFT Trend Analysis ➞ | |
 | YQ 17 Education & Technology Group Inc. |
| Sector: Consumer Staples | |
| SubSector: Education & Training Services | |
| MarketCap: 32347 Millions | |
| Recent Price: 2.46 Smart Investing & Trading Score: 58 | |
| Day Percent Change: 1.44% Day Change: 0.03 | |
| Week Change: -5.19% Year-to-date Change: 20.8% | |
| YQ Links: Profile News Message Board | |
| Charts:- Daily , Weekly | |
| Add YQ to Watchlist: View: Get Complete YQ Trend Analysis ➞ | |
 | AXL American Axle & Manufacturing Holdings, Inc. |
| Sector: Consumer Staples | |
| SubSector: Auto Parts | |
| MarketCap: 407.139 Millions | |
| Recent Price: 7.08 Smart Investing & Trading Score: 45 | |
| Day Percent Change: 1.43% Day Change: 0.10 | |
| Week Change: 0.14% Year-to-date Change: -19.6% | |
| AXL Links: Profile News Message Board | |
| Charts:- Daily , Weekly | |
| Add AXL to Watchlist: View: Get Complete AXL Trend Analysis ➞ | |
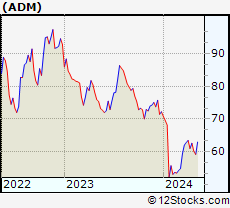 | ADM Archer-Daniels-Midland Company |
| Sector: Consumer Staples | |
| SubSector: Farm Products | |
| MarketCap: 18988.7 Millions | |
| Recent Price: 62.60 Smart Investing & Trading Score: 86 | |
| Day Percent Change: 1.43% Day Change: 0.88 | |
| Week Change: 2.67% Year-to-date Change: -13.3% | |
| ADM Links: Profile News Message Board | |
| Charts:- Daily , Weekly | |
| Add ADM to Watchlist: View: Get Complete ADM Trend Analysis ➞ | |
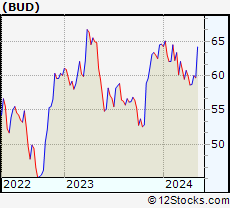 | BUD Anheuser-Busch InBev SA/NV |
| Sector: Consumer Staples | |
| SubSector: Beverages - Brewers | |
| MarketCap: 77446.6 Millions | |
| Recent Price: 58.74 Smart Investing & Trading Score: 42 | |
| Day Percent Change: 1.43% Day Change: 0.83 | |
| Week Change: 0.12% Year-to-date Change: -9.1% | |
| BUD Links: Profile News Message Board | |
| Charts:- Daily , Weekly | |
| Add BUD to Watchlist: View: Get Complete BUD Trend Analysis ➞ | |
 | LULU Lululemon Athletica Inc. |
| Sector: Consumer Staples | |
| SubSector: Textile - Apparel Clothing | |
| MarketCap: 24627.8 Millions | |
| Recent Price: 352.47 Smart Investing & Trading Score: 42 | |
| Day Percent Change: 1.43% Day Change: 4.96 | |
| Week Change: 4.86% Year-to-date Change: -31.1% | |
| LULU Links: Profile News Message Board | |
| Charts:- Daily , Weekly | |
| Add LULU to Watchlist: View: Get Complete LULU Trend Analysis ➞ | |
 | BGS B&G Foods, Inc. |
| Sector: Consumer Staples | |
| SubSector: Processed & Packaged Goods | |
| MarketCap: 1456.08 Millions | |
| Recent Price: 10.73 Smart Investing & Trading Score: 68 | |
| Day Percent Change: 1.42% Day Change: 0.15 | |
| Week Change: 0.66% Year-to-date Change: 2.2% | |
| BGS Links: Profile News Message Board | |
| Charts:- Daily , Weekly | |
| Add BGS to Watchlist: View: Get Complete BGS Trend Analysis ➞ | |
 | MYE Myers Industries, Inc. |
| Sector: Consumer Staples | |
| SubSector: Rubber & Plastics | |
| MarketCap: 347.57 Millions | |
| Recent Price: 21.57 Smart Investing & Trading Score: 61 | |
| Day Percent Change: 1.41% Day Change: 0.30 | |
| Week Change: -0.78% Year-to-date Change: 10.3% | |
| MYE Links: Profile News Message Board | |
| Charts:- Daily , Weekly | |
| Add MYE to Watchlist: View: Get Complete MYE Trend Analysis ➞ | |
 | EPC Edgewell Personal Care Company |
| Sector: Consumer Staples | |
| SubSector: Personal Products | |
| MarketCap: 1605.95 Millions | |
| Recent Price: 36.65 Smart Investing & Trading Score: 42 | |
| Day Percent Change: 1.41% Day Change: 0.51 | |
| Week Change: 2.4% Year-to-date Change: 0.1% | |
| EPC Links: Profile News Message Board | |
| Charts:- Daily , Weekly | |
| Add EPC to Watchlist: View: Get Complete EPC Trend Analysis ➞ | |
| For tabular summary view of above stock list: Summary View ➞ 0 - 25 , 25 - 50 , 50 - 75 , 75 - 100 , 100 - 125 , 125 - 150 , 150 - 175 , 175 - 200 , 200 - 225 , 225 - 250 , 250 - 275 , 275 - 300 | ||
| Click To Change The Sort Order: By Market Cap or Company Size Performance: Year-to-date, Week and Day | |
| Select Chart Type: | ||
|
Best Stocks Today 12Stocks.com |
© 2024 12Stocks.com Terms & Conditions Privacy Contact Us
All Information Provided Only For Education And Not To Be Used For Investing or Trading. See Terms & Conditions


One More Thing ... Get Best Stocks Delivered Daily!
Never Ever Miss A Move With Our Top Ten Stocks Lists
Find Best Stocks In Any Market - Bull or Bear Market
Take A Peek At Our Top Ten Stocks Lists: Daily, Weekly, Year-to-Date & Top Trends
Find Best Stocks In Any Market - Bull or Bear Market
Take A Peek At Our Top Ten Stocks Lists: Daily, Weekly, Year-to-Date & Top Trends
Consumer Staples Stocks With Best Up Trends [0-bearish to 100-bullish]: Calavo Growers[100], Andersons [100], Dole [100], Bunge [100], Philip Morris[100], Flowers Foods[100], Tyson Foods[100], Seneca Foods[100], Kraft Heinz[100], Conagra Brands[100], Primo Water[95]
Best Consumer Staples Stocks Year-to-Date:
China Liberal[476.51%], Laird Superfood[147.23%], QuantaSing [106.79%], Flexsteel Industries[98.89%], Village Farms[76.08%], Vital Farms[60.13%], Purple Innovation[42.72%], Lifetime Brands[41.43%], Modine [40.18%], Allison Transmission[34.81%], Pilgrim s[29.32%] Best Consumer Staples Stocks This Week:
Kandi Technologies[22.01%], Calavo Growers[16.24%], Herbalife Nutrition[9.14%], Flowers Foods[8.66%], LifeVantage [8.24%], Nu Skin[7.97%], Wolverine World[7.24%], Levi Strauss[6.86%], Lovesac [6.61%], General Mills[6.37%], China Liberal[6.27%] Best Consumer Staples Stocks Daily:
Fossil [9.03%], Village Farms[8.94%], Calavo Growers[6.09%], Workhorse [5.84%], P. H.[5.44%], Sportsman s[4.58%], Cresud Sociedad[4.44%], European Wax[4.28%], Alico [4.24%], Laird Superfood[4.17%], Marine Products[4.14%]