
 Login Sign Up


| |||||
 |  | ||||

| 12Stocks.com Market Intelligence |
Best China Stocks
|
On this page, you will find the most comprehensive analysis of Chinese stocks and ETFs - from latest trends to performances to charts ➞. First, here are the year-to-date (YTD) performances of the most requested China stocks at 12Stocks.com (click stock for review):
| New Oriental 16% | ||
| Sohu.com 10% | ||
| NetEase 0% | ||
| Alibaba -11% | ||
| JD.com -12% | ||
| Vipshop -15% | ||
| JOYY -19% | ||
| Baidu -20% | ||
| Weibo -28% | ||
| In a hurry? China Stocks Lists: Performance Trends Table, Stock Charts
Sort China stocks: Daily, Weekly, Year-to-Date, Market Cap & Trends. Filter China stocks list by sector: Show all, Tech, Finance, Energy, Staples, Retail, Industrial, Materials, Utilities and HealthCare Filter China stocks list by size: All China Large Medium Small and MicroCap |
| April 20, 2024 - 12Stocks.com China Stocks Performances & Trends Daily | |||||||||
|
|  The overall Smart Investing & Trading Score is 74 (0-bearish to 100-bullish) which puts China index in short term neutral to bullish trend. The Smart Investing & Trading Score from previous trading session is 73 and hence an improvement of trend.
| ||||||||
| Here are the Smart Investing & Trading Scores of the most requested China stocks at 12Stocks.com (click stock name for detailed review): |


| 12Stocks.com: Top Performing China Index Stocks | ||||||||||||||||||||||||||||||||||||||||||||||||
 The top performing China Index stocks year to date are
Now, more recently, over last week, the top performing China Index stocks on the move are


|
||||||||||||||||||||||||||||||||||||||||||||||||
| 12Stocks.com: Investing in China Index with Stocks | |
|
The following table helps investors and traders sort through current performance and trends (as measured by Smart Investing & Trading Score) of various
stocks in the China Index. Quick View: Move mouse or cursor over stock symbol (ticker) to view short-term technical chart and over stock name to view long term chart. Click on  to add stock symbol to your watchlist and to add stock symbol to your watchlist and  to view watchlist. Click on any ticker or stock name for detailed market intelligence report for that stock. to view watchlist. Click on any ticker or stock name for detailed market intelligence report for that stock. |
12Stocks.com Performance of Stocks in China Index
| Ticker | Stock Name | Watchlist | Category | Recent Price | Smart Investing & Trading Score | Change % | YTD Change% |
| DQ | Daqo New |   | Technology | 22.11 | 46 | -2.64% | -16.88% |
| BNR | Burning Rock | | Health Care | 0.80 | 54 | 3.52% | -17.09% |
| CNF | CNFinance | | Financials | 1.84 | 10 | -0.54% | -17.12% |
| BEST | BEST | | Consumer Staples | 2.08 | 25 | 0.00% | -18.48% |
| YY | JOYY | | Technology | 32.23 | 66 | -1.32% | -18.82% |
| COE | China Online | | Services & Goods | 6.47 | 0 | -1.97% | -19.44% |
| MOMO | Momo | | Technology | 5.59 | 35 | -1.58% | -19.57% |
| STG | Sunlands | | Services & Goods | 8.16 | 10 | 1.94% | -19.71% |
| BIDU | Baidu | | Technology | 95.05 | 10 | -0.55% | -20.19% |
| BEKE | KE | | Financials | 12.65 | 10 | -0.78% | -21.96% |
| PDD | Pinduoduo | | Services & Goods | 113.49 | 28 | -0.18% | -22.43% |
| DDL | Dingdong (Cayman) | | Consumer Staples | 1.15 | 30 | 2.68% | -24.34% |
| GHG | GreenTree Hospitality | | Services & Goods | 2.83 | 10 | 3.43% | -24.63% |
| UTSI | UTStarcom | | Technology | 2.59 | 10 | -1.52% | -24.71% |
| HKD | AMTD Digital | | Technology | 3.08 | 10 | 0.33% | -25.42% |
| UCL | uCloudlink | | Technology | 1.38 | 5 | -2.79% | -25.68% |
| SECO | Secoo Holding | | Services & Goods | 0.42 | 49 | 4.75% | -25.84% |
| LI | Li Auto | | Services & Goods | 27.21 | 0 | -6.78% | -27.32% |
| EDTK | Skillful Craftsman | | Consumer Staples | 0.92 | 18 | -0.54% | -27.38% |
| WB | | Technology | 7.90 | 37 | -1.99% | -27.85% | |
| BGNE | BeiGene | | Health Care | 129.52 | 10 | -1.85% | -28.19% |
| THCH | TH | | Services & Goods | 1.23 | 67 | -5.38% | -29.31% |
| KC | Kingsoft Cloud | | Technology | 2.67 | 58 | 0.19% | -29.59% |
| MLCO | Melco Resorts | | Services & Goods | 6.16 | 0 | -1.20% | -30.61% |
| GDS | GDS | | Technology | 6.32 | 88 | -1.40% | -30.70% |
| For chart view version of above stock list: Chart View ➞ 0 - 25 , 25 - 50 , 50 - 75 , 75 - 100 , 100 - 125 , 125 - 150 | ||
 | Click To Change The Sort Order: By Market Cap or Company Size Performance: Year-to-date, Week and Day |  |
|
Get the most comprehensive stock market coverage daily at 12Stocks.com ➞ Best Stocks Today ➞ Best Stocks Weekly ➞ Best Stocks Year-to-Date ➞ Best Stocks Trends ➞  Best Stocks Today 12Stocks.com Best Nasdaq Stocks ➞ Best S&P 500 Stocks ➞ Best Tech Stocks ➞ Best Biotech Stocks ➞ |
| Detailed Overview of China Stocks |
| China Technical Overview, Leaders & Laggards, Top China ETF Funds & Detailed China Stocks List, Charts, Trends & More |
| China: Technical Analysis, Trends & YTD Performance | |
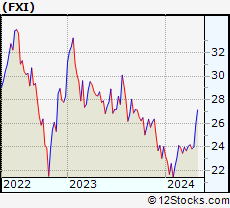
 FXI Weekly Chart |
|
| Long Term Trend: Very Good | |
| Medium Term Trend: Not Good | |
 FXI Daily Chart |
|
| Short Term Trend: Very Good | |
| Overall Trend Score: 74 | |
| YTD Performance: -0.08% | |
| **Trend Scores & Views Are Only For Educational Purposes And Not For Investing | |
| 12Stocks.com: Investing in China Index using Exchange Traded Funds | |
|
The following table shows list of key exchange traded funds (ETF) that
help investors play China stock market. For detailed view, check out our ETF Funds section of our website. Quick View: Move mouse or cursor over ETF symbol (ticker) to view short-term technical chart and over ETF name to view long term chart. Click on ticker or stock name for detailed view. Click on to add stock symbol to your watchlist and to view watchlist. |
12Stocks.com List of ETFs that track China Index
| Ticker | ETF Name | Watchlist | Recent Price | Smart Investing & Trading Score | Change % | Week % | Year-to-date % |
| FXI | China Large-Cap | | 24.01 | 74 | -0.29 | 0.71 | -0.08% |
| EWH | Hong Kong | | 14.70 | 18 | -0.27 | -3.03 | -15.37% |
| YINN | China Bull 3X | | 18.77 | 66 | -0.21 | 2.07 | -10.36% |
| YANG | China Bear 3X | | 11.67 | 32 | 0.78 | -1.85 | -8.83% |
| XPP | China 50 | | 12.97 | 73 | -0.17 | 1.47 | -5.66% |
| MCHI | China | | 39.41 | 59 | -0.33 | 0.33 | -3.26% |
| GXC | China | | 65.33 | 59 | -0.29 | 0.4 | -4.1% |
| CBON | ChinaAMC China Bond | | 21.93 | 60 | 0.05 | 0.3 | -0.79% |
| 12Stocks.com: Charts, Trends, Fundamental Data and Performances of China Stocks | |
|
We now take in-depth look at all China stocks including charts, multi-period performances and overall trends (as measured by Smart Investing & Trading Score). One can sort China stocks (click link to choose) by Daily, Weekly and by Year-to-Date performances. Also, one can sort by size of the company or by market capitalization. |
| Select Your Default Chart Type: | |||||
| |||||
| Click on stock symbol or name for detailed view. Click on to add stock symbol to your watchlist and to view watchlist. Quick View: Move mouse or cursor over "Daily" to quickly view daily technical stock chart and over "Weekly" to view weekly technical stock chart. | |||||

 | DQ Daqo New Energy Corp. |
| Sector: Technology | |
| SubSector: Semiconductor Equipment & Materials | |
| MarketCap: 660.918 Millions | |
| Recent Price: 22.11 Smart Investing & Trading Score: 46 | |
| Day Percent Change: -2.64% Day Change: -0.60 | |
| Week Change: -5.27% Year-to-date Change: -16.9% | |
| DQ Links: Profile News Message Board | |
| Charts:- Daily , Weekly | |
| Add DQ to Watchlist: View: Get Complete DQ Trend Analysis ➞ | |
 | BNR Burning Rock Biotech Limited |
| Sector: Health Care | |
| SubSector: Diagnostics & Research | |
| MarketCap: 27887 Millions | |
| Recent Price: 0.80 Smart Investing & Trading Score: 54 | |
| Day Percent Change: 3.52% Day Change: 0.03 | |
| Week Change: 5.26% Year-to-date Change: -17.1% | |
| BNR Links: Profile News Message Board | |
| Charts:- Daily , Weekly | |
| Add BNR to Watchlist: View: Get Complete BNR Trend Analysis ➞ | |
 | CNF CNFinance Holdings Limited |
| Sector: Financials | |
| SubSector: Credit Services | |
| MarketCap: 277.408 Millions | |
| Recent Price: 1.84 Smart Investing & Trading Score: 10 | |
| Day Percent Change: -0.54% Day Change: -0.01 | |
| Week Change: -0.54% Year-to-date Change: -17.1% | |
| CNF Links: Profile News Message Board | |
| Charts:- Daily , Weekly | |
| Add CNF to Watchlist: View: Get Complete CNF Trend Analysis ➞ | |
 | BEST BEST Inc. |
| Sector: Consumer Staples | |
| SubSector: Packaging & Containers | |
| MarketCap: 1981.73 Millions | |
| Recent Price: 2.08 Smart Investing & Trading Score: 25 | |
| Day Percent Change: 0.00% Day Change: 0.00 | |
| Week Change: -0.95% Year-to-date Change: -18.5% | |
| BEST Links: Profile News Message Board | |
| Charts:- Daily , Weekly | |
| Add BEST to Watchlist: View: Get Complete BEST Trend Analysis ➞ | |
 | YY JOYY Inc. |
| Sector: Technology | |
| SubSector: Internet Information Providers | |
| MarketCap: 3527.6 Millions | |
| Recent Price: 32.23 Smart Investing & Trading Score: 66 | |
| Day Percent Change: -1.32% Day Change: -0.43 | |
| Week Change: -2.04% Year-to-date Change: -18.8% | |
| YY Links: Profile News Message Board | |
| Charts:- Daily , Weekly | |
| Add YY to Watchlist: View: Get Complete YY Trend Analysis ➞ | |
 | COE China Online Education Group |
| Sector: Services & Goods | |
| SubSector: Education & Training Services | |
| MarketCap: 643.406 Millions | |
| Recent Price: 6.47 Smart Investing & Trading Score: 0 | |
| Day Percent Change: -1.97% Day Change: -0.13 | |
| Week Change: -0.61% Year-to-date Change: -19.4% | |
| COE Links: Profile News Message Board | |
| Charts:- Daily , Weekly | |
| Add COE to Watchlist: View: Get Complete COE Trend Analysis ➞ | |
 | MOMO Momo Inc. |
| Sector: Technology | |
| SubSector: Internet Software & Services | |
| MarketCap: 4796.71 Millions | |
| Recent Price: 5.59 Smart Investing & Trading Score: 35 | |
| Day Percent Change: -1.58% Day Change: -0.09 | |
| Week Change: 5.47% Year-to-date Change: -19.6% | |
| MOMO Links: Profile News Message Board | |
| Charts:- Daily , Weekly | |
| Add MOMO to Watchlist: View: Get Complete MOMO Trend Analysis ➞ | |
 | STG Sunlands Technology Group |
| Sector: Services & Goods | |
| SubSector: Education & Training Services | |
| MarketCap: 295.706 Millions | |
| Recent Price: 8.16 Smart Investing & Trading Score: 10 | |
| Day Percent Change: 1.94% Day Change: 0.15 | |
| Week Change: -7.02% Year-to-date Change: -19.7% | |
| STG Links: Profile News Message Board | |
| Charts:- Daily , Weekly | |
| Add STG to Watchlist: View: Get Complete STG Trend Analysis ➞ | |
 | BIDU Baidu, Inc. |
| Sector: Technology | |
| SubSector: Internet Information Providers | |
| MarketCap: 33525.9 Millions | |
| Recent Price: 95.05 Smart Investing & Trading Score: 10 | |
| Day Percent Change: -0.55% Day Change: -0.53 | |
| Week Change: -2.55% Year-to-date Change: -20.2% | |
| BIDU Links: Profile News Message Board | |
| Charts:- Daily , Weekly | |
| Add BIDU to Watchlist: View: Get Complete BIDU Trend Analysis ➞ | |
 | BEKE KE Holdings Inc. |
| Sector: Financials | |
| SubSector: Real Estate Services | |
| MarketCap: 80167 Millions | |
| Recent Price: 12.65 Smart Investing & Trading Score: 10 | |
| Day Percent Change: -0.78% Day Change: -0.10 | |
| Week Change: -3.88% Year-to-date Change: -22.0% | |
| BEKE Links: Profile News Message Board | |
| Charts:- Daily , Weekly | |
| Add BEKE to Watchlist: View: Get Complete BEKE Trend Analysis ➞ | |
 | PDD Pinduoduo Inc. |
| Sector: Services & Goods | |
| SubSector: Specialty Retail, Other | |
| MarketCap: 41696.2 Millions | |
| Recent Price: 113.49 Smart Investing & Trading Score: 28 | |
| Day Percent Change: -0.18% Day Change: -0.21 | |
| Week Change: -1.74% Year-to-date Change: -22.4% | |
| PDD Links: Profile News Message Board | |
| Charts:- Daily , Weekly | |
| Add PDD to Watchlist: View: Get Complete PDD Trend Analysis ➞ | |
 | DDL Dingdong (Cayman) Limited |
| Sector: Consumer Staples | |
| SubSector: Grocery Stores | |
| MarketCap: 708 Millions | |
| Recent Price: 1.15 Smart Investing & Trading Score: 30 | |
| Day Percent Change: 2.68% Day Change: 0.03 | |
| Week Change: -4.96% Year-to-date Change: -24.3% | |
| DDL Links: Profile News Message Board | |
| Charts:- Daily , Weekly | |
| Add DDL to Watchlist: View: Get Complete DDL Trend Analysis ➞ | |
 | GHG GreenTree Hospitality Group Ltd. |
| Sector: Services & Goods | |
| SubSector: Lodging | |
| MarketCap: 1195.36 Millions | |
| Recent Price: 2.83 Smart Investing & Trading Score: 10 | |
| Day Percent Change: 3.43% Day Change: 0.09 | |
| Week Change: -7.39% Year-to-date Change: -24.6% | |
| GHG Links: Profile News Message Board | |
| Charts:- Daily , Weekly | |
| Add GHG to Watchlist: View: Get Complete GHG Trend Analysis ➞ | |
 | UTSI UTStarcom Holdings Corp. |
| Sector: Technology | |
| SubSector: Communication Equipment | |
| MarketCap: 76.6539 Millions | |
| Recent Price: 2.59 Smart Investing & Trading Score: 10 | |
| Day Percent Change: -1.52% Day Change: -0.04 | |
| Week Change: -4.07% Year-to-date Change: -24.7% | |
| UTSI Links: Profile News Message Board | |
| Charts:- Daily , Weekly | |
| Add UTSI to Watchlist: View: Get Complete UTSI Trend Analysis ➞ | |
 | HKD AMTD Digital Inc. |
| Sector: Technology | |
| SubSector: Software - Application | |
| MarketCap: 1200 Millions | |
| Recent Price: 3.08 Smart Investing & Trading Score: 10 | |
| Day Percent Change: 0.33% Day Change: 0.01 | |
| Week Change: -8.33% Year-to-date Change: -25.4% | |
| HKD Links: Profile News Message Board | |
| Charts:- Daily , Weekly | |
| Add HKD to Watchlist: View: Get Complete HKD Trend Analysis ➞ | |
 | UCL uCloudlink Group Inc. |
| Sector: Technology | |
| SubSector: Telecom Services | |
| MarketCap: 35837 Millions | |
| Recent Price: 1.38 Smart Investing & Trading Score: 5 | |
| Day Percent Change: -2.79% Day Change: -0.04 | |
| Week Change: -11.35% Year-to-date Change: -25.7% | |
| UCL Links: Profile News Message Board | |
| Charts:- Daily , Weekly | |
| Add UCL to Watchlist: View: Get Complete UCL Trend Analysis ➞ | |
 | SECO Secoo Holding Limited |
| Sector: Services & Goods | |
| SubSector: Specialty Retail, Other | |
| MarketCap: 209.144 Millions | |
| Recent Price: 0.42 Smart Investing & Trading Score: 49 | |
| Day Percent Change: 4.75% Day Change: 0.02 | |
| Week Change: 17.14% Year-to-date Change: -25.8% | |
| SECO Links: Profile News Message Board | |
| Charts:- Daily , Weekly | |
| Add SECO to Watchlist: View: Get Complete SECO Trend Analysis ➞ | |
 | LI Li Auto Inc. |
| Sector: Services & Goods | |
| SubSector: Auto Manufacturers | |
| MarketCap: 29167 Millions | |
| Recent Price: 27.21 Smart Investing & Trading Score: 0 | |
| Day Percent Change: -6.78% Day Change: -1.98 | |
| Week Change: -7.42% Year-to-date Change: -27.3% | |
| LI Links: Profile News Message Board | |
| Charts:- Daily , Weekly | |
| Add LI to Watchlist: View: Get Complete LI Trend Analysis ➞ | |
 | EDTK Skillful Craftsman Education Technology Limited |
| Sector: Consumer Staples | |
| SubSector: Education & Training Services | |
| MarketCap: 32347 Millions | |
| Recent Price: 0.92 Smart Investing & Trading Score: 18 | |
| Day Percent Change: -0.54% Day Change: -0.01 | |
| Week Change: -0.54% Year-to-date Change: -27.4% | |
| EDTK Links: Profile News Message Board | |
| Charts:- Daily , Weekly | |
| Add EDTK to Watchlist: View: Get Complete EDTK Trend Analysis ➞ | |
 | WB Weibo Corporation |
| Sector: Technology | |
| SubSector: Internet Information Providers | |
| MarketCap: 8164.6 Millions | |
| Recent Price: 7.90 Smart Investing & Trading Score: 37 | |
| Day Percent Change: -1.99% Day Change: -0.16 | |
| Week Change: 3.54% Year-to-date Change: -27.9% | |
| WB Links: Profile News Message Board | |
| Charts:- Daily , Weekly | |
| Add WB to Watchlist: View: Get Complete WB Trend Analysis ➞ | |
 | BGNE BeiGene, Ltd. |
| Sector: Health Care | |
| SubSector: Biotechnology | |
| MarketCap: 10838.5 Millions | |
| Recent Price: 129.52 Smart Investing & Trading Score: 10 | |
| Day Percent Change: -1.85% Day Change: -2.44 | |
| Week Change: -8.34% Year-to-date Change: -28.2% | |
| BGNE Links: Profile News Message Board | |
| Charts:- Daily , Weekly | |
| Add BGNE to Watchlist: View: Get Complete BGNE Trend Analysis ➞ | |
 | THCH TH International Limited |
| Sector: Services & Goods | |
| SubSector: Restaurants | |
| MarketCap: 452 Millions | |
| Recent Price: 1.23 Smart Investing & Trading Score: 67 | |
| Day Percent Change: -5.38% Day Change: -0.07 | |
| Week Change: 11.82% Year-to-date Change: -29.3% | |
| THCH Links: Profile News Message Board | |
| Charts:- Daily , Weekly | |
| Add THCH to Watchlist: View: Get Complete THCH Trend Analysis ➞ | |
 | KC Kingsoft Cloud Holdings Limited |
| Sector: Technology | |
| SubSector: Software Application | |
| MarketCap: 98487 Millions | |
| Recent Price: 2.67 Smart Investing & Trading Score: 58 | |
| Day Percent Change: 0.19% Day Change: 0.00 | |
| Week Change: -1.3% Year-to-date Change: -29.6% | |
| KC Links: Profile News Message Board | |
| Charts:- Daily , Weekly | |
| Add KC to Watchlist: View: Get Complete KC Trend Analysis ➞ | |
 | MLCO Melco Resorts & Entertainment Limited |
| Sector: Services & Goods | |
| SubSector: Resorts & Casinos | |
| MarketCap: 7031.14 Millions | |
| Recent Price: 6.16 Smart Investing & Trading Score: 0 | |
| Day Percent Change: -1.20% Day Change: -0.08 | |
| Week Change: -11.44% Year-to-date Change: -30.6% | |
| MLCO Links: Profile News Message Board | |
| Charts:- Daily , Weekly | |
| Add MLCO to Watchlist: View: Get Complete MLCO Trend Analysis ➞ | |
 | GDS GDS Holdings Limited |
| Sector: Technology | |
| SubSector: Data Storage Devices | |
| MarketCap: 8597.99 Millions | |
| Recent Price: 6.32 Smart Investing & Trading Score: 88 | |
| Day Percent Change: -1.40% Day Change: -0.09 | |
| Week Change: -6.23% Year-to-date Change: -30.7% | |
| GDS Links: Profile News Message Board | |
| Charts:- Daily , Weekly | |
| Add GDS to Watchlist: View: Get Complete GDS Trend Analysis ➞ | |
| For tabular summary view of above stock list: Summary View ➞ 0 - 25 , 25 - 50 , 50 - 75 , 75 - 100 , 100 - 125 , 125 - 150 | ||
| Click To Change The Sort Order: By Market Cap or Company Size Performance: Year-to-date, Week and Day | |
| Select Chart Type: | ||
|
Best Stocks Today 12Stocks.com |
© 2024 12Stocks.com Terms & Conditions Privacy Contact Us
All Information Provided Only For Education And Not To Be Used For Investing or Trading. See Terms & Conditions


One More Thing ... Get Best Stocks Delivered Daily!
Never Ever Miss A Move With Our Top Ten Stocks Lists
Find Best Stocks In Any Market - Bull or Bear Market
Take A Peek At Our Top Ten Stocks Lists: Daily, Weekly, Year-to-Date & Top Trends
Find Best Stocks In Any Market - Bull or Bear Market
Take A Peek At Our Top Ten Stocks Lists: Daily, Weekly, Year-to-Date & Top Trends
China Stocks With Best Up Trends [0-bearish to 100-bullish]: Full Truck[93], DouYu [90], GDS [88], GigaCloud [88], Smart Share[86], Bright Scholar[85], MOGU [83], Lufax Holding[83], So-Young [83], U Power[76], Yatsen Holding[76]
Best China Stocks Year-to-Date:
U Power[2768.3%], DouYu [747.37%], MicroCloud Hologram[702.88%], China Liberal[476.51%], Zhongchao [412.19%], Yatsen Holding[394.12%], Uxin [141.08%], QuantaSing [106.79%], GigaCloud [89.46%], Bright Scholar[60.8%], Cheetah Mobile[55.26%] Best China Stocks This Week:
Regencell Bioscience[45.67%], Yatsen Holding[20.1%], MingZhu Logistics[17.48%], Secoo Holding[17.14%], Zhongchao [14.02%], TH [11.82%], Bright Scholar[9.24%], Quhuo [8.87%], Smart Share[7.58%], DouYu [6.62%], China Liberal[6.27%] Best China Stocks Daily:
Lanvin [11.19%], MingZhu Logistics[10.31%], Bright Scholar[6.91%], Regencell Bioscience[6.32%], MOGU [5.85%], Cheetah Mobile[5.04%], Secoo Holding[4.75%], Burning Rock[3.52%], Boqii Holding[3.47%], GreenTree Hospitality[3.43%], China Liberal[3.08%]