
 Login Sign Up


| |||||
 |  | ||||

| 12Stocks.com Market Intelligence |
Best China Stocks
|
On this page, you will find the most comprehensive analysis of Chinese stocks and ETFs - from latest trends to performances to charts ➞. First, here are the year-to-date (YTD) performances of the most requested China stocks at 12Stocks.com (click stock for review):
| New Oriental 17% | ||
| Sohu.com 11% | ||
| NetEase -0% | ||
| Alibaba -11% | ||
| JD.com -13% | ||
| Vipshop -14% | ||
| JOYY -18% | ||
| Baidu -20% | ||
| Weibo -27% | ||
| In a hurry? China Stocks Lists: Performance Trends Table, Stock Charts
Sort China stocks: Daily, Weekly, Year-to-Date, Market Cap & Trends. Filter China stocks list by sector: Show all, Tech, Finance, Energy, Staples, Retail, Industrial, Materials, Utilities and HealthCare Filter China stocks list by size: All China Large Medium Small and MicroCap |
| April 19, 2024 - 12Stocks.com China Stocks Performances & Trends Daily | |||||||||
|
|  The overall Smart Investing & Trading Score is 74 (0-bearish to 100-bullish) which puts China index in short term neutral to bullish trend. The Smart Investing & Trading Score from previous trading session is 73 and hence an improvement of trend.
| ||||||||
| Here are the Smart Investing & Trading Scores of the most requested China stocks at 12Stocks.com (click stock name for detailed review): |


| 12Stocks.com: Top Performing China Index Stocks | ||||||||||||||||||||||||||||||||||||||||||||||||
 The top performing China Index stocks year to date are
Now, more recently, over last week, the top performing China Index stocks on the move are


|
||||||||||||||||||||||||||||||||||||||||||||||||
| 12Stocks.com: Investing in China Index with Stocks | |
|
The following table helps investors and traders sort through current performance and trends (as measured by Smart Investing & Trading Score) of various
stocks in the China Index. Quick View: Move mouse or cursor over stock symbol (ticker) to view short-term technical chart and over stock name to view long term chart. Click on  to add stock symbol to your watchlist and to add stock symbol to your watchlist and  to view watchlist. Click on any ticker or stock name for detailed market intelligence report for that stock. to view watchlist. Click on any ticker or stock name for detailed market intelligence report for that stock. |
12Stocks.com Performance of Stocks in China Index
| Ticker | Stock Name | Watchlist | Category | Recent Price | Smart Investing & Trading Score | Change % | YTD Change% |
| XIN | Xinyuan Real |   | Financials | 2.58 | 7 | -0.77% | -5.15% |
| IMAB | I Mab | | Health Care | 1.79 | 48 | -0.28% | -5.53% |
| ZTO | ZTO Express | | Transports | 19.86 | 68 | -0.70% | -6.67% |
| DAO | Youdao | | Technology | 3.66 | 31 | 2.52% | -7.11% |
| HOLI | Hollysys Automation | | Industrials | 24.45 | 31 | 0.58% | -7.21% |
| SDA | SunCar | | Services & Goods | 7.17 | 27 | -4.27% | -7.72% |
| NIU | Niu | | Consumer Staples | 2.00 | 61 | -1.48% | -8.68% |
| API | Agora | | Technology | 2.41 | 15 | -1.23% | -8.71% |
| HCM | Hutchison China | | Health Care | 16.48 | 31 | 0.70% | -9.03% |
| TAL | TAL Education | | Services & Goods | 11.47 | 63 | -1.59% | -9.22% |
| XNET | Xunlei | | Technology | 1.47 | 42 | -0.34% | -9.26% |
| SY | So-Young | | Technology | 1.17 | 88 | -2.50% | -9.30% |
| BILI | Bilibili | | Technology | 11.02 | 36 | -0.50% | -9.49% |
| RLX | RLX | | Consumer Staples | 1.76 | 17 | -1.40% | -11.11% |
| BABA | Alibaba | | Services & Goods | 68.86 | 0 | -0.02% | -11.15% |
| YUMC | Yum China | | Services & Goods | 37.32 | 46 | 0.27% | -12.04% |
| LX | LexinFintech | | Financials | 1.61 | 0 | 0.00% | -12.50% |
| JD | JD.com | | Technology | 25.08 | 61 | -1.49% | -13.19% |
| ATHM | Autohome | | Technology | 24.34 | 18 | 0.33% | -13.26% |
| WIMI | WiMi Hologram | | Technology | 0.70 | 58 | -1.62% | -13.34% |
| NOAH | Noah | | Financials | 11.95 | 64 | -0.46% | -13.50% |
| VIPS | Vipshop | | Services & Goods | 15.22 | 0 | 0.43% | -14.33% |
| BZUN | Baozun | | Services & Goods | 2.33 | 68 | -2.10% | -14.96% |
| RERE | ATRenew | | Services & Goods | 1.60 | 43 | 0.95% | -15.34% |
| DQ | Daqo New | | Technology | 22.51 | 46 | -0.88% | -15.38% |
| For chart view version of above stock list: Chart View ➞ 0 - 25 , 25 - 50 , 50 - 75 , 75 - 100 , 100 - 125 , 125 - 150 | ||
 | Click To Change The Sort Order: By Market Cap or Company Size Performance: Year-to-date, Week and Day |  |
|
Get the most comprehensive stock market coverage daily at 12Stocks.com ➞ Best Stocks Today ➞ Best Stocks Weekly ➞ Best Stocks Year-to-Date ➞ Best Stocks Trends ➞  Best Stocks Today 12Stocks.com Best Nasdaq Stocks ➞ Best S&P 500 Stocks ➞ Best Tech Stocks ➞ Best Biotech Stocks ➞ |
| Detailed Overview of China Stocks |
| China Technical Overview, Leaders & Laggards, Top China ETF Funds & Detailed China Stocks List, Charts, Trends & More |
| China: Technical Analysis, Trends & YTD Performance | |
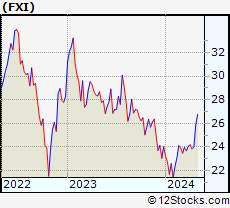
 FXI Weekly Chart |
|
| Long Term Trend: Very Good | |
| Medium Term Trend: Not Good | |
 FXI Daily Chart |
|
| Short Term Trend: Very Good | |
| Overall Trend Score: 74 | |
| YTD Performance: 0.06% | |
| **Trend Scores & Views Are Only For Educational Purposes And Not For Investing | |
| 12Stocks.com: Investing in China Index using Exchange Traded Funds | |
|
The following table shows list of key exchange traded funds (ETF) that
help investors play China stock market. For detailed view, check out our ETF Funds section of our website. Quick View: Move mouse or cursor over ETF symbol (ticker) to view short-term technical chart and over ETF name to view long term chart. Click on ticker or stock name for detailed view. Click on to add stock symbol to your watchlist and to view watchlist. |
12Stocks.com List of ETFs that track China Index
| Ticker | ETF Name | Watchlist | Recent Price | Smart Investing & Trading Score | Change % | Week % | Year-to-date % |
| FXI | China Large-Cap | | 24.05 | 74 | -0.15 | 0.86 | 0.06% |
| EWH | Hong Kong | | 14.73 | 18 | -0.03 | -2.8 | -15.17% |
| XPP | China 50 | | 12.93 | 73 | -0.46 | 1.17 | -5.93% |
| CBON | ChinaAMC China Bond | | 21.94 | 55 | 0.11 | 0.37 | -0.72% |
| 12Stocks.com: Charts, Trends, Fundamental Data and Performances of China Stocks | |
|
We now take in-depth look at all China stocks including charts, multi-period performances and overall trends (as measured by Smart Investing & Trading Score). One can sort China stocks (click link to choose) by Daily, Weekly and by Year-to-Date performances. Also, one can sort by size of the company or by market capitalization. |
| Select Your Default Chart Type: | |||||
| |||||
| Click on stock symbol or name for detailed view. Click on to add stock symbol to your watchlist and to view watchlist. Quick View: Move mouse or cursor over "Daily" to quickly view daily technical stock chart and over "Weekly" to view weekly technical stock chart. | |||||

 | XIN Xinyuan Real Estate Co., Ltd. |
| Sector: Financials | |
| SubSector: Real Estate Development | |
| MarketCap: 136.119 Millions | |
| Recent Price: 2.58 Smart Investing & Trading Score: 7 | |
| Day Percent Change: -0.77% Day Change: -0.02 | |
| Week Change: -3.37% Year-to-date Change: -5.2% | |
| XIN Links: Profile News Message Board | |
| Charts:- Daily , Weekly | |
| Add XIN to Watchlist: View: Get Complete XIN Trend Analysis ➞ | |
 | IMAB I Mab |
| Sector: Health Care | |
| SubSector: Biotechnology | |
| MarketCap: 26187 Millions | |
| Recent Price: 1.79 Smart Investing & Trading Score: 48 | |
| Day Percent Change: -0.28% Day Change: -0.01 | |
| Week Change: -0.83% Year-to-date Change: -5.5% | |
| IMAB Links: Profile News Message Board | |
| Charts:- Daily , Weekly | |
| Add IMAB to Watchlist: View: Get Complete IMAB Trend Analysis ➞ | |
 | ZTO ZTO Express (Cayman) Inc. |
| Sector: Transports | |
| SubSector: Air Delivery & Freight Services | |
| MarketCap: 20507 Millions | |
| Recent Price: 19.86 Smart Investing & Trading Score: 68 | |
| Day Percent Change: -0.70% Day Change: -0.14 | |
| Week Change: 3.12% Year-to-date Change: -6.7% | |
| ZTO Links: Profile News Message Board | |
| Charts:- Daily , Weekly | |
| Add ZTO to Watchlist: View: Get Complete ZTO Trend Analysis ➞ | |
 | DAO Youdao, Inc. |
| Sector: Technology | |
| SubSector: Internet Information Providers | |
| MarketCap: 2073.2 Millions | |
| Recent Price: 3.66 Smart Investing & Trading Score: 31 | |
| Day Percent Change: 2.52% Day Change: 0.09 | |
| Week Change: -8.27% Year-to-date Change: -7.1% | |
| DAO Links: Profile News Message Board | |
| Charts:- Daily , Weekly | |
| Add DAO to Watchlist: View: Get Complete DAO Trend Analysis ➞ | |
 | HOLI Hollysys Automation Technologies Ltd. |
| Sector: Industrials | |
| SubSector: Industrial Electrical Equipment | |
| MarketCap: 668.379 Millions | |
| Recent Price: 24.45 Smart Investing & Trading Score: 31 | |
| Day Percent Change: 0.58% Day Change: 0.14 | |
| Week Change: -3.7% Year-to-date Change: -7.2% | |
| HOLI Links: Profile News Message Board | |
| Charts:- Daily , Weekly | |
| Add HOLI to Watchlist: View: Get Complete HOLI Trend Analysis ➞ | |
 | SDA SunCar Technology Group Inc. |
| Sector: Services & Goods | |
| SubSector: Auto & Truck Dealerships | |
| MarketCap: 2680 Millions | |
| Recent Price: 7.17 Smart Investing & Trading Score: 27 | |
| Day Percent Change: -4.27% Day Change: -0.32 | |
| Week Change: 2.43% Year-to-date Change: -7.7% | |
| SDA Links: Profile News Message Board | |
| Charts:- Daily , Weekly | |
| Add SDA to Watchlist: View: Get Complete SDA Trend Analysis ➞ | |
 | NIU Niu Technologies |
| Sector: Consumer Staples | |
| SubSector: Auto Manufacturers - Major | |
| MarketCap: 543.271 Millions | |
| Recent Price: 2.00 Smart Investing & Trading Score: 61 | |
| Day Percent Change: -1.48% Day Change: -0.03 | |
| Week Change: -9.09% Year-to-date Change: -8.7% | |
| NIU Links: Profile News Message Board | |
| Charts:- Daily , Weekly | |
| Add NIU to Watchlist: View: Get Complete NIU Trend Analysis ➞ | |
 | API Agora, Inc. |
| Sector: Technology | |
| SubSector: Software Application | |
| MarketCap: 42787 Millions | |
| Recent Price: 2.41 Smart Investing & Trading Score: 15 | |
| Day Percent Change: -1.23% Day Change: -0.03 | |
| Week Change: -1.23% Year-to-date Change: -8.7% | |
| API Links: Profile News Message Board | |
| Charts:- Daily , Weekly | |
| Add API to Watchlist: View: Get Complete API Trend Analysis ➞ | |
 | HCM Hutchison China MediTech Limited |
| Sector: Health Care | |
| SubSector: Drug Manufacturers - Major | |
| MarketCap: 2324.43 Millions | |
| Recent Price: 16.48 Smart Investing & Trading Score: 31 | |
| Day Percent Change: 0.70% Day Change: 0.12 | |
| Week Change: -7.86% Year-to-date Change: -9.0% | |
| HCM Links: Profile News Message Board | |
| Charts:- Daily , Weekly | |
| Add HCM to Watchlist: View: Get Complete HCM Trend Analysis ➞ | |
 | TAL TAL Education Group |
| Sector: Services & Goods | |
| SubSector: Education & Training Services | |
| MarketCap: 30103.1 Millions | |
| Recent Price: 11.47 Smart Investing & Trading Score: 63 | |
| Day Percent Change: -1.59% Day Change: -0.19 | |
| Week Change: -2.01% Year-to-date Change: -9.2% | |
| TAL Links: Profile News Message Board | |
| Charts:- Daily , Weekly | |
| Add TAL to Watchlist: View: Get Complete TAL Trend Analysis ➞ | |
 | XNET Xunlei Limited |
| Sector: Technology | |
| SubSector: Application Software | |
| MarketCap: 203.662 Millions | |
| Recent Price: 1.47 Smart Investing & Trading Score: 42 | |
| Day Percent Change: -0.34% Day Change: -0.01 | |
| Week Change: -1.67% Year-to-date Change: -9.3% | |
| XNET Links: Profile News Message Board | |
| Charts:- Daily , Weekly | |
| Add XNET to Watchlist: View: Get Complete XNET Trend Analysis ➞ | |
 | SY So-Young International Inc. |
| Sector: Technology | |
| SubSector: Healthcare Information Services | |
| MarketCap: 1000.55 Millions | |
| Recent Price: 1.17 Smart Investing & Trading Score: 88 | |
| Day Percent Change: -2.50% Day Change: -0.03 | |
| Week Change: 0% Year-to-date Change: -9.3% | |
| SY Links: Profile News Message Board | |
| Charts:- Daily , Weekly | |
| Add SY to Watchlist: View: Get Complete SY Trend Analysis ➞ | |
 | BILI Bilibili Inc. |
| Sector: Technology | |
| SubSector: Internet Information Providers | |
| MarketCap: 7043.1 Millions | |
| Recent Price: 11.02 Smart Investing & Trading Score: 36 | |
| Day Percent Change: -0.50% Day Change: -0.05 | |
| Week Change: -4.05% Year-to-date Change: -9.5% | |
| BILI Links: Profile News Message Board | |
| Charts:- Daily , Weekly | |
| Add BILI to Watchlist: View: Get Complete BILI Trend Analysis ➞ | |
 | RLX RLX Technology Inc. |
| Sector: Consumer Staples | |
| SubSector: Tobacco | |
| MarketCap: 2800 Millions | |
| Recent Price: 1.76 Smart Investing & Trading Score: 17 | |
| Day Percent Change: -1.40% Day Change: -0.02 | |
| Week Change: 0% Year-to-date Change: -11.1% | |
| RLX Links: Profile News Message Board | |
| Charts:- Daily , Weekly | |
| Add RLX to Watchlist: View: Get Complete RLX Trend Analysis ➞ | |
 | BABA Alibaba Group Holding Limited |
| Sector: Services & Goods | |
| SubSector: Specialty Retail, Other | |
| MarketCap: 522666 Millions | |
| Recent Price: 68.86 Smart Investing & Trading Score: 0 | |
| Day Percent Change: -0.02% Day Change: -0.02 | |
| Week Change: -3.4% Year-to-date Change: -11.2% | |
| BABA Links: Profile News Message Board | |
| Charts:- Daily , Weekly | |
| Add BABA to Watchlist: View: Get Complete BABA Trend Analysis ➞ | |
 | YUMC Yum China Holdings, Inc. |
| Sector: Services & Goods | |
| SubSector: Restaurants | |
| MarketCap: 16284.5 Millions | |
| Recent Price: 37.32 Smart Investing & Trading Score: 46 | |
| Day Percent Change: 0.27% Day Change: 0.10 | |
| Week Change: -0.05% Year-to-date Change: -12.0% | |
| YUMC Links: Profile News Message Board | |
| Charts:- Daily , Weekly | |
| Add YUMC to Watchlist: View: Get Complete YUMC Trend Analysis ➞ | |
 | LX LexinFintech Holdings Ltd. |
| Sector: Financials | |
| SubSector: Credit Services | |
| MarketCap: 1674.18 Millions | |
| Recent Price: 1.61 Smart Investing & Trading Score: 0 | |
| Day Percent Change: 0.00% Day Change: 0.00 | |
| Week Change: -8.52% Year-to-date Change: -12.5% | |
| LX Links: Profile News Message Board | |
| Charts:- Daily , Weekly | |
| Add LX to Watchlist: View: Get Complete LX Trend Analysis ➞ | |
 | JD JD.com, Inc. |
| Sector: Technology | |
| SubSector: Internet Information Providers | |
| MarketCap: 59907.3 Millions | |
| Recent Price: 25.08 Smart Investing & Trading Score: 61 | |
| Day Percent Change: -1.49% Day Change: -0.38 | |
| Week Change: -1.22% Year-to-date Change: -13.2% | |
| JD Links: Profile News Message Board | |
| Charts:- Daily , Weekly | |
| Add JD to Watchlist: View: Get Complete JD Trend Analysis ➞ | |
 | ATHM Autohome Inc. |
| Sector: Technology | |
| SubSector: Internet Information Providers | |
| MarketCap: 7984.2 Millions | |
| Recent Price: 24.34 Smart Investing & Trading Score: 18 | |
| Day Percent Change: 0.33% Day Change: 0.08 | |
| Week Change: -3.57% Year-to-date Change: -13.3% | |
| ATHM Links: Profile News Message Board | |
| Charts:- Daily , Weekly | |
| Add ATHM to Watchlist: View: Get Complete ATHM Trend Analysis ➞ | |
 | WIMI WiMi Hologram Cloud Inc. |
| Sector: Technology | |
| SubSector: Advertising Agencies | |
| MarketCap: 41837 Millions | |
| Recent Price: 0.70 Smart Investing & Trading Score: 58 | |
| Day Percent Change: -1.62% Day Change: -0.01 | |
| Week Change: -4.32% Year-to-date Change: -13.3% | |
| WIMI Links: Profile News Message Board | |
| Charts:- Daily , Weekly | |
| Add WIMI to Watchlist: View: Get Complete WIMI Trend Analysis ➞ | |
 | NOAH Noah Holdings Limited |
| Sector: Financials | |
| SubSector: Asset Management | |
| MarketCap: 1495.33 Millions | |
| Recent Price: 11.95 Smart Investing & Trading Score: 64 | |
| Day Percent Change: -0.46% Day Change: -0.05 | |
| Week Change: -7.19% Year-to-date Change: -13.5% | |
| NOAH Links: Profile News Message Board | |
| Charts:- Daily , Weekly | |
| Add NOAH to Watchlist: View: Get Complete NOAH Trend Analysis ➞ | |
 | VIPS Vipshop Holdings Limited |
| Sector: Services & Goods | |
| SubSector: Catalog & Mail Order Houses | |
| MarketCap: 10496.2 Millions | |
| Recent Price: 15.22 Smart Investing & Trading Score: 0 | |
| Day Percent Change: 0.43% Day Change: 0.06 | |
| Week Change: -6.37% Year-to-date Change: -14.3% | |
| VIPS Links: Profile News Message Board | |
| Charts:- Daily , Weekly | |
| Add VIPS to Watchlist: View: Get Complete VIPS Trend Analysis ➞ | |
 | BZUN Baozun Inc. |
| Sector: Services & Goods | |
| SubSector: Catalog & Mail Order Houses | |
| MarketCap: 1668.92 Millions | |
| Recent Price: 2.33 Smart Investing & Trading Score: 68 | |
| Day Percent Change: -2.10% Day Change: -0.05 | |
| Week Change: -1.69% Year-to-date Change: -15.0% | |
| BZUN Links: Profile News Message Board | |
| Charts:- Daily , Weekly | |
| Add BZUN to Watchlist: View: Get Complete BZUN Trend Analysis ➞ | |
 | RERE ATRenew Inc. |
| Sector: Services & Goods | |
| SubSector: Internet Retail | |
| MarketCap: 672 Millions | |
| Recent Price: 1.60 Smart Investing & Trading Score: 43 | |
| Day Percent Change: 0.95% Day Change: 0.02 | |
| Week Change: -8.05% Year-to-date Change: -15.3% | |
| RERE Links: Profile News Message Board | |
| Charts:- Daily , Weekly | |
| Add RERE to Watchlist: View: Get Complete RERE Trend Analysis ➞ | |
 | DQ Daqo New Energy Corp. |
| Sector: Technology | |
| SubSector: Semiconductor Equipment & Materials | |
| MarketCap: 660.918 Millions | |
| Recent Price: 22.51 Smart Investing & Trading Score: 46 | |
| Day Percent Change: -0.88% Day Change: -0.20 | |
| Week Change: -3.56% Year-to-date Change: -15.4% | |
| DQ Links: Profile News Message Board | |
| Charts:- Daily , Weekly | |
| Add DQ to Watchlist: View: Get Complete DQ Trend Analysis ➞ | |
| For tabular summary view of above stock list: Summary View ➞ 0 - 25 , 25 - 50 , 50 - 75 , 75 - 100 , 100 - 125 , 125 - 150 | ||
| Click To Change The Sort Order: By Market Cap or Company Size Performance: Year-to-date, Week and Day | |
| Select Chart Type: | ||
|
Best Stocks Today 12Stocks.com |
© 2024 12Stocks.com Terms & Conditions Privacy Contact Us
All Information Provided Only For Education And Not To Be Used For Investing or Trading. See Terms & Conditions


One More Thing ... Get Best Stocks Delivered Daily!
Never Ever Miss A Move With Our Top Ten Stocks Lists
Find Best Stocks In Any Market - Bull or Bear Market
Take A Peek At Our Top Ten Stocks Lists: Daily, Weekly, Year-to-Date & Top Trends
Find Best Stocks In Any Market - Bull or Bear Market
Take A Peek At Our Top Ten Stocks Lists: Daily, Weekly, Year-to-Date & Top Trends
China Stocks With Best Up Trends [0-bearish to 100-bullish]: Full Truck[93], GigaCloud [93], Zhongchao [93], DouYu [90], GDS [88], So-Young [88], Smart Share[86], Lufax Holding[83], U Power[76], Tencent Music[76], MingZhu Logistics[74]
Best China Stocks Year-to-Date:
U Power[2818.53%], DouYu [746.84%], MicroCloud Hologram[664.03%], China Liberal[476.51%], Zhongchao [412.19%], Yatsen Holding[394.12%], Uxin [141.08%], QuantaSing [111.73%], GigaCloud [95.49%], Bright Scholar[68%], Cheetah Mobile[58.33%] Best China Stocks This Week:
Regencell Bioscience[37.01%], Yatsen Holding[20.1%], MingZhu Logistics[17.48%], Secoo Holding[15.24%], Bright Scholar[14.13%], Zhongchao [14.02%], Smart Share[9.26%], Quhuo [8.87%], EHang [7.46%], Momo [6.79%], DouYu [6.56%] Best China Stocks Daily:
Hywin [17.78%], Bright Scholar[11.70%], MingZhu Logistics[10.31%], Fanhua [9.68%], Cheetah Mobile[7.12%], Lanvin [6.99%], Aesthetic Medical[6.77%], GreenTree Hospitality[4.56%], Fangdd Network[4.00%], Burning Rock[3.52%], Boqii Holding[3.47%]