
 Login Sign Up


| |||||
 |  | ||||

| 12Stocks.com Market Intelligence |
Best China Stocks
|
On this page, you will find the most comprehensive analysis of Chinese stocks and ETFs - from latest trends to performances to charts ➞. First, here are the year-to-date (YTD) performances of the most requested China stocks at 12Stocks.com (click stock for review):
| New Oriental 17% | ||
| Sohu.com 13% | ||
| NetEase -1% | ||
| Alibaba -9% | ||
| Vipshop -9% | ||
| JD.com -12% | ||
| JOYY -18% | ||
| Baidu -19% | ||
| Weibo -30% | ||
| In a hurry? China Stocks Lists: Performance Trends Table, Stock Charts
Sort China stocks: Daily, Weekly, Year-to-Date, Market Cap & Trends. Filter China stocks list by sector: Show all, Tech, Finance, Energy, Staples, Retail, Industrial, Materials, Utilities and HealthCare Filter China stocks list by size: All China Large Medium Small and MicroCap |
| April 16, 2024 - 12Stocks.com China Stocks Performances & Trends Daily | |||||||||
|
|  The overall Smart Investing & Trading Score is 44 (0-bearish to 100-bullish) which puts China index in short term neutral trend. The Smart Investing & Trading Score from previous trading session is 100 and a deterioration of trend continues.
| ||||||||
| Here are the Smart Investing & Trading Scores of the most requested China stocks at 12Stocks.com (click stock name for detailed review): |

| 12Stocks.com: Top Performing China Index Stocks | ||||||||||||||||||||||||||||||||||||||||||||||||
 The top performing China Index stocks year to date are
Now, more recently, over last week, the top performing China Index stocks on the move are


|
||||||||||||||||||||||||||||||||||||||||||||||||
| 12Stocks.com: Investing in China Index with Stocks | |
|
The following table helps investors and traders sort through current performance and trends (as measured by Smart Investing & Trading Score) of various
stocks in the China Index. Quick View: Move mouse or cursor over stock symbol (ticker) to view short-term technical chart and over stock name to view long term chart. Click on  to add stock symbol to your watchlist and to add stock symbol to your watchlist and  to view watchlist. Click on any ticker or stock name for detailed market intelligence report for that stock. to view watchlist. Click on any ticker or stock name for detailed market intelligence report for that stock. |
12Stocks.com Performance of Stocks in China Index
| Ticker | Stock Name | Watchlist | Category | Recent Price | Smart Investing & Trading Score | Change % | Weekly Change% |
| MSC | Studio City |   | Services & Goods | 7.57 | 51 | -10.94% | -10.94% |
| FANH | Fanhua | | Financials | 3.70 | 0 | -11.06% | -11.06% |
| YJ | Yunji | | Services & Goods | 0.77 | 45 | -12.00% | -12.00% |
| WIMI | WiMi Hologram | | Technology | 0.63 | 0 | -13.19% | -13.19% |
| ZCMD | Zhongchao | | Health Care | 1.40 | 41 | -14.63% | -14.63% |
| HOLO | MicroCloud Hologram | | Technology | 2.47 | 26 | -15.12% | -15.12% |
| GDHG | Golden Heaven | | Services & Goods | 0.22 | 10 | -24.95% | -24.95% |
| For chart view version of above stock list: Chart View ➞ 0 - 25 , 25 - 50 , 50 - 75 , 75 - 100 , 100 - 125 , 125 - 150 | ||
 | Click To Change The Sort Order: By Market Cap or Company Size Performance: Year-to-date, Week and Day |  |
|
Get the most comprehensive stock market coverage daily at 12Stocks.com ➞ Best Stocks Today ➞ Best Stocks Weekly ➞ Best Stocks Year-to-Date ➞ Best Stocks Trends ➞  Best Stocks Today 12Stocks.com Best Nasdaq Stocks ➞ Best S&P 500 Stocks ➞ Best Tech Stocks ➞ Best Biotech Stocks ➞ |
| Detailed Overview of China Stocks |
| China Technical Overview, Leaders & Laggards, Top China ETF Funds & Detailed China Stocks List, Charts, Trends & More |
| China: Technical Analysis, Trends & YTD Performance | |
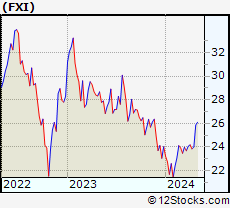
 FXI Weekly Chart |
|
| Long Term Trend: Very Good | |
| Medium Term Trend: Not Good | |
 FXI Daily Chart |
|
| Short Term Trend: Not Good | |
| Overall Trend Score: 44 | |
| YTD Performance: -0.46% | |
| **Trend Scores & Views Are Only For Educational Purposes And Not For Investing | |
| 12Stocks.com: Investing in China Index using Exchange Traded Funds | |
|
The following table shows list of key exchange traded funds (ETF) that
help investors play China stock market. For detailed view, check out our ETF Funds section of our website. Quick View: Move mouse or cursor over ETF symbol (ticker) to view short-term technical chart and over ETF name to view long term chart. Click on ticker or stock name for detailed view. Click on to add stock symbol to your watchlist and to view watchlist. |
12Stocks.com List of ETFs that track China Index
| Ticker | ETF Name | Watchlist | Recent Price | Smart Investing & Trading Score | Change % | Week % | Year-to-date % |
| FXI | China Large-Cap | | 23.92 | 44 | 0.34 | 0.34 | -0.46% |
| EWH | Hong Kong | | 14.95 | 0 | -1.39 | -1.39 | -13.93% |
| YINN | China Bull 3X | | 18.56 | 41 | 0.92 | 0.92 | -11.37% |
| YANG | China Bear 3X | | 11.80 | 57 | -0.76 | -0.76 | -7.81% |
| XPP | China 50 | | 12.90 | 41 | 0.94 | 0.94 | -6.15% |
| MCHI | China | | 39.42 | 36 | 0.36 | 0.36 | -3.24% |
| GXC | China | | 65.28 | 36 | 0.32 | 0.32 | -4.17% |
| CBON | ChinaAMC China Bond | | 21.85 | 58 | -0.05 | -0.05 | -1.13% |
| 12Stocks.com: Charts, Trends, Fundamental Data and Performances of China Stocks | |
|
We now take in-depth look at all China stocks including charts, multi-period performances and overall trends (as measured by Smart Investing & Trading Score). One can sort China stocks (click link to choose) by Daily, Weekly and by Year-to-Date performances. Also, one can sort by size of the company or by market capitalization. |
| Select Your Default Chart Type: | |||||
| |||||
| Click on stock symbol or name for detailed view. Click on to add stock symbol to your watchlist and to view watchlist. Quick View: Move mouse or cursor over "Daily" to quickly view daily technical stock chart and over "Weekly" to view weekly technical stock chart. | |||||

 | MSC Studio City International Holdings Limited |
| Sector: Services & Goods | |
| SubSector: Resorts & Casinos | |
| MarketCap: 1420.54 Millions | |
| Recent Price: 7.57 Smart Investing & Trading Score: 51 | |
| Day Percent Change: -10.94% Day Change: -0.93 | |
| Week Change: -10.94% Year-to-date Change: 16.8% | |
| MSC Links: Profile News Message Board | |
| Charts:- Daily , Weekly | |
| Add MSC to Watchlist: View: Get Complete MSC Trend Analysis ➞ | |
 | FANH Fanhua Inc. |
| Sector: Financials | |
| SubSector: Insurance Brokers | |
| MarketCap: 1436.67 Millions | |
| Recent Price: 3.70 Smart Investing & Trading Score: 0 | |
| Day Percent Change: -11.06% Day Change: -0.46 | |
| Week Change: -11.06% Year-to-date Change: -44.4% | |
| FANH Links: Profile News Message Board | |
| Charts:- Daily , Weekly | |
| Add FANH to Watchlist: View: Get Complete FANH Trend Analysis ➞ | |
 | YJ Yunji Inc. |
| Sector: Services & Goods | |
| SubSector: Specialty Retail, Other | |
| MarketCap: 770.644 Millions | |
| Recent Price: 0.77 Smart Investing & Trading Score: 45 | |
| Day Percent Change: -12.00% Day Change: -0.11 | |
| Week Change: -12% Year-to-date Change: 8.9% | |
| YJ Links: Profile News Message Board | |
| Charts:- Daily , Weekly | |
| Add YJ to Watchlist: View: Get Complete YJ Trend Analysis ➞ | |
 | WIMI WiMi Hologram Cloud Inc. |
| Sector: Technology | |
| SubSector: Advertising Agencies | |
| MarketCap: 41837 Millions | |
| Recent Price: 0.63 Smart Investing & Trading Score: 0 | |
| Day Percent Change: -13.19% Day Change: -0.10 | |
| Week Change: -13.19% Year-to-date Change: -21.4% | |
| WIMI Links: Profile News Message Board | |
| Charts:- Daily , Weekly | |
| Add WIMI to Watchlist: View: Get Complete WIMI Trend Analysis ➞ | |
 | ZCMD Zhongchao Inc. |
| Sector: Health Care | |
| SubSector: Health Information Services | |
| MarketCap: 41487 Millions | |
| Recent Price: 1.40 Smart Investing & Trading Score: 41 | |
| Day Percent Change: -14.63% Day Change: -0.24 | |
| Week Change: -14.63% Year-to-date Change: 283.5% | |
| ZCMD Links: Profile News Message Board | |
| Charts:- Daily , Weekly | |
| Add ZCMD to Watchlist: View: Get Complete ZCMD Trend Analysis ➞ | |
 | HOLO MicroCloud Hologram Inc. |
| Sector: Technology | |
| SubSector: Electronic Components | |
| MarketCap: 159 Millions | |
| Recent Price: 2.47 Smart Investing & Trading Score: 26 | |
| Day Percent Change: -15.12% Day Change: -0.44 | |
| Week Change: -15.12% Year-to-date Change: 610.8% | |
| HOLO Links: Profile News Message Board | |
| Charts:- Daily , Weekly | |
| Add HOLO to Watchlist: View: Get Complete HOLO Trend Analysis ➞ | |
 | GDHG Golden Heaven Group Holdings Ltd. |
| Sector: Services & Goods | |
| SubSector: Leisure | |
| MarketCap: 230 Millions | |
| Recent Price: 0.22 Smart Investing & Trading Score: 10 | |
| Day Percent Change: -24.95% Day Change: -0.07 | |
| Week Change: -24.95% Year-to-date Change: -69.3% | |
| GDHG Links: Profile News Message Board | |
| Charts:- Daily , Weekly | |
| Add GDHG to Watchlist: View: Get Complete GDHG Trend Analysis ➞ | |
| For tabular summary view of above stock list: Summary View ➞ 0 - 25 , 25 - 50 , 50 - 75 , 75 - 100 , 100 - 125 , 125 - 150 | ||
| Click To Change The Sort Order: By Market Cap or Company Size Performance: Year-to-date, Week and Day | |
| Select Chart Type: | ||
|
Best Stocks Today 12Stocks.com |
© 2024 12Stocks.com Terms & Conditions Privacy Contact Us
All Information Provided Only For Education And Not To Be Used For Investing or Trading. See Terms & Conditions


One More Thing ... Get Best Stocks Delivered Daily!
Never Ever Miss A Move With Our Top Ten Stocks Lists
Find Best Stocks In Any Market - Bull or Bear Market
Take A Peek At Our Top Ten Stocks Lists: Daily, Weekly, Year-to-Date & Top Trends
Find Best Stocks In Any Market - Bull or Bear Market
Take A Peek At Our Top Ten Stocks Lists: Daily, Weekly, Year-to-Date & Top Trends
China Stocks With Best Up Trends [0-bearish to 100-bullish]: Yatsen Holding[100], Cheetah Mobile[100], Niu [88], Trip.com [85], X Financial[83], DouYu [83], Shengfeng Development[76], GigaCloud [76], Hutchison China[76], Sohu.com [70], Burning Rock[69]
Best China Stocks Year-to-Date:
U Power[2578.57%], DouYu [720%], MicroCloud Hologram[610.79%], China Liberal[445.75%], Yatsen Holding[363.37%], Zhongchao [283.46%], Uxin [146.79%], Cheetah Mobile[112.72%], QuantaSing [100%], GigaCloud [77.33%], Yiren Digital[54.81%] Best China Stocks This Week:
Yatsen Holding[12.62%], Burning Rock[5.26%], Cheetah Mobile[5.21%], X Financial[5.01%], Shengfeng Development[4.44%], China Online[3.69%], Niu [3.64%], Lixiang Education[3.58%], DouYu [3.18%], Huazhu [2.96%], Momo [2.83%] Best China Stocks Daily:
Yatsen Holding[12.62%], Burning Rock[5.26%], Cheetah Mobile[5.21%], X Financial[5.01%], Shengfeng Development[4.44%], China Online[3.69%], Niu [3.64%], Lixiang Education[3.58%], DouYu [3.18%], Huazhu [2.96%], Momo [2.83%]