12Stocks.com
Market
Intelligence

Stock Charts, Performance & Trend Analysis for INDL
Double Bull India

INDL
Year-to-Date: 9.8%
This Week: 2.5%
INDL Stock Charts
See Daily ➞
See Weekly ➞
See Monthly ➞

INDL
Year-to-Date (YTD) Return: 9.77%
 
All about FANG Stocks ➞
Popular Trends!AAPL ➞ MSFT ➞ TSLA ➞
S&P 500 ➞ AMZN ➞ GOOGL ➞ FB ➞
Long Term Trend: Very Good
Medium Term Trend: Not Good
Short Term Trend: Very Good
Double Bull
Overall Trend Score:
80 Out Of 100
Bottomline: Neutral to Bullish Trend


Get YOUR Stock Review:

April 24, 2024 - The year-to-date (YTD) performance of Double Bull India (INDL) ETF is up 9.77% and is outperforming the overall stock market by 4.28%.

Recently, the weekly returns of Double Bull India (INDL) is up 2.48% and is outperforming the overall market by 0.44%.

New! 12Stocks.com introduces Big Monthly, Weekly & Daily Charts
View INDL Stock Charts      Daily    Weekly    Monthly

Although long term and short term trends for Double Bull India are good, the mid term i.e weekly trends are deteriorating.

The overall 12Stocks.com Smart Investing & Trading Score is 80 (measures stock trend from 0-bearish to 100-bullish) which puts INDL in short term neutral to bullish trend.

The Smart Investing & Trading Score from previous trading session is 93 and hence a deterioration of trend. Scroll down for key technical charts, support & resistance levels and analysis for Double Bull.

Stock Analysis for INDL
Name: Double Bull India
Sector:
SubSector:
In A Glance
INDL Technical Trend Chart View

Daily INDL Technical Chart
Add INDL To Watch List   View List
12Stocks.com
Short Term Trend Analysis for
80 / 100
The current technical trend score is 80 in a scale where 0 is bearish and 100 is bullish.
The technical trend score from previous session is 93.
Trend score updated daily. Not to be used for investing.
Recent Price: 62.35    
MarketCap: Millions
Day Percent Change: -0.21%
Day Change: -0.13
Week Change: 2.48%
Year-to-date Change: 9.77%

Technical Levels: For the trading inclined, the following are the key levels of resistance (ceiling) and support (floor) for INDL. Ceiling and floor levels are stock prices at which the stock trend gets resistance or support respectively and traders have an eye on them. Long term levels are more important. Stocks that have broken thru their resistance or supports convincingly tend to have stronger trends (confirm with charts above visually).
Key Levels for INDL
 Short TermWeeklyLong Term
Resistance (Ceiling)62.6162.0364.39
Support (Floor)61.9359.8358.2

The table below shows stocks similar to Double Bull India, i.e, from same subsector or sector along with year-to-date (YTD), weekly & daily performaces for comparison. Usually, stocks from similar sector tend to move together but companies that have innovative products, services or good management tend to outperform. Quick View: Move mouse or cursor over stock symbol (ticker) to view short-term technical chart and over stock name to view long term chart. Click on ticker or stock name for detailed view. Click on to add stock symbol to your watchlist and to view watchlist.
TickerStock NameWatchlistCategoryRecent PriceChange %Weekly Change%YTD Change%
BABAAlibaba Group Holding Limited Retail74.562.837.95-3.81%
TSMTaiwan Semiconductor Manufacturing Company Limited Semiconductor132.85-0.434.0327.74%
TMToyota Motor Corporation Auto232.590.951.6926.83%
DADADada Nexus Limited Services1.944.032.65-41.72%
KCKingsoft Cloud Holdings Limited Technology2.83-0.186-25.36%
OCFTOneConnect Financial Technology Co., Ltd. Technology1.80-1.64-4.76-42.86%
BEKEKE Holdings Inc. Financial13.56-0.377.19-16.35%
MNSOMINISO Group Holding Limited Services22.391.599.199.75%
JDJD.com, Inc. Tech Services28.212.4010.58-2.35%
APIAgora, Inc. Technology2.48-0.402.9-6.06%
WIMIWiMi Hologram Cloud Inc. Services0.9024.0729.0111.8%
PDDPinduoduo Inc. Retail127.26-0.5912.13-13.02%
YGMZMingZhu Logistics Holdings Limited Delivery0.424.18-9.77-10.26%
HMCHonda Motor Co., Ltd. Auto34.43-0.430.8511.39%
ZCMDZhongchao Inc. Healthcare1.66-3.50-11.5353.3%
TAKTakeda Pharmaceutical Company Limited Drugs13.26-0.930.11-7.11%
NTESNetEase, Inc. Tech Services94.111.120.651.03%
QHQuhuo Limited Technology0.610.00-2.94-58.38%
HUIZHuize Holding Limited Insurance0.630.402.11-30%
SMFGSumitomo Mitsui Financial Group, Inc. Banks11.37-0.351.7917.46%
INFYInfosys Limited Tech Services17.04-0.701.37-7.29%
EBONEbang International Holdings Inc. Technology8.040.75-2.43-47.36%
BIDUBaidu, Inc. Tech Services99.020.804.18-16.85%
LULufax Holding Ltd Credit4.503.103.3346.42%
BQBoqii Holding Limited Services0.262.12-4.16-42.52%
You can find complete coverage in the following
Related Pages: 2024 Best Performing Stocks, 2024 Best Performing ETF Funds

Technical Levels: For the trading inclined, the following are the key levels of resistance (ceiling) and support (floor) for INDL. Ceiling and floor levels are stock prices at which the stock trend gets resistance or support respectively. Stocks & their trends tend to pause at these levels and hence traders have an eye on them.

Long term levels are more important. Stocks that have broken thru their resistance or support levels convincingly tend to have stronger trends (confirm with charts above visually).
Key Technical Levels for INDL
 Short TermWeeklyLong Term
Resistance (Ceiling)62.6162.0364.39
Support (Floor)61.9359.8358.2

        
RELATIVE PERFORMANCE OF
Double Bull India
Vs
THE MARKET
Relative performance of Double Bull India
How is INDL faring versus the market [S&P 500] ? Is it lagging or leading ? How is its relative performance ?
Symbol Day Change Week Change Year-to-Date Change
VTI -0.14% 2.04% 5.49%
INDL -0.21% 2.48% 9.77%

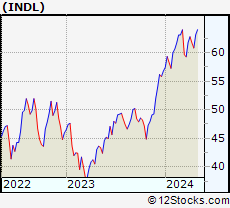
INDL Daily Chart

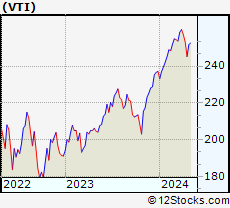
Total Market Daily Chart
Year to date returns, INDL is outperforming the market by 4.28%
This week, INDL is outperforming the market by 0.44%


List Of ETF Funds Similar To Double Bull India

The table below shows ETFs (Exchange Traded Funds) similar to Double Bull India, i.e, from same sector along with year-to-date (YTD), weekly & daily performaces for comparison. Usually, ETFs and associated stocks from similar sector tend to move together but companies that have innovative products, services or good management tend to outperform. Move mouse or cursor over ETF symbol to view short-term technical chart and over ETF name to view long term chart. Click on to add ETF symbol to your watchlist and to view watchlist.
TickerStock NameWatchlistCategoryRecent PriceChange %Weekly Change%YTD Change%
INDLDouble Bull India Pacific62.35-0.212.489.77%
URTYProShares UltraPro Russel2000 General40.92-2.256.15-11.75%
UWMProShares Ultra Russell 2000  General35.66-1.304.3-6.28%
UPWProShares Ultra Utilities  Utilities57.140.443.147.81%
USDProShares Ultra Semiconductors  Technology79.59-1.968.5546.25%
LTLUltra Telecom Technology60.902.152.6320.07%
ROMProShares Ultra Technology  Technology54.300.565.442.3%
UCCProShares Ultra Consumer Svcs  Services & Goods33.372.125.68-7.07%
UGEProShares Ultra Consumer Goods  Services & Goods17.030.002.428.19%
UYMProShares Ultra Basic Materials  Materials25.87-0.52-1.913.72%
UXIProShares Ultra Industrials  Industrials32.00-2.851.4311.13%
RXLProShares Ultra HealthCare  Health Care96.00-0.152.995.03%
DRNReal Estate 3X Shares Financials7.710.926.2-27.4%
FASFinancial Bull 3X Shares Financials102.83-0.70524.42%
UREProShares Real Estate  Financials51.870.333.52-18.47%
FXPUltraShort FTSE/Xinhua China 25 Pacific33.99-3.33-9.03-13.22%
EPIWisdom Tree India Earnings Fund  Pacific44.660.101.498.94%
FXIiShares China 25 Pacific25.211.6554.91%
EWTiShares Taiwan  Pacific46.450.301.620.91%
EWSiShares Singapore  Pacific18.86-0.243.60.88%
EWVUltraShort MSCI Japan Pacific11.06-0.63-2.38-9.38%
VPLVanguard Pacific Stock VIPERs Pacific72.580.021.620.77%
EWMiShares Malaysia  Pacific22.090.271.523.95%
EWYiShares South Korea  Pacific63.170.293.02-3.6%
JOFJapan Small Cap Fund Pacific7.650.081.270.74%
EWJiShares Japan  Pacific67.500.271.525.24%
PINPowerShares India Portfolio Pacific26.98-0.131.035.41%
IFNIndia Closed-End ETF Fund Pacific18.400.664.310.6%
EWHiShares Hong Kong  Pacific15.471.415.2-10.97%
EWAiShares Australia Pacific23.67-0.801.33-2.75%
Get the most comprehensive stock market coverage daily at 12Stocks.com ➞
Best Stocks Today ➞
Best Stocks Weekly ➞
Best Stocks Year-to-Date ➞
Best Stocks Trends ➞


Best Stocks Today
12Stocks.com


Best Nasdaq Stocks ➞
Best S&P 500 Stocks ➞
Best Tech Stocks ➞
Best Biotech Stocks ➞
 

© 2024 12Stocks.com       Terms & Conditions   Privacy   Contact Us
All Information Provided Only For Education And Not To Be Used For Investing or Trading. See Terms & Conditions

 WatchListmy12Stocks
Best Stocks Today