
 Login Sign Up


| |||||
 |  | ||||

| 12Stocks.com Market Intelligence |
Best Tech Stocks
| In a hurry? Tech Stocks Lists: Performance & Trends, Stock Charts, FANG Stocks
Sort Tech stocks: Daily, Weekly, Year-to-Date, Market Cap & Trends. Filter Tech stocks list by size:All Tech Large Mid-Range Small and MicroCap |
| 12Stocks.com Tech Stocks Performances & Trends Daily | |||||||||
|
|  The overall Smart Investing & Trading Score is 10 (0-bearish to 100-bullish) which puts Technology sector in short term bearish trend. The Smart Investing & Trading Score from previous trading session is 0 and hence an improvement of trend.
| ||||||||
Here are the Smart Investing & Trading Scores of the most requested Technology stocks at 12Stocks.com (click stock name for detailed review):
|


| 12Stocks.com: Investing in Technology sector with Stocks | |
|
The following table helps investors and traders sort through current performance and trends (as measured by Smart Investing & Trading Score) of various
stocks in the Tech sector. Quick View: Move mouse or cursor over stock symbol (ticker) to view short-term technical chart and over stock name to view long term chart. Click on  to add stock symbol to your watchlist and to add stock symbol to your watchlist and  to view watchlist. Click on any ticker or stock name for detailed market intelligence report for that stock. to view watchlist. Click on any ticker or stock name for detailed market intelligence report for that stock. |
12Stocks.com Performance of Stocks in Tech Sector
| Ticker | Stock Name | Watchlist | Category | Recent Price | Smart Investing & Trading Score | Change % | YTD Change% |
| DGII | Digi |   | Communication | 29.49 | 46 | 0.61 | 13.42% |
| IT | Gartner | | IT | 443.06 | 10 | 0.61 | -1.78% |
| YELP | Yelp | | Internet | 39.53 | 35 | 0.61 | -16.50% |
| DELL | Dell | | Personal Computers | 115.54 | 46 | 0.58 | 51.03% |
| INST | Instructure | | Software - | 19.18 | 20 | 0.58 | -28.99% |
| NTCT | NetScout Systems | | Software | 19.54 | 42 | 0.57 | -10.98% |
| DAO | Youdao | | Internet | 3.57 | 31 | 0.56 | -9.39% |
| IDT | IDT | | Communication | 36.88 | 71 | 0.55 | 8.18% |
| APPS | Digital Turbine | | Software | 1.86 | 30 | 0.54 | -72.89% |
| CHKP | Check Point | | Security Software | 158.79 | 38 | 0.53 | 3.93% |
| KE | Kimball Electronics | | Electronics | 20.89 | 49 | 0.53 | -22.49% |
| WDAY | Workday | | Software | 253.53 | 20 | 0.52 | -8.16% |
| TWOU | 2U | | Software | 0.25 | 15 | 0.52 | -79.73% |
| AAPL | Apple | | Electronic | 165.84 | 17 | 0.51 | -13.86% |
| RNG | RingCentral | | Software | 29.51 | 22 | 0.51 | -13.08% |
| VECO | Veeco | | Semiconductor | 32.74 | 26 | 0.49 | 5.51% |
| SPT | Sprout Social | | Software | 51.29 | 17 | 0.49 | -16.52% |
| FTCI | FTC Solar | | Solar | 0.39 | 20 | 0.49 | -43.10% |
| SMCI | Super Micro | | Networking | 717.02 | 26 | 0.47 | 152.24% |
| MSFT | Microsoft | | Software | 400.96 | 36 | 0.46 | 6.63% |
| FTNT | Fortinet | | Software | 63.69 | 20 | 0.46 | 8.82% |
| GLOB | Globant S.A | | IT | 180.10 | 20 | 0.45 | -24.32% |
| TENB | Tenable | | Software | 45.03 | 32 | 0.45 | -2.24% |
| PDFS | | Software | 29.69 | 0 | 0.44 | -7.62% | |
| BR | Broadridge Financial | | IT | 194.23 | 25 | 0.44 | -5.60% |
| For chart view version of above stock list: Chart View ➞ 0 - 25 , 25 - 50 , 50 - 75 , 75 - 100 , 100 - 125 , 125 - 150 , 150 - 175 , 175 - 200 , 200 - 225 , 225 - 250 , 250 - 275 , 275 - 300 , 300 - 325 , 325 - 350 , 350 - 375 , 375 - 400 , 400 - 425 , 425 - 450 , 450 - 475 , 475 - 500 , 500 - 525 , 525 - 550 , 550 - 575 , 575 - 600 , 600 - 625 , 625 - 650 | ||
 | Click To Change The Sort Order: By Market Cap or Company Size Performance: Year-to-date, Week and Day |  |
|
Get the most comprehensive stock market coverage daily at 12Stocks.com ➞ Best Stocks Today ➞ Best Stocks Weekly ➞ Best Stocks Year-to-Date ➞ Best Stocks Trends ➞  Best Stocks Today 12Stocks.com Best Nasdaq Stocks ➞ Best S&P 500 Stocks ➞ Best Tech Stocks ➞ Best Biotech Stocks ➞ |
| Detailed Overview of Tech Stocks |
| Tech Technical Overview, Leaders & Laggards, Top Tech ETF Funds & Detailed Tech Stocks List, Charts, Trends & More |
| Tech Sector: Technical Analysis, Trends & YTD Performance | |
| Technology sector is composed of stocks
from semiconductors, software, web, social media
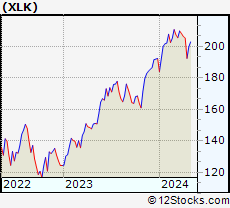
and services subsectors. Technology sector, as represented by XLK, an exchange-traded fund [ETF] that holds basket of tech stocks (e.g, Intel, Google) is up by 0.92% and is currently underperforming the overall market by -3.47% year-to-date. Below is a quick view of technical charts and trends: |
|
 XLK Weekly Chart |
|
| Long Term Trend: Not Good | |
| Medium Term Trend: Not Good | |
 XLK Daily Chart |
|
| Short Term Trend: Not Good | |
| Overall Trend Score: 10 | |
| YTD Performance: 0.92% | |
| **Trend Scores & Views Are Only For Educational Purposes And Not For Investing | |
| 12Stocks.com: Top Performing Technology Sector Stocks | ||||||||||||||||||||||||||||||||||||||||||||||||
 The top performing Technology sector stocks year to date are
Now, more recently, over last week, the top performing Technology sector stocks on the move are


|
||||||||||||||||||||||||||||||||||||||||||||||||
| 12Stocks.com: Investing in Tech Sector using Exchange Traded Funds | |
|
The following table shows list of key exchange traded funds (ETF) that
help investors track Tech Index. For detailed view, check out our ETF Funds section of our website. Quick View: Move mouse or cursor over ETF symbol (ticker) to view short-term technical chart and over ETF name to view long term chart. Click on ticker or stock name for detailed view. Click on to add stock symbol to your watchlist and to view watchlist. |
12Stocks.com List of ETFs that track Tech Index
| Ticker | ETF Name | Watchlist | Recent Price | Smart Investing & Trading Score | Change % | Week % | Year-to-date % |
| XLK | Technology | | 194.25 | 10 | 0.89 | 0.89 | 0.92% |
| QQQ | QQQ | | 414.32 | 13 | -0.08 | -0.08 | 1.17% |
| IYW | Technology | | 126.24 | 23 | 1.19 | 1.19 | 2.84% |
| VGT | Information Technology | | 486.46 | 10 | 1.37 | 1.37 | 0.51% |
| IXN | Global Tech | | 69.38 | 23 | 0.96 | 0.96 | 1.76% |
| IGV | Tech-Software | | 79.48 | 25 | 1.21 | 1.21 | -2.03% |
| XSD | Semiconductor | | 206.62 | 10 | 1.50 | 1.5 | -8.08% |
| TQQQ | QQQ | | 50.92 | 10 | 2.91 | 2.91 | 0.43% |
| SQQQ | Short QQQ | | 12.47 | 64 | -2.88 | -2.88 | -7.29% |
| SOXL | Semicondct Bull 3X | | 32.07 | 23 | 4.16 | 4.16 | 2.13% |
| SOXS | Semicondct Bear 3X | | 43.97 | 80 | -4.68 | -4.68 | 655.5% |
| SOXX | PHLX Semiconductor | | 201.66 | 36 | 1.65 | 1.65 | 5.01% |
| QTEC | First -100-Tech | | 176.36 | 10 | 1.39 | 1.39 | 0.51% |
| SMH | Semiconductor | | 203.02 | 36 | 1.91 | 1.91 | 16.1% |
| 12Stocks.com: Charts, Trends, Fundamental Data and Performances of Tech Stocks | |
|
We now take in-depth look at all Tech stocks including charts, multi-period performances and overall trends (as measured by Smart Investing & Trading Score). One can sort Tech stocks (click link to choose) by Daily, Weekly and by Year-to-Date performances. Also, one can sort by size of the company or by market capitalization. |
| Select Your Default Chart Type: | |||||
| |||||
| Click on stock symbol or name for detailed view. Click on to add stock symbol to your watchlist and to view watchlist. Quick View: Move mouse or cursor over "Daily" to quickly view daily technical stock chart and over "Weekly" to view weekly technical stock chart. | |||||


 | DGII Digi International Inc. |
| Sector: Technology | |
| SubSector: Communication Equipment | |
| MarketCap: 257.339 Millions | |
| Recent Price: 29.49 Smart Investing & Trading Score: 46 | |
| Day Percent Change: 0.61% Day Change: 0.18 | |
| Week Change: 0.61% Year-to-date Change: 13.4% | |
| DGII Links: Profile News Message Board | |
| Charts:- Daily , Weekly | |
| Add DGII to Watchlist: View: Get Complete DGII Trend Analysis ➞ | |
 | IT Gartner, Inc. |
| Sector: Technology | |
| SubSector: Information Technology Services | |
| MarketCap: 7767.98 Millions | |
| Recent Price: 443.06 Smart Investing & Trading Score: 10 | |
| Day Percent Change: 0.61% Day Change: 2.68 | |
| Week Change: 0.61% Year-to-date Change: -1.8% | |
| IT Links: Profile News Message Board | |
| Charts:- Daily , Weekly | |
| Add IT to Watchlist: View: Get Complete IT Trend Analysis ➞ | |
 | YELP Yelp Inc. |
| Sector: Technology | |
| SubSector: Internet Information Providers | |
| MarketCap: 1430.1 Millions | |
| Recent Price: 39.53 Smart Investing & Trading Score: 35 | |
| Day Percent Change: 0.61% Day Change: 0.24 | |
| Week Change: 0.61% Year-to-date Change: -16.5% | |
| YELP Links: Profile News Message Board | |
| Charts:- Daily , Weekly | |
| Add YELP to Watchlist: View: Get Complete YELP Trend Analysis ➞ | |
 | DELL Dell Technologies Inc. |
| Sector: Technology | |
| SubSector: Personal Computers | |
| MarketCap: 26750.6 Millions | |
| Recent Price: 115.54 Smart Investing & Trading Score: 46 | |
| Day Percent Change: 0.58% Day Change: 0.67 | |
| Week Change: 0.58% Year-to-date Change: 51.0% | |
| DELL Links: Profile News Message Board | |
| Charts:- Daily , Weekly | |
| Add DELL to Watchlist: View: Get Complete DELL Trend Analysis ➞ | |
 | INST Instructure Holdings, Inc. |
| Sector: Technology | |
| SubSector: Software - Application | |
| MarketCap: 3580 Millions | |
| Recent Price: 19.18 Smart Investing & Trading Score: 20 | |
| Day Percent Change: 0.58% Day Change: 0.11 | |
| Week Change: 0.58% Year-to-date Change: -29.0% | |
| INST Links: Profile News Message Board | |
| Charts:- Daily , Weekly | |
| Add INST to Watchlist: View: Get Complete INST Trend Analysis ➞ | |
 | NTCT NetScout Systems, Inc. |
| Sector: Technology | |
| SubSector: Business Software & Services | |
| MarketCap: 1657.28 Millions | |
| Recent Price: 19.54 Smart Investing & Trading Score: 42 | |
| Day Percent Change: 0.57% Day Change: 0.11 | |
| Week Change: 0.57% Year-to-date Change: -11.0% | |
| NTCT Links: Profile News Message Board | |
| Charts:- Daily , Weekly | |
| Add NTCT to Watchlist: View: Get Complete NTCT Trend Analysis ➞ | |
 | DAO Youdao, Inc. |
| Sector: Technology | |
| SubSector: Internet Information Providers | |
| MarketCap: 2073.2 Millions | |
| Recent Price: 3.57 Smart Investing & Trading Score: 31 | |
| Day Percent Change: 0.56% Day Change: 0.02 | |
| Week Change: 0.56% Year-to-date Change: -9.4% | |
| DAO Links: Profile News Message Board | |
| Charts:- Daily , Weekly | |
| Add DAO to Watchlist: View: Get Complete DAO Trend Analysis ➞ | |
 | IDT IDT Corporation |
| Sector: Technology | |
| SubSector: Diversified Communication Services | |
| MarketCap: 130.064 Millions | |
| Recent Price: 36.88 Smart Investing & Trading Score: 71 | |
| Day Percent Change: 0.55% Day Change: 0.20 | |
| Week Change: 0.55% Year-to-date Change: 8.2% | |
| IDT Links: Profile News Message Board | |
| Charts:- Daily , Weekly | |
| Add IDT to Watchlist: View: Get Complete IDT Trend Analysis ➞ | |
 | APPS Digital Turbine, Inc. |
| Sector: Technology | |
| SubSector: Application Software | |
| MarketCap: 437.262 Millions | |
| Recent Price: 1.86 Smart Investing & Trading Score: 30 | |
| Day Percent Change: 0.54% Day Change: 0.01 | |
| Week Change: 0.54% Year-to-date Change: -72.9% | |
| APPS Links: Profile News Message Board | |
| Charts:- Daily , Weekly | |
| Add APPS to Watchlist: View: Get Complete APPS Trend Analysis ➞ | |
 | CHKP Check Point Software Technologies Ltd. |
| Sector: Technology | |
| SubSector: Security Software & Services | |
| MarketCap: 15112.2 Millions | |
| Recent Price: 158.79 Smart Investing & Trading Score: 38 | |
| Day Percent Change: 0.53% Day Change: 0.84 | |
| Week Change: 0.53% Year-to-date Change: 3.9% | |
| CHKP Links: Profile News Message Board | |
| Charts:- Daily , Weekly | |
| Add CHKP to Watchlist: View: Get Complete CHKP Trend Analysis ➞ | |
 | KE Kimball Electronics, Inc. |
| Sector: Technology | |
| SubSector: Diversified Electronics | |
| MarketCap: 308.896 Millions | |
| Recent Price: 20.89 Smart Investing & Trading Score: 49 | |
| Day Percent Change: 0.53% Day Change: 0.11 | |
| Week Change: 0.53% Year-to-date Change: -22.5% | |
| KE Links: Profile News Message Board | |
| Charts:- Daily , Weekly | |
| Add KE to Watchlist: View: Get Complete KE Trend Analysis ➞ | |
 | WDAY Workday, Inc. |
| Sector: Technology | |
| SubSector: Application Software | |
| MarketCap: 31372.1 Millions | |
| Recent Price: 253.53 Smart Investing & Trading Score: 20 | |
| Day Percent Change: 0.52% Day Change: 1.31 | |
| Week Change: 0.52% Year-to-date Change: -8.2% | |
| WDAY Links: Profile News Message Board | |
| Charts:- Daily , Weekly | |
| Add WDAY to Watchlist: View: Get Complete WDAY Trend Analysis ➞ | |
 | TWOU 2U, Inc. |
| Sector: Technology | |
| SubSector: Application Software | |
| MarketCap: 1090.12 Millions | |
| Recent Price: 0.25 Smart Investing & Trading Score: 15 | |
| Day Percent Change: 0.52% Day Change: 0.00 | |
| Week Change: 0.52% Year-to-date Change: -79.7% | |
| TWOU Links: Profile News Message Board | |
| Charts:- Daily , Weekly | |
| Add TWOU to Watchlist: View: Get Complete TWOU Trend Analysis ➞ | |
 | AAPL Apple Inc. |
| Sector: Technology | |
| SubSector: Electronic Equipment | |
| MarketCap: 1112940 Millions | |
| Recent Price: 165.84 Smart Investing & Trading Score: 17 | |
| Day Percent Change: 0.51% Day Change: 0.84 | |
| Week Change: 0.51% Year-to-date Change: -13.9% | |
| AAPL Links: Profile News Message Board | |
| Charts:- Daily , Weekly | |
| Add AAPL to Watchlist: View: Get Complete AAPL Trend Analysis ➞ | |
 | RNG RingCentral, Inc. |
| Sector: Technology | |
| SubSector: Application Software | |
| MarketCap: 17755.3 Millions | |
| Recent Price: 29.51 Smart Investing & Trading Score: 22 | |
| Day Percent Change: 0.51% Day Change: 0.15 | |
| Week Change: 0.51% Year-to-date Change: -13.1% | |
| RNG Links: Profile News Message Board | |
| Charts:- Daily , Weekly | |
| Add RNG to Watchlist: View: Get Complete RNG Trend Analysis ➞ | |
 | VECO Veeco Instruments Inc. |
| Sector: Technology | |
| SubSector: Semiconductor Equipment & Materials | |
| MarketCap: 450.718 Millions | |
| Recent Price: 32.74 Smart Investing & Trading Score: 26 | |
| Day Percent Change: 0.49% Day Change: 0.16 | |
| Week Change: 0.49% Year-to-date Change: 5.5% | |
| VECO Links: Profile News Message Board | |
| Charts:- Daily , Weekly | |
| Add VECO to Watchlist: View: Get Complete VECO Trend Analysis ➞ | |
 | SPT Sprout Social, Inc. |
| Sector: Technology | |
| SubSector: Software Application | |
| MarketCap: 25087 Millions | |
| Recent Price: 51.29 Smart Investing & Trading Score: 17 | |
| Day Percent Change: 0.49% Day Change: 0.25 | |
| Week Change: 0.49% Year-to-date Change: -16.5% | |
| SPT Links: Profile News Message Board | |
| Charts:- Daily , Weekly | |
| Add SPT to Watchlist: View: Get Complete SPT Trend Analysis ➞ | |
 | FTCI FTC Solar, Inc. |
| Sector: Technology | |
| SubSector: Solar | |
| MarketCap: 345 Millions | |
| Recent Price: 0.39 Smart Investing & Trading Score: 20 | |
| Day Percent Change: 0.49% Day Change: 0.00 | |
| Week Change: 0.49% Year-to-date Change: -43.1% | |
| FTCI Links: Profile News Message Board | |
| Charts:- Daily , Weekly | |
| Add FTCI to Watchlist: View: Get Complete FTCI Trend Analysis ➞ | |
 | SMCI Super Micro Computer, Inc. |
| Sector: Technology | |
| SubSector: Networking & Communication Devices | |
| MarketCap: 1200.02 Millions | |
| Recent Price: 717.02 Smart Investing & Trading Score: 26 | |
| Day Percent Change: 0.47% Day Change: 3.37 | |
| Week Change: 0.47% Year-to-date Change: 152.2% | |
| SMCI Links: Profile News Message Board | |
| Charts:- Daily , Weekly | |
| Add SMCI to Watchlist: View: Get Complete SMCI Trend Analysis ➞ | |
 | MSFT Microsoft Corporation |
| Sector: Technology | |
| SubSector: Business Software & Services | |
| MarketCap: 1154150 Millions | |
| Recent Price: 400.96 Smart Investing & Trading Score: 36 | |
| Day Percent Change: 0.46% Day Change: 1.84 | |
| Week Change: 0.46% Year-to-date Change: 6.6% | |
| MSFT Links: Profile News Message Board | |
| Charts:- Daily , Weekly | |
| Add MSFT to Watchlist: View: Get Complete MSFT Trend Analysis ➞ | |
 | FTNT Fortinet, Inc. |
| Sector: Technology | |
| SubSector: Application Software | |
| MarketCap: 16993.8 Millions | |
| Recent Price: 63.69 Smart Investing & Trading Score: 20 | |
| Day Percent Change: 0.46% Day Change: 0.29 | |
| Week Change: 0.46% Year-to-date Change: 8.8% | |
| FTNT Links: Profile News Message Board | |
| Charts:- Daily , Weekly | |
| Add FTNT to Watchlist: View: Get Complete FTNT Trend Analysis ➞ | |
 | GLOB Globant S.A. |
| Sector: Technology | |
| SubSector: Information Technology Services | |
| MarketCap: 2976.88 Millions | |
| Recent Price: 180.10 Smart Investing & Trading Score: 20 | |
| Day Percent Change: 0.45% Day Change: 0.81 | |
| Week Change: 0.45% Year-to-date Change: -24.3% | |
| GLOB Links: Profile News Message Board | |
| Charts:- Daily , Weekly | |
| Add GLOB to Watchlist: View: Get Complete GLOB Trend Analysis ➞ | |
 | TENB Tenable Holdings, Inc. |
| Sector: Technology | |
| SubSector: Business Software & Services | |
| MarketCap: 1986.68 Millions | |
| Recent Price: 45.03 Smart Investing & Trading Score: 32 | |
| Day Percent Change: 0.45% Day Change: 0.20 | |
| Week Change: 0.45% Year-to-date Change: -2.2% | |
| TENB Links: Profile News Message Board | |
| Charts:- Daily , Weekly | |
| Add TENB to Watchlist: View: Get Complete TENB Trend Analysis ➞ | |
 | PDFS PDF Solutions, Inc. |
| Sector: Technology | |
| SubSector: Technical & System Software | |
| MarketCap: 345.1 Millions | |
| Recent Price: 29.69 Smart Investing & Trading Score: 0 | |
| Day Percent Change: 0.44% Day Change: 0.13 | |
| Week Change: 0.44% Year-to-date Change: -7.6% | |
| PDFS Links: Profile News Message Board | |
| Charts:- Daily , Weekly | |
| Add PDFS to Watchlist: View: Get Complete PDFS Trend Analysis ➞ | |
 | BR Broadridge Financial Solutions, Inc. |
| Sector: Technology | |
| SubSector: Information Technology Services | |
| MarketCap: 10633.8 Millions | |
| Recent Price: 194.23 Smart Investing & Trading Score: 25 | |
| Day Percent Change: 0.44% Day Change: 0.85 | |
| Week Change: 0.44% Year-to-date Change: -5.6% | |
| BR Links: Profile News Message Board | |
| Charts:- Daily , Weekly | |
| Add BR to Watchlist: View: Get Complete BR Trend Analysis ➞ | |
| For tabular summary view of above stock list: Summary View ➞ 0 - 25 , 25 - 50 , 50 - 75 , 75 - 100 , 100 - 125 , 125 - 150 , 150 - 175 , 175 - 200 , 200 - 225 , 225 - 250 , 250 - 275 , 275 - 300 , 300 - 325 , 325 - 350 , 350 - 375 , 375 - 400 , 400 - 425 , 425 - 450 , 450 - 475 , 475 - 500 , 500 - 525 , 525 - 550 , 550 - 575 , 575 - 600 , 600 - 625 , 625 - 650 | ||
| Click To Change The Sort Order: By Market Cap or Company Size Performance: Year-to-date, Week and Day | |
| Select Chart Type: | ||
|
Best Stocks Today 12Stocks.com |
© 2024 12Stocks.com Terms & Conditions Privacy Contact Us
All Information Provided Only For Education And Not To Be Used For Investing or Trading. See Terms & Conditions


One More Thing ... Get Best Stocks Delivered Daily!
Never Ever Miss A Move With Our Top Ten Stocks Lists
Find Best Stocks In Any Market - Bull or Bear Market
Take A Peek At Our Top Ten Stocks Lists: Daily, Weekly, Year-to-Date & Top Trends
Find Best Stocks In Any Market - Bull or Bear Market
Take A Peek At Our Top Ten Stocks Lists: Daily, Weekly, Year-to-Date & Top Trends
Technology Stocks With Best Up Trends [0-bearish to 100-bullish]: Matterport [100], Bilibili [100], JD.com [100], Nokia [100], Zuora [100], EchoStar [100], Jamf Holding[100], NextNav [100], Badger Meter[100], Bentley Systems[100], Telefonica S.A[100]
Best Technology Stocks Year-to-Date:
Pagaya [557.66%], MediaCo Holding[327.23%], CXApp [179.54%], Smith Micro[160.29%], Super Micro[152.24%], Uxin [116.83%], MicroStrategy [109.62%], GigaCloud [102.57%], NextNav [88.76%], CuriosityStream [87%], Matterport [77.78%] Best Technology Stocks This Week:
Matterport [175.86%], MicroStrategy [12.77%], So-Young [12.45%], CommScope Holding[10.52%], Bitdeer [10.47%], Akoustis [9.78%], Aerohive Networks[8.49%], Sea [7.94%], Bilibili [7.61%], BigBear.ai [7.59%], Tigo Energy[7.53%] Best Technology Stocks Daily:
Matterport [175.86%], MicroStrategy [12.77%], So-Young [12.45%], CommScope Holding[10.52%], Bitdeer [10.47%], Akoustis [9.78%], Aerohive Networks[8.49%], Sea [7.94%], Bilibili [7.61%], BigBear.ai [7.59%], Tigo Energy[7.53%]