
 Login Sign Up


| |||||
 |  | ||||

| 12Stocks.com Market Intelligence |
Best Tech Stocks
| In a hurry? Tech Stocks Lists: Performance & Trends, Stock Charts, FANG Stocks
Sort Tech stocks: Daily, Weekly, Year-to-Date, Market Cap & Trends. Filter Tech stocks list by size:All Tech Large Mid-Range Small and MicroCap |
| 12Stocks.com Tech Stocks Performances & Trends Daily | |||||||||
|
|  The overall Smart Investing & Trading Score is 45 (0-bearish to 100-bullish) which puts Technology sector in short term neutral trend. The Smart Investing & Trading Score from previous trading session is 38 and hence an improvement of trend.
| ||||||||
Here are the Smart Investing & Trading Scores of the most requested Technology stocks at 12Stocks.com (click stock name for detailed review):
|


| 12Stocks.com: Investing in Technology sector with Stocks | |
|
The following table helps investors and traders sort through current performance and trends (as measured by Smart Investing & Trading Score) of various
stocks in the Tech sector. Quick View: Move mouse or cursor over stock symbol (ticker) to view short-term technical chart and over stock name to view long term chart. Click on  to add stock symbol to your watchlist and to add stock symbol to your watchlist and  to view watchlist. Click on any ticker or stock name for detailed market intelligence report for that stock. to view watchlist. Click on any ticker or stock name for detailed market intelligence report for that stock. |
12Stocks.com Performance of Stocks in Tech Sector
| Ticker | Stock Name | Watchlist | Category | Recent Price | Smart Investing & Trading Score | Change % | YTD Change% |
| AMST | Amesite |   | Software | 3.31 | 100 | 65.50 | 43.91% |
| WIMI | WiMi Hologram | | Advertising Agencies | 1.15 | 95 | 58.53 | 42.86% |
| RBBN | Ribbon | | Telecom | 3.25 | 100 | 26.46 | 12.07% |
| ICG | Intchains | | Semiconductors | 9.99 | 52 | 22.28 | -18.78% |
| UXIN | Uxin | | Internet | 1.89 | 39 | 13.86 | 169.61% |
| BILI | Bilibili | | Internet | 12.75 | 80 | 10.97 | 4.77% |
| CMTL | Comtech Tele | | Communication | 1.75 | 27 | 10.76 | -79.24% |
| MINDP | Mitcham Industries | | Instruments | 8.90 | 50 | 9.88 | -15.08% |
| NVTS | Navitas Semiconductor | | Semiconductors | 4.13 | 42 | 8.83 | -49.17% |
| FTCI | FTC Solar | | Solar | 0.46 | 47 | 8.51 | -34.00% |
| HKD | AMTD Digital | | Software - | 3.38 | 59 | 8.33 | -18.16% |
| ALGM | Allegro MicroSystems | | Semiconductors | 28.76 | 100 | 8.24 | -5.05% |
| HCAT | Health Catalyst | | Healthcare Information | 6.03 | 27 | 7.68 | -34.88% |
| GDS | GDS | | Data Storage | 7.26 | 85 | 7.24 | -20.39% |
| VNET | 21Vianet | | IT | 1.58 | 42 | 6.76 | -44.95% |
| ON | ON Semiconductor | | Semiconductor | 65.53 | 42 | 6.24 | -21.55% |
| COMM | CommScope Holding | | Communication | 1.06 | 59 | 6.19 | -62.41% |
| TXN | Texas | | Semiconductor | 174.81 | 100 | 5.64 | 2.55% |
| VCSA | Vacasa | | Software - | 6.77 | 64 | 5.45 | -17.44% |
| PERI | Perion Network | | Software | 11.85 | 32 | 5.43 | -61.61% |
| STM | STMicroelectronics N.V | | Semiconductor | 42.14 | 57 | 5.40 | -15.94% |
| LSCC | Lattice Semiconductor | | Semiconductor | 71.58 | 68 | 5.31 | 3.75% |
| IQ | iQIYI | | Internet | 4.82 | 85 | 5.24 | -1.23% |
| MCHP | Microchip | | Semiconductor | 90.68 | 100 | 5.21 | 0.55% |
| AOSL | Alpha and | | Semiconductor | 21.21 | 52 | 5.10 | -18.61% |
| For chart view version of above stock list: Chart View ➞ 0 - 25 , 25 - 50 , 50 - 75 , 75 - 100 , 100 - 125 , 125 - 150 , 150 - 175 , 175 - 200 , 200 - 225 , 225 - 250 , 250 - 275 , 275 - 300 , 300 - 325 , 325 - 350 , 350 - 375 , 375 - 400 , 400 - 425 , 425 - 450 , 450 - 475 , 475 - 500 , 500 - 525 , 525 - 550 , 550 - 575 , 575 - 600 , 600 - 625 , 625 - 650 | ||
 | Click To Change The Sort Order: By Market Cap or Company Size Performance: Year-to-date, Week and Day |  |
|
Get the most comprehensive stock market coverage daily at 12Stocks.com ➞ Best Stocks Today ➞ Best Stocks Weekly ➞ Best Stocks Year-to-Date ➞ Best Stocks Trends ➞  Best Stocks Today 12Stocks.com Best Nasdaq Stocks ➞ Best S&P 500 Stocks ➞ Best Tech Stocks ➞ Best Biotech Stocks ➞ |
| Detailed Overview of Tech Stocks |
| Tech Technical Overview, Leaders & Laggards, Top Tech ETF Funds & Detailed Tech Stocks List, Charts, Trends & More |
| Tech Sector: Technical Analysis, Trends & YTD Performance | |
| Technology sector is composed of stocks
from semiconductors, software, web, social media
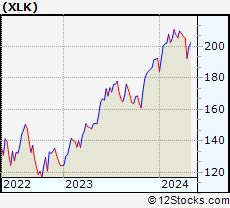
and services subsectors. Technology sector, as represented by XLK, an exchange-traded fund [ETF] that holds basket of tech stocks (e.g, Intel, Google) is up by 2.88% and is currently underperforming the overall market by -2.78% year-to-date. Below is a quick view of technical charts and trends: |
|
 XLK Weekly Chart |
|
| Long Term Trend: Good | |
| Medium Term Trend: Not Good | |
 XLK Daily Chart |
|
| Short Term Trend: Very Good | |
| Overall Trend Score: 45 | |
| YTD Performance: 2.88% | |
| **Trend Scores & Views Are Only For Educational Purposes And Not For Investing | |
| 12Stocks.com: Top Performing Technology Sector Stocks | ||||||||||||||||||||||||||||||||||||||||||||||||
 The top performing Technology sector stocks year to date are
Now, more recently, over last week, the top performing Technology sector stocks on the move are


|
||||||||||||||||||||||||||||||||||||||||||||||||
| 12Stocks.com: Investing in Tech Sector using Exchange Traded Funds | |
|
The following table shows list of key exchange traded funds (ETF) that
help investors track Tech Index. For detailed view, check out our ETF Funds section of our website. Quick View: Move mouse or cursor over ETF symbol (ticker) to view short-term technical chart and over ETF name to view long term chart. Click on ticker or stock name for detailed view. Click on to add stock symbol to your watchlist and to view watchlist. |
12Stocks.com List of ETFs that track Tech Index
| Ticker | ETF Name | Watchlist | Recent Price | Smart Investing & Trading Score | Change % | Week % | Year-to-date % |
| XLK | Technology | | 198.03 | 45 | 0.46 | 2.86 | 2.88% |
| QQQ | QQQ | | 426.51 | 58 | 0.34 | 2.86 | 4.15% |
| IYW | Technology | | 128.84 | 58 | 0.25 | 3.28 | 4.96% |
| VGT | Information Technology | | 495.24 | 45 | 0.16 | 3.2 | 2.32% |
| IXN | Global Tech | | 70.84 | 43 | 0.47 | 3.08 | 3.9% |
| IGV | Tech-Software | | 80.94 | 32 | 0.10 | 3.07 | -0.23% |
| XSD | Semiconductor | | 215.54 | 30 | 2.30 | 5.89 | -4.11% |
| TQQQ | QQQ | | 53.71 | 58 | 0.98 | 8.55 | 5.94% |
| SQQQ | Short QQQ | | 11.81 | 37 | -0.84 | -8.02 | -12.19% |
| SOXL | Semicondct Bull 3X | | 35.49 | 58 | 4.05 | 15.26 | 13.03% |
| SOXS | Semicondct Bear 3X | | 39.61 | 58 | -3.81 | -14.13 | 580.58% |
| SOXX | PHLX Semiconductor | | 208.54 | 58 | 1.30 | 5.12 | 8.6% |
| QTEC | First -100-Tech | | 181.14 | 58 | 0.69 | 4.14 | 3.23% |
| SMH | Semiconductor | | 208.04 | 58 | 0.12 | 4.43 | 18.97% |
| 12Stocks.com: Charts, Trends, Fundamental Data and Performances of Tech Stocks | |
|
We now take in-depth look at all Tech stocks including charts, multi-period performances and overall trends (as measured by Smart Investing & Trading Score). One can sort Tech stocks (click link to choose) by Daily, Weekly and by Year-to-Date performances. Also, one can sort by size of the company or by market capitalization. |
| Select Your Default Chart Type: | |||||
| |||||
| Click on stock symbol or name for detailed view. Click on to add stock symbol to your watchlist and to view watchlist. Quick View: Move mouse or cursor over "Daily" to quickly view daily technical stock chart and over "Weekly" to view weekly technical stock chart. | |||||


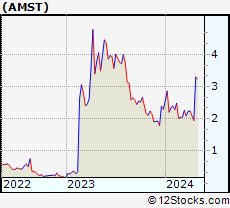 | AMST Amesite Inc. |
| Sector: Technology | |
| SubSector: Software Application | |
| MarketCap: 96787 Millions | |
| Recent Price: 3.31 Smart Investing & Trading Score: 100 | |
| Day Percent Change: 65.50% Day Change: 1.31 | |
| Week Change: 69.72% Year-to-date Change: 43.9% | |
| AMST Links: Profile News Message Board | |
| Charts:- Daily , Weekly | |
| Add AMST to Watchlist: View: Get Complete AMST Trend Analysis ➞ | |
 | WIMI WiMi Hologram Cloud Inc. |
| Sector: Technology | |
| SubSector: Advertising Agencies | |
| MarketCap: 41837 Millions | |
| Recent Price: 1.15 Smart Investing & Trading Score: 95 | |
| Day Percent Change: 58.53% Day Change: 0.42 | |
| Week Change: 64.85% Year-to-date Change: 42.9% | |
| WIMI Links: Profile News Message Board | |
| Charts:- Daily , Weekly | |
| Add WIMI to Watchlist: View: Get Complete WIMI Trend Analysis ➞ | |
 | RBBN Ribbon Communications Inc. |
| Sector: Technology | |
| SubSector: Telecom Services - Domestic | |
| MarketCap: 284.577 Millions | |
| Recent Price: 3.25 Smart Investing & Trading Score: 100 | |
| Day Percent Change: 26.46% Day Change: 0.68 | |
| Week Change: 25.97% Year-to-date Change: 12.1% | |
| RBBN Links: Profile News Message Board | |
| Charts:- Daily , Weekly | |
| Add RBBN to Watchlist: View: Get Complete RBBN Trend Analysis ➞ | |
 | ICG Intchains Group Limited |
| Sector: Technology | |
| SubSector: Semiconductors | |
| MarketCap: 450 Millions | |
| Recent Price: 9.99 Smart Investing & Trading Score: 52 | |
| Day Percent Change: 22.28% Day Change: 1.82 | |
| Week Change: 20.36% Year-to-date Change: -18.8% | |
| ICG Links: Profile News Message Board | |
| Charts:- Daily , Weekly | |
| Add ICG to Watchlist: View: Get Complete ICG Trend Analysis ➞ | |
 | UXIN Uxin Limited |
| Sector: Technology | |
| SubSector: Internet Information Providers | |
| MarketCap: 414.58 Millions | |
| Recent Price: 1.89 Smart Investing & Trading Score: 39 | |
| Day Percent Change: 13.86% Day Change: 0.23 | |
| Week Change: 11.83% Year-to-date Change: 169.6% | |
| UXIN Links: Profile News Message Board | |
| Charts:- Daily , Weekly | |
| Add UXIN to Watchlist: View: Get Complete UXIN Trend Analysis ➞ | |
 | BILI Bilibili Inc. |
| Sector: Technology | |
| SubSector: Internet Information Providers | |
| MarketCap: 7043.1 Millions | |
| Recent Price: 12.75 Smart Investing & Trading Score: 80 | |
| Day Percent Change: 10.97% Day Change: 1.26 | |
| Week Change: 16.87% Year-to-date Change: 4.8% | |
| BILI Links: Profile News Message Board | |
| Charts:- Daily , Weekly | |
| Add BILI to Watchlist: View: Get Complete BILI Trend Analysis ➞ | |
 | CMTL Comtech Telecommunications Corp. |
| Sector: Technology | |
| SubSector: Communication Equipment | |
| MarketCap: 399.539 Millions | |
| Recent Price: 1.75 Smart Investing & Trading Score: 27 | |
| Day Percent Change: 10.76% Day Change: 0.17 | |
| Week Change: -5.41% Year-to-date Change: -79.2% | |
| CMTL Links: Profile News Message Board | |
| Charts:- Daily , Weekly | |
| Add CMTL to Watchlist: View: Get Complete CMTL Trend Analysis ➞ | |
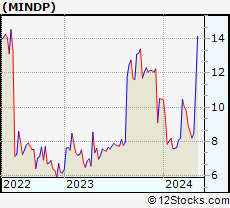 | MINDP Mitcham Industries, Inc. |
| Sector: Technology | |
| SubSector: Scientific & Technical Instruments | |
| MarketCap: 152.453 Millions | |
| Recent Price: 8.90 Smart Investing & Trading Score: 50 | |
| Day Percent Change: 9.88% Day Change: 0.80 | |
| Week Change: 8.41% Year-to-date Change: -15.1% | |
| MINDP Links: Profile News Message Board | |
| Charts:- Daily , Weekly | |
| Add MINDP to Watchlist: View: Get Complete MINDP Trend Analysis ➞ | |
 | NVTS Navitas Semiconductor Corporation |
| Sector: Technology | |
| SubSector: Semiconductors | |
| MarketCap: 1790 Millions | |
| Recent Price: 4.13 Smart Investing & Trading Score: 42 | |
| Day Percent Change: 8.83% Day Change: 0.33 | |
| Week Change: 13.46% Year-to-date Change: -49.2% | |
| NVTS Links: Profile News Message Board | |
| Charts:- Daily , Weekly | |
| Add NVTS to Watchlist: View: Get Complete NVTS Trend Analysis ➞ | |
 | FTCI FTC Solar, Inc. |
| Sector: Technology | |
| SubSector: Solar | |
| MarketCap: 345 Millions | |
| Recent Price: 0.46 Smart Investing & Trading Score: 47 | |
| Day Percent Change: 8.51% Day Change: 0.04 | |
| Week Change: 16.56% Year-to-date Change: -34.0% | |
| FTCI Links: Profile News Message Board | |
| Charts:- Daily , Weekly | |
| Add FTCI to Watchlist: View: Get Complete FTCI Trend Analysis ➞ | |
 | HKD AMTD Digital Inc. |
| Sector: Technology | |
| SubSector: Software - Application | |
| MarketCap: 1200 Millions | |
| Recent Price: 3.38 Smart Investing & Trading Score: 59 | |
| Day Percent Change: 8.33% Day Change: 0.26 | |
| Week Change: 9.74% Year-to-date Change: -18.2% | |
| HKD Links: Profile News Message Board | |
| Charts:- Daily , Weekly | |
| Add HKD to Watchlist: View: Get Complete HKD Trend Analysis ➞ | |
 | ALGM Allegro MicroSystems, Inc. |
| Sector: Technology | |
| SubSector: Semiconductors | |
| MarketCap: 50287 Millions | |
| Recent Price: 28.76 Smart Investing & Trading Score: 100 | |
| Day Percent Change: 8.24% Day Change: 2.19 | |
| Week Change: 8.61% Year-to-date Change: -5.1% | |
| ALGM Links: Profile News Message Board | |
| Charts:- Daily , Weekly | |
| Add ALGM to Watchlist: View: Get Complete ALGM Trend Analysis ➞ | |
 | HCAT Health Catalyst, Inc. |
| Sector: Technology | |
| SubSector: Healthcare Information Services | |
| MarketCap: 983.955 Millions | |
| Recent Price: 6.03 Smart Investing & Trading Score: 27 | |
| Day Percent Change: 7.68% Day Change: 0.43 | |
| Week Change: 8.06% Year-to-date Change: -34.9% | |
| HCAT Links: Profile News Message Board | |
| Charts:- Daily , Weekly | |
| Add HCAT to Watchlist: View: Get Complete HCAT Trend Analysis ➞ | |
 | GDS GDS Holdings Limited |
| Sector: Technology | |
| SubSector: Data Storage Devices | |
| MarketCap: 8597.99 Millions | |
| Recent Price: 7.26 Smart Investing & Trading Score: 85 | |
| Day Percent Change: 7.24% Day Change: 0.49 | |
| Week Change: 14.87% Year-to-date Change: -20.4% | |
| GDS Links: Profile News Message Board | |
| Charts:- Daily , Weekly | |
| Add GDS to Watchlist: View: Get Complete GDS Trend Analysis ➞ | |
 | VNET 21Vianet Group, Inc. |
| Sector: Technology | |
| SubSector: Information Technology Services | |
| MarketCap: 1846.98 Millions | |
| Recent Price: 1.58 Smart Investing & Trading Score: 42 | |
| Day Percent Change: 6.76% Day Change: 0.10 | |
| Week Change: 6.04% Year-to-date Change: -45.0% | |
| VNET Links: Profile News Message Board | |
| Charts:- Daily , Weekly | |
| Add VNET to Watchlist: View: Get Complete VNET Trend Analysis ➞ | |
 | ON ON Semiconductor Corporation |
| Sector: Technology | |
| SubSector: Semiconductor - Broad Line | |
| MarketCap: 5183.82 Millions | |
| Recent Price: 65.53 Smart Investing & Trading Score: 42 | |
| Day Percent Change: 6.24% Day Change: 3.85 | |
| Week Change: 7.94% Year-to-date Change: -21.6% | |
| ON Links: Profile News Message Board | |
| Charts:- Daily , Weekly | |
| Add ON to Watchlist: View: Get Complete ON Trend Analysis ➞ | |
 | COMM CommScope Holding Company, Inc. |
| Sector: Technology | |
| SubSector: Communication Equipment | |
| MarketCap: 1614.29 Millions | |
| Recent Price: 1.06 Smart Investing & Trading Score: 59 | |
| Day Percent Change: 6.19% Day Change: 0.06 | |
| Week Change: 14.86% Year-to-date Change: -62.4% | |
| COMM Links: Profile News Message Board | |
| Charts:- Daily , Weekly | |
| Add COMM to Watchlist: View: Get Complete COMM Trend Analysis ➞ | |
 | TXN Texas Instruments Incorporated |
| Sector: Technology | |
| SubSector: Semiconductor - Broad Line | |
| MarketCap: 99509.1 Millions | |
| Recent Price: 174.81 Smart Investing & Trading Score: 100 | |
| Day Percent Change: 5.64% Day Change: 9.34 | |
| Week Change: 9.48% Year-to-date Change: 2.6% | |
| TXN Links: Profile News Message Board | |
| Charts:- Daily , Weekly | |
| Add TXN to Watchlist: View: Get Complete TXN Trend Analysis ➞ | |
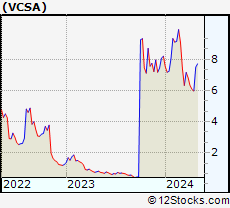 | VCSA Vacasa, Inc. |
| Sector: Technology | |
| SubSector: Software - Application | |
| MarketCap: 285 Millions | |
| Recent Price: 6.77 Smart Investing & Trading Score: 64 | |
| Day Percent Change: 5.45% Day Change: 0.35 | |
| Week Change: 13.4% Year-to-date Change: -17.4% | |
| VCSA Links: Profile News Message Board | |
| Charts:- Daily , Weekly | |
| Add VCSA to Watchlist: View: Get Complete VCSA Trend Analysis ➞ | |
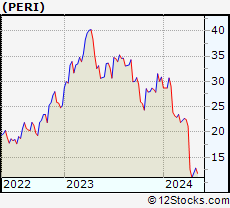 | PERI Perion Network Ltd. |
| Sector: Technology | |
| SubSector: Business Software & Services | |
| MarketCap: 127.058 Millions | |
| Recent Price: 11.85 Smart Investing & Trading Score: 32 | |
| Day Percent Change: 5.43% Day Change: 0.61 | |
| Week Change: 7.92% Year-to-date Change: -61.6% | |
| PERI Links: Profile News Message Board | |
| Charts:- Daily , Weekly | |
| Add PERI to Watchlist: View: Get Complete PERI Trend Analysis ➞ | |
 | STM STMicroelectronics N.V. |
| Sector: Technology | |
| SubSector: Semiconductor - Broad Line | |
| MarketCap: 17878.6 Millions | |
| Recent Price: 42.14 Smart Investing & Trading Score: 57 | |
| Day Percent Change: 5.40% Day Change: 2.16 | |
| Week Change: 9.17% Year-to-date Change: -15.9% | |
| STM Links: Profile News Message Board | |
| Charts:- Daily , Weekly | |
| Add STM to Watchlist: View: Get Complete STM Trend Analysis ➞ | |
 | LSCC Lattice Semiconductor Corporation |
| Sector: Technology | |
| SubSector: Semiconductor - Specialized | |
| MarketCap: 2104 Millions | |
| Recent Price: 71.58 Smart Investing & Trading Score: 68 | |
| Day Percent Change: 5.31% Day Change: 3.61 | |
| Week Change: 7.62% Year-to-date Change: 3.8% | |
| LSCC Links: Profile News Message Board | |
| Charts:- Daily , Weekly | |
| Add LSCC to Watchlist: View: Get Complete LSCC Trend Analysis ➞ | |
 | IQ iQIYI, Inc. |
| Sector: Technology | |
| SubSector: Internet Information Providers | |
| MarketCap: 13591.5 Millions | |
| Recent Price: 4.82 Smart Investing & Trading Score: 85 | |
| Day Percent Change: 5.24% Day Change: 0.24 | |
| Week Change: 17.99% Year-to-date Change: -1.2% | |
| IQ Links: Profile News Message Board | |
| Charts:- Daily , Weekly | |
| Add IQ to Watchlist: View: Get Complete IQ Trend Analysis ➞ | |
 | MCHP Microchip Technology Incorporated |
| Sector: Technology | |
| SubSector: Semiconductor - Broad Line | |
| MarketCap: 16826.3 Millions | |
| Recent Price: 90.68 Smart Investing & Trading Score: 100 | |
| Day Percent Change: 5.21% Day Change: 4.49 | |
| Week Change: 11.02% Year-to-date Change: 0.6% | |
| MCHP Links: Profile News Message Board | |
| Charts:- Daily , Weekly | |
| Add MCHP to Watchlist: View: Get Complete MCHP Trend Analysis ➞ | |
 | AOSL Alpha and Omega Semiconductor Limited |
| Sector: Technology | |
| SubSector: Semiconductor - Specialized | |
| MarketCap: 158.66 Millions | |
| Recent Price: 21.21 Smart Investing & Trading Score: 52 | |
| Day Percent Change: 5.10% Day Change: 1.03 | |
| Week Change: 8.49% Year-to-date Change: -18.6% | |
| AOSL Links: Profile News Message Board | |
| Charts:- Daily , Weekly | |
| Add AOSL to Watchlist: View: Get Complete AOSL Trend Analysis ➞ | |
| For tabular summary view of above stock list: Summary View ➞ 0 - 25 , 25 - 50 , 50 - 75 , 75 - 100 , 100 - 125 , 125 - 150 , 150 - 175 , 175 - 200 , 200 - 225 , 225 - 250 , 250 - 275 , 275 - 300 , 300 - 325 , 325 - 350 , 350 - 375 , 375 - 400 , 400 - 425 , 425 - 450 , 450 - 475 , 475 - 500 , 500 - 525 , 525 - 550 , 550 - 575 , 575 - 600 , 600 - 625 , 625 - 650 | ||
| Click To Change The Sort Order: By Market Cap or Company Size Performance: Year-to-date, Week and Day | |
| Select Chart Type: | ||
|
Best Stocks Today 12Stocks.com |
© 2024 12Stocks.com Terms & Conditions Privacy Contact Us
All Information Provided Only For Education And Not To Be Used For Investing or Trading. See Terms & Conditions


One More Thing ... Get Best Stocks Delivered Daily!
Never Ever Miss A Move With Our Top Ten Stocks Lists
Find Best Stocks In Any Market - Bull or Bear Market
Take A Peek At Our Top Ten Stocks Lists: Daily, Weekly, Year-to-Date & Top Trends
Find Best Stocks In Any Market - Bull or Bear Market
Take A Peek At Our Top Ten Stocks Lists: Daily, Weekly, Year-to-Date & Top Trends
Technology Stocks With Best Up Trends [0-bearish to 100-bullish]: Amesite [100], Ribbon [100], Allegro MicroSystems[100], Texas [100], Microchip [100], EchoStar [100], Analog Devices[100], Vishay Inter[100], JD.com [100], Sea [100], Jamf Holding[100]
Best Technology Stocks Year-to-Date:
Pagaya [581.02%], MicroCloud Hologram[574.82%], MediaCo Holding[364.79%], Uxin [169.61%], CXApp [167.95%], Super Micro[165.5%], Smith Micro[162.71%], SoundHound AI[103.27%], MicroStrategy [100.38%], GigaCloud [96.01%], NextNav [95.73%] Best Technology Stocks This Week:
Matterport [166.09%], Amesite [69.72%], WiMi Hologram[64.85%], Ribbon [25.97%], HashiCorp [23.7%], SoundHound AI[22.54%], Intchains [20.36%], iQIYI [17.99%], Bilibili [16.87%], FTC Solar[16.56%], BigBear.ai [16.55%] Best Technology Stocks Daily:
Amesite [65.50%], WiMi Hologram[58.53%], Ribbon [26.46%], Intchains [22.28%], Uxin [13.86%], Bilibili [10.97%], Comtech Tele[10.76%], Mitcham Industries[9.88%], Navitas Semiconductor[8.83%], FTC Solar[8.51%], AMTD Digital[8.33%]