
 Login Sign Up


| |||||
 |  | ||||

| 12Stocks.com Market Intelligence |
Best Tech Stocks
| In a hurry? Tech Stocks Lists: Performance & Trends, Stock Charts, FANG Stocks
Sort Tech stocks: Daily, Weekly, Year-to-Date, Market Cap & Trends. Filter Tech stocks list by size:All Tech Large Mid-Range Small and MicroCap |
| 12Stocks.com Tech Stocks Performances & Trends Daily | |||||||||
|
|  The overall Smart Investing & Trading Score is 0 (0-bearish to 100-bullish) which puts Technology sector in short term bearish trend. The Smart Investing & Trading Score from previous trading session is 13 and hence a deterioration of trend.
| ||||||||
Here are the Smart Investing & Trading Scores of the most requested Technology stocks at 12Stocks.com (click stock name for detailed review):
|


| 12Stocks.com: Investing in Technology sector with Stocks | |
|
The following table helps investors and traders sort through current performance and trends (as measured by Smart Investing & Trading Score) of various
stocks in the Tech sector. Quick View: Move mouse or cursor over stock symbol (ticker) to view short-term technical chart and over stock name to view long term chart. Click on  to add stock symbol to your watchlist and to add stock symbol to your watchlist and  to view watchlist. Click on any ticker or stock name for detailed market intelligence report for that stock. to view watchlist. Click on any ticker or stock name for detailed market intelligence report for that stock. |
12Stocks.com Performance of Stocks in Tech Sector
| Ticker | Stock Name | Watchlist | Category | Recent Price | Smart Investing & Trading Score | Change % | YTD Change% |
| TYGO | Tigo Energy |   | Solar | 0.95 | 47 | 3.86% | -54.74% |
| LUMN | Lumen | | Telecom | 1.30 | 46 | -1.14% | -28.49% |
| INSP | Inspire Medical | | Internet | 229.22 | 76 | -4.95% | 12.68% |
| KN | Knowles | | Communication | 15.26 | 0 | -0.07% | -14.80% |
| IDCC | InterDigital | | Wireless | 96.62 | 18 | 1.00% | -10.98% |
| MTSI | MACOM | | Semiconductor | 92.79 | 26 | -2.49% | -0.17% |
| LILAK | Liberty Latin | | CATV | 7.25 | 76 | 0.69% | -1.23% |
| SPWR | SunPower | | Semiconductor | 2.21 | 20 | -1.99% | -54.14% |
| SMCI | Super Micro | | Networking | 714.04 | 26 | -23.10% | 151.19% |
| HKD | AMTD Digital | | Software - | 3.02 | 10 | -1.63% | -26.88% |
| ONTO | Onto Innovation | | Semiconductor | 169.39 | 26 | -4.64% | 10.78% |
| SIMO | Silicon Motion | | Electronics | 71.82 | 36 | -2.02% | 17.22% |
| STER | Sterling Check | | Software - Infrastructure | 14.90 | 36 | -1.55% | 6.93% |
| MSTR | MicroStrategy | | Software | 1175.14 | 43 | -2.73% | 86.05% |
| BTDR | Bitdeer | | Software - | 5.86 | 32 | 0.51% | -43.16% |
| TWOU | 2U | | Software | 0.25 | 15 | -7.56% | -79.71% |
| RCM | R1 RCM | | Healthcare Information | 11.98 | 46 | -0.33% | 13.34% |
| LPSN | LivePerson | | Software | 0.51 | 15 | -8.57% | -86.55% |
| ZUO | Zuora | | Software | 9.25 | 93 | -0.22% | -1.60% |
| TUYA | Tuya | | Software - Infrastructure | 1.55 | 0 | -5.18% | -32.24% |
| TASK | TaskUs | | IT | 11.36 | 37 | 2.53% | -14.84% |
| SONO | Sonos | | Electronics | 16.90 | 44 | 0.18% | -1.40% |
| SOUN | SoundHound AI | | Software - | 3.55 | 36 | -11.58% | 65.89% |
| OLO | Olo | | Software - | 4.67 | 31 | -0.43% | -18.36% |
| TTMI | TTM | | Circuit Boards | 14.06 | 44 | -0.11% | -11.10% |
| For chart view version of above stock list: Chart View ➞ 0 - 25 , 25 - 50 , 50 - 75 , 75 - 100 , 100 - 125 , 125 - 150 , 150 - 175 , 175 - 200 , 200 - 225 , 225 - 250 , 250 - 275 , 275 - 300 , 300 - 325 , 325 - 350 , 350 - 375 , 375 - 400 , 400 - 425 , 425 - 450 , 450 - 475 , 475 - 500 , 500 - 525 , 525 - 550 , 550 - 575 , 575 - 600 , 600 - 625 , 625 - 650 | ||
 | Click To Change The Sort Order: By Market Cap or Company Size Performance: Year-to-date, Week and Day |  |
|
Get the most comprehensive stock market coverage daily at 12Stocks.com ➞ Best Stocks Today ➞ Best Stocks Weekly ➞ Best Stocks Year-to-Date ➞ Best Stocks Trends ➞  Best Stocks Today 12Stocks.com Best Nasdaq Stocks ➞ Best S&P 500 Stocks ➞ Best Tech Stocks ➞ Best Biotech Stocks ➞ |
| Detailed Overview of Tech Stocks |
| Tech Technical Overview, Leaders & Laggards, Top Tech ETF Funds & Detailed Tech Stocks List, Charts, Trends & More |
| Tech Sector: Technical Analysis, Trends & YTD Performance | |
| Technology sector is composed of stocks
from semiconductors, software, web, social media
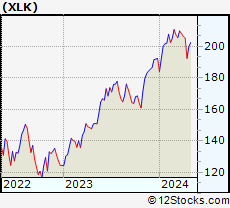
and services subsectors. Technology sector, as represented by XLK, an exchange-traded fund [ETF] that holds basket of tech stocks (e.g, Intel, Google) is up by 0.03% and is currently underperforming the overall market by -3.35% year-to-date. Below is a quick view of technical charts and trends: |
|
 XLK Weekly Chart |
|
| Long Term Trend: Not Good | |
| Medium Term Trend: Not Good | |
 XLK Daily Chart |
|
| Short Term Trend: Not Good | |
| Overall Trend Score: 0 | |
| YTD Performance: 0.03% | |
| **Trend Scores & Views Are Only For Educational Purposes And Not For Investing | |
| 12Stocks.com: Top Performing Technology Sector Stocks | ||||||||||||||||||||||||||||||||||||||||||||||||
 The top performing Technology sector stocks year to date are
Now, more recently, over last week, the top performing Technology sector stocks on the move are


|
||||||||||||||||||||||||||||||||||||||||||||||||
| 12Stocks.com: Investing in Tech Sector using Exchange Traded Funds | |
|
The following table shows list of key exchange traded funds (ETF) that
help investors track Tech Index. For detailed view, check out our ETF Funds section of our website. Quick View: Move mouse or cursor over ETF symbol (ticker) to view short-term technical chart and over ETF name to view long term chart. Click on ticker or stock name for detailed view. Click on to add stock symbol to your watchlist and to view watchlist. |
12Stocks.com List of ETFs that track Tech Index
| Ticker | ETF Name | Watchlist | Recent Price | Smart Investing & Trading Score | Change % | Week % | Year-to-date % |
| XLK | Technology | | 192.53 | 0 | -2.06 | -6.27 | 0.03% |
| QQQ | QQQ | | 414.72 | 13 | -2.05 | -5.37 | 1.27% |
| IYW | Technology | | 124.75 | 36 | -2.85 | -6.87 | 1.63% |
| VGT | Information Technology | | 479.90 | 23 | -2.65 | -6.76 | -0.85% |
| IXN | Global Tech | | 68.72 | 36 | -2.65 | -6.88 | 0.79% |
| IGV | Tech-Software | | 78.53 | 10 | -1.22 | -5.11 | -3.2% |
| XSD | Semiconductor | | 203.30 | 23 | -3.27 | -8.9 | -9.56% |
| TQQQ | QQQ | | 49.47 | 0 | -6.22 | -15.75 | -2.43% |
| SQQQ | Short QQQ | | 12.86 | 95 | 6.55 | 18.09 | -4.39% |
| SOXL | Semicondct Bull 3X | | 30.73 | 0 | -11.97 | -25.97 | -2.13% |
| SOXS | Semicondct Bear 3X | | 46.13 | 90 | 11.78 | 1210.51 | 692.61% |
| SOXX | PHLX Semiconductor | | 198.46 | 36 | -3.95 | -8.99 | 3.35% |
| QTEC | First -100-Tech | | 173.85 | 10 | -2.26 | -6.54 | -0.92% |
| SMH | Semiconductor | | 199.17 | 26 | -4.53 | -9.75 | 13.9% |
| 12Stocks.com: Charts, Trends, Fundamental Data and Performances of Tech Stocks | |
|
We now take in-depth look at all Tech stocks including charts, multi-period performances and overall trends (as measured by Smart Investing & Trading Score). One can sort Tech stocks (click link to choose) by Daily, Weekly and by Year-to-Date performances. Also, one can sort by size of the company or by market capitalization. |
| Select Your Default Chart Type: | |||||
| |||||
| Click on stock symbol or name for detailed view. Click on to add stock symbol to your watchlist and to view watchlist. Quick View: Move mouse or cursor over "Daily" to quickly view daily technical stock chart and over "Weekly" to view weekly technical stock chart. | |||||


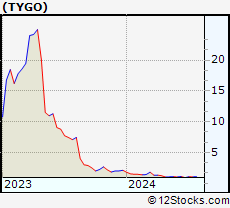 | TYGO Tigo Energy, Inc. |
| Sector: Technology | |
| SubSector: Solar | |
| MarketCap: 1250 Millions | |
| Recent Price: 0.95 Smart Investing & Trading Score: 47 | |
| Day Percent Change: 3.86% Day Change: 0.04 | |
| Week Change: -13.18% Year-to-date Change: -54.7% | |
| TYGO Links: Profile News Message Board | |
| Charts:- Daily , Weekly | |
| Add TYGO to Watchlist: View: Get Complete TYGO Trend Analysis ➞ | |
 | LUMN Lumen Technologies, Inc. |
| Sector: Technology | |
| SubSector: Telecom Services - Domestic | |
| MarketCap: 1242 Millions | |
| Recent Price: 1.30 Smart Investing & Trading Score: 46 | |
| Day Percent Change: -1.14% Day Change: -0.02 | |
| Week Change: -5.43% Year-to-date Change: -28.5% | |
| LUMN Links: Profile News Message Board | |
| Charts:- Daily , Weekly | |
| Add LUMN to Watchlist: View: Get Complete LUMN Trend Analysis ➞ | |
 | INSP Inspire Medical Systems, Inc. |
| Sector: Technology | |
| SubSector: Internet Information Providers | |
| MarketCap: 1239.8 Millions | |
| Recent Price: 229.22 Smart Investing & Trading Score: 76 | |
| Day Percent Change: -4.95% Day Change: -11.93 | |
| Week Change: -1.09% Year-to-date Change: 12.7% | |
| INSP Links: Profile News Message Board | |
| Charts:- Daily , Weekly | |
| Add INSP to Watchlist: View: Get Complete INSP Trend Analysis ➞ | |
 | KN Knowles Corporation |
| Sector: Technology | |
| SubSector: Communication Equipment | |
| MarketCap: 1231.39 Millions | |
| Recent Price: 15.26 Smart Investing & Trading Score: 0 | |
| Day Percent Change: -0.07% Day Change: -0.01 | |
| Week Change: -3.48% Year-to-date Change: -14.8% | |
| KN Links: Profile News Message Board | |
| Charts:- Daily , Weekly | |
| Add KN to Watchlist: View: Get Complete KN Trend Analysis ➞ | |
 | IDCC InterDigital, Inc. |
| Sector: Technology | |
| SubSector: Wireless Communications | |
| MarketCap: 1225.27 Millions | |
| Recent Price: 96.62 Smart Investing & Trading Score: 18 | |
| Day Percent Change: 1.00% Day Change: 0.96 | |
| Week Change: 0.07% Year-to-date Change: -11.0% | |
| IDCC Links: Profile News Message Board | |
| Charts:- Daily , Weekly | |
| Add IDCC to Watchlist: View: Get Complete IDCC Trend Analysis ➞ | |
 | MTSI MACOM Technology Solutions Holdings, Inc. |
| Sector: Technology | |
| SubSector: Semiconductor - Broad Line | |
| MarketCap: 1214.42 Millions | |
| Recent Price: 92.79 Smart Investing & Trading Score: 26 | |
| Day Percent Change: -2.49% Day Change: -2.37 | |
| Week Change: -5.7% Year-to-date Change: -0.2% | |
| MTSI Links: Profile News Message Board | |
| Charts:- Daily , Weekly | |
| Add MTSI to Watchlist: View: Get Complete MTSI Trend Analysis ➞ | |
 | LILAK Liberty Latin America Ltd. |
| Sector: Technology | |
| SubSector: CATV Systems | |
| MarketCap: 1210.32 Millions | |
| Recent Price: 7.25 Smart Investing & Trading Score: 76 | |
| Day Percent Change: 0.69% Day Change: 0.05 | |
| Week Change: 0.14% Year-to-date Change: -1.2% | |
| LILAK Links: Profile News Message Board | |
| Charts:- Daily , Weekly | |
| Add LILAK to Watchlist: View: Get Complete LILAK Trend Analysis ➞ | |
 | SPWR SunPower Corporation |
| Sector: Technology | |
| SubSector: Semiconductor - Specialized | |
| MarketCap: 1202.6 Millions | |
| Recent Price: 2.21 Smart Investing & Trading Score: 20 | |
| Day Percent Change: -1.99% Day Change: -0.04 | |
| Week Change: -10.69% Year-to-date Change: -54.1% | |
| SPWR Links: Profile News Message Board | |
| Charts:- Daily , Weekly | |
| Add SPWR to Watchlist: View: Get Complete SPWR Trend Analysis ➞ | |
 | SMCI Super Micro Computer, Inc. |
| Sector: Technology | |
| SubSector: Networking & Communication Devices | |
| MarketCap: 1200.02 Millions | |
| Recent Price: 714.04 Smart Investing & Trading Score: 26 | |
| Day Percent Change: -23.10% Day Change: -214.44 | |
| Week Change: -20.53% Year-to-date Change: 151.2% | |
| SMCI Links: Profile News Message Board | |
| Charts:- Daily , Weekly | |
| Add SMCI to Watchlist: View: Get Complete SMCI Trend Analysis ➞ | |
 | HKD AMTD Digital Inc. |
| Sector: Technology | |
| SubSector: Software - Application | |
| MarketCap: 1200 Millions | |
| Recent Price: 3.02 Smart Investing & Trading Score: 10 | |
| Day Percent Change: -1.63% Day Change: -0.05 | |
| Week Change: -10.12% Year-to-date Change: -26.9% | |
| HKD Links: Profile News Message Board | |
| Charts:- Daily , Weekly | |
| Add HKD to Watchlist: View: Get Complete HKD Trend Analysis ➞ | |
 | ONTO Onto Innovation Inc. |
| Sector: Technology | |
| SubSector: Semiconductor Equipment & Materials | |
| MarketCap: 1187.18 Millions | |
| Recent Price: 169.39 Smart Investing & Trading Score: 26 | |
| Day Percent Change: -4.64% Day Change: -8.24 | |
| Week Change: -8% Year-to-date Change: 10.8% | |
| ONTO Links: Profile News Message Board | |
| Charts:- Daily , Weekly | |
| Add ONTO to Watchlist: View: Get Complete ONTO Trend Analysis ➞ | |
 | SIMO Silicon Motion Technology Corporation |
| Sector: Technology | |
| SubSector: Diversified Electronics | |
| MarketCap: 1186.66 Millions | |
| Recent Price: 71.82 Smart Investing & Trading Score: 36 | |
| Day Percent Change: -2.02% Day Change: -1.48 | |
| Week Change: -4.6% Year-to-date Change: 17.2% | |
| SIMO Links: Profile News Message Board | |
| Charts:- Daily , Weekly | |
| Add SIMO to Watchlist: View: Get Complete SIMO Trend Analysis ➞ | |
 | STER Sterling Check Corp. |
| Sector: Technology | |
| SubSector: Software - Infrastructure | |
| MarketCap: 1180 Millions | |
| Recent Price: 14.90 Smart Investing & Trading Score: 36 | |
| Day Percent Change: -1.55% Day Change: -0.24 | |
| Week Change: -3.84% Year-to-date Change: 6.9% | |
| STER Links: Profile News Message Board | |
| Charts:- Daily , Weekly | |
| Add STER to Watchlist: View: Get Complete STER Trend Analysis ➞ | |
 | MSTR MicroStrategy Incorporated |
| Sector: Technology | |
| SubSector: Application Software | |
| MarketCap: 1164.52 Millions | |
| Recent Price: 1175.14 Smart Investing & Trading Score: 43 | |
| Day Percent Change: -2.73% Day Change: -33.02 | |
| Week Change: -20.58% Year-to-date Change: 86.1% | |
| MSTR Links: Profile News Message Board | |
| Charts:- Daily , Weekly | |
| Add MSTR to Watchlist: View: Get Complete MSTR Trend Analysis ➞ | |
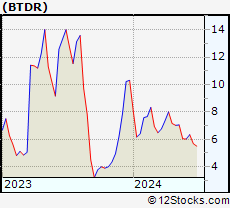 | BTDR Bitdeer Technologies Group |
| Sector: Technology | |
| SubSector: Software - Application | |
| MarketCap: 1100 Millions | |
| Recent Price: 5.86 Smart Investing & Trading Score: 32 | |
| Day Percent Change: 0.51% Day Change: 0.03 | |
| Week Change: -2.98% Year-to-date Change: -43.2% | |
| BTDR Links: Profile News Message Board | |
| Charts:- Daily , Weekly | |
| Add BTDR to Watchlist: View: Get Complete BTDR Trend Analysis ➞ | |
 | TWOU 2U, Inc. |
| Sector: Technology | |
| SubSector: Application Software | |
| MarketCap: 1090.12 Millions | |
| Recent Price: 0.25 Smart Investing & Trading Score: 15 | |
| Day Percent Change: -7.56% Day Change: -0.02 | |
| Week Change: -27.65% Year-to-date Change: -79.7% | |
| TWOU Links: Profile News Message Board | |
| Charts:- Daily , Weekly | |
| Add TWOU to Watchlist: View: Get Complete TWOU Trend Analysis ➞ | |
 | RCM R1 RCM Inc. |
| Sector: Technology | |
| SubSector: Healthcare Information Services | |
| MarketCap: 1082.15 Millions | |
| Recent Price: 11.98 Smart Investing & Trading Score: 46 | |
| Day Percent Change: -0.33% Day Change: -0.04 | |
| Week Change: -3.93% Year-to-date Change: 13.3% | |
| RCM Links: Profile News Message Board | |
| Charts:- Daily , Weekly | |
| Add RCM to Watchlist: View: Get Complete RCM Trend Analysis ➞ | |
 | LPSN LivePerson, Inc. |
| Sector: Technology | |
| SubSector: Business Software & Services | |
| MarketCap: 1070.58 Millions | |
| Recent Price: 0.51 Smart Investing & Trading Score: 15 | |
| Day Percent Change: -8.57% Day Change: -0.05 | |
| Week Change: -15.4% Year-to-date Change: -86.6% | |
| LPSN Links: Profile News Message Board | |
| Charts:- Daily , Weekly | |
| Add LPSN to Watchlist: View: Get Complete LPSN Trend Analysis ➞ | |
 | ZUO Zuora, Inc. |
| Sector: Technology | |
| SubSector: Application Software | |
| MarketCap: 1063.22 Millions | |
| Recent Price: 9.25 Smart Investing & Trading Score: 93 | |
| Day Percent Change: -0.22% Day Change: -0.02 | |
| Week Change: 7.56% Year-to-date Change: -1.6% | |
| ZUO Links: Profile News Message Board | |
| Charts:- Daily , Weekly | |
| Add ZUO to Watchlist: View: Get Complete ZUO Trend Analysis ➞ | |
 | TUYA Tuya Inc. |
| Sector: Technology | |
| SubSector: Software - Infrastructure | |
| MarketCap: 1050 Millions | |
| Recent Price: 1.55 Smart Investing & Trading Score: 0 | |
| Day Percent Change: -5.18% Day Change: -0.08 | |
| Week Change: -9.06% Year-to-date Change: -32.2% | |
| TUYA Links: Profile News Message Board | |
| Charts:- Daily , Weekly | |
| Add TUYA to Watchlist: View: Get Complete TUYA Trend Analysis ➞ | |
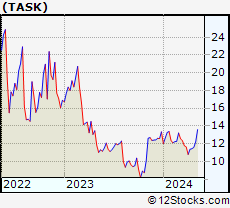 | TASK TaskUs, Inc. |
| Sector: Technology | |
| SubSector: Information Technology Services | |
| MarketCap: 1050 Millions | |
| Recent Price: 11.36 Smart Investing & Trading Score: 37 | |
| Day Percent Change: 2.53% Day Change: 0.28 | |
| Week Change: -0.09% Year-to-date Change: -14.8% | |
| TASK Links: Profile News Message Board | |
| Charts:- Daily , Weekly | |
| Add TASK to Watchlist: View: Get Complete TASK Trend Analysis ➞ | |
 | SONO Sonos, Inc. |
| Sector: Technology | |
| SubSector: Diversified Electronics | |
| MarketCap: 1047.96 Millions | |
| Recent Price: 16.90 Smart Investing & Trading Score: 44 | |
| Day Percent Change: 0.18% Day Change: 0.03 | |
| Week Change: -3.32% Year-to-date Change: -1.4% | |
| SONO Links: Profile News Message Board | |
| Charts:- Daily , Weekly | |
| Add SONO to Watchlist: View: Get Complete SONO Trend Analysis ➞ | |
 | SOUN SoundHound AI, Inc. |
| Sector: Technology | |
| SubSector: Software - Application | |
| MarketCap: 1040 Millions | |
| Recent Price: 3.55 Smart Investing & Trading Score: 36 | |
| Day Percent Change: -11.58% Day Change: -0.46 | |
| Week Change: -18.95% Year-to-date Change: 65.9% | |
| SOUN Links: Profile News Message Board | |
| Charts:- Daily , Weekly | |
| Add SOUN to Watchlist: View: Get Complete SOUN Trend Analysis ➞ | |
 | OLO Olo Inc. |
| Sector: Technology | |
| SubSector: Software - Application | |
| MarketCap: 1030 Millions | |
| Recent Price: 4.67 Smart Investing & Trading Score: 31 | |
| Day Percent Change: -0.43% Day Change: -0.02 | |
| Week Change: -6.41% Year-to-date Change: -18.4% | |
| OLO Links: Profile News Message Board | |
| Charts:- Daily , Weekly | |
| Add OLO to Watchlist: View: Get Complete OLO Trend Analysis ➞ | |
 | TTMI TTM Technologies, Inc. |
| Sector: Technology | |
| SubSector: Printed Circuit Boards | |
| MarketCap: 1028.35 Millions | |
| Recent Price: 14.06 Smart Investing & Trading Score: 44 | |
| Day Percent Change: -0.11% Day Change: -0.02 | |
| Week Change: -1.99% Year-to-date Change: -11.1% | |
| TTMI Links: Profile News Message Board | |
| Charts:- Daily , Weekly | |
| Add TTMI to Watchlist: View: Get Complete TTMI Trend Analysis ➞ | |
| For tabular summary view of above stock list: Summary View ➞ 0 - 25 , 25 - 50 , 50 - 75 , 75 - 100 , 100 - 125 , 125 - 150 , 150 - 175 , 175 - 200 , 200 - 225 , 225 - 250 , 250 - 275 , 275 - 300 , 300 - 325 , 325 - 350 , 350 - 375 , 375 - 400 , 400 - 425 , 425 - 450 , 450 - 475 , 475 - 500 , 500 - 525 , 525 - 550 , 550 - 575 , 575 - 600 , 600 - 625 , 625 - 650 | ||
| Click To Change The Sort Order: By Market Cap or Company Size Performance: Year-to-date, Week and Day | |
| Select Chart Type: | ||
|
Best Stocks Today 12Stocks.com |
© 2024 12Stocks.com Terms & Conditions Privacy Contact Us
All Information Provided Only For Education And Not To Be Used For Investing or Trading. See Terms & Conditions


One More Thing ... Get Best Stocks Delivered Daily!
Never Ever Miss A Move With Our Top Ten Stocks Lists
Find Best Stocks In Any Market - Bull or Bear Market
Take A Peek At Our Top Ten Stocks Lists: Daily, Weekly, Year-to-Date & Top Trends
Find Best Stocks In Any Market - Bull or Bear Market
Take A Peek At Our Top Ten Stocks Lists: Daily, Weekly, Year-to-Date & Top Trends
Technology Stocks With Best Up Trends [0-bearish to 100-bullish]: Cricut [100], Karooooo [100], Payoneer Global[100], Badger Meter[100], Turkcell Iletisim[93], Full Truck[93], Grab [93], Zuora [93], GDS [88], GigaCloud [88], So-Young [83]
Best Technology Stocks Year-to-Date:
MediaCo Holding[544.37%], CXApp [157.92%], Smith Micro[151.82%], Super Micro[151.19%], Uxin [141.08%], CuriosityStream [107.37%], GigaCloud [95.49%], MicroStrategy [86.05%], NextNav [78.88%], D-Wave Quantum[74.38%], AppLovin [67.63%] Best Technology Stocks This Week:
Snap One[29.61%], Badger Meter[15.61%], Mynaric AG[11.76%], Iridium [11.07%], Expensify [10.2%], SYLA [9.96%], Encore Wire[8.98%], Quhuo [8.87%], Bentley Systems[7.96%], Applied Optoelectronics[7.93%], Zuora [7.56%] Best Technology Stocks Daily:
CuriosityStream [10.89%], Markforged Holding[6.04%], CXApp [5.36%], Iridium [5.14%], Cheetah Mobile[5.04%], Aerohive Networks[4.42%], Applied Optoelectronics[3.95%], Tigo Energy[3.86%], QuinStreet [3.77%], Cricut [3.69%], ATN [3.68%]