
 Login Sign Up


| |||||
 |  | ||||

| 12Stocks.com Market Intelligence |
Best Tech Stocks
| In a hurry? Tech Stocks Lists: Performance & Trends, Stock Charts, FANG Stocks
Sort Tech stocks: Daily, Weekly, Year-to-Date, Market Cap & Trends. Filter Tech stocks list by size:All Tech Large Mid-Range Small and MicroCap |
| 12Stocks.com Tech Stocks Performances & Trends Daily | |||||||||
|
|  The overall Smart Investing & Trading Score is 38 (0-bearish to 100-bullish) which puts Technology sector in short term bearish to neutral trend. The Smart Investing & Trading Score from previous trading session is 10 and hence an improvement of trend.
| ||||||||
Here are the Smart Investing & Trading Scores of the most requested Technology stocks at 12Stocks.com (click stock name for detailed review):
|


| 12Stocks.com: Investing in Technology sector with Stocks | |
|
The following table helps investors and traders sort through current performance and trends (as measured by Smart Investing & Trading Score) of various
stocks in the Tech sector. Quick View: Move mouse or cursor over stock symbol (ticker) to view short-term technical chart and over stock name to view long term chart. Click on  to add stock symbol to your watchlist and to add stock symbol to your watchlist and  to view watchlist. Click on any ticker or stock name for detailed market intelligence report for that stock. to view watchlist. Click on any ticker or stock name for detailed market intelligence report for that stock. |
12Stocks.com Performance of Stocks in Tech Sector
| Ticker | Stock Name | Watchlist | Category | Recent Price | Smart Investing & Trading Score | Change % | YTD Change% |
| AVGO | Broadcom |   | Semiconductor | 1248.11 | 51 | 1.93% | 11.81% |
| ABNB | Airbnb | | Internet Content & Information | 160.94 | 63 | 2.76% | 18.21% |
| CHTR | Charter | | CATV | 266.27 | 57 | 0.45% | -31.49% |
| OCFT | OneConnect Financial | | Software | 1.83 | 17 | -2.66% | -41.90% |
| QCOM | QUALCOMM | | Communication | 161.35 | 61 | 0.73% | 11.56% |
| NCNO | nCino | | Software | 30.19 | 35 | 1.86% | -10.23% |
| TMUS | T-Mobile US | | Wireless | 163.26 | 95 | 0.55% | 1.83% |
| FIS | Fidelity National | | IT | 71.90 | 76 | 0.84% | 19.69% |
| FROG | JFrog | | Software | 39.20 | 65 | 3.87% | 13.23% |
| JD | JD.com | | Internet | 27.55 | 100 | 2.06% | -4.66% |
| DASH | DoorDash | | Internet Content & Information | 129.34 | 49 | 1.62% | 30.89% |
| CCI | Crown Castle | | Communication | 95.47 | 32 | 0.41% | -17.12% |
| PUBM | PubMatic | | Software | 22.81 | 68 | 2.89% | 39.94% |
| ADP | Automatic Data | | Software | 246.83 | 87 | 0.21% | 5.95% |
| AMD | Advanced Micro | | Semiconductor | 152.23 | 17 | 2.42% | 3.27% |
| VNT | Vontier | | Instruments | 40.76 | 58 | 1.44% | 17.97% |
| NOW | ServiceNow | | IT | 740.95 | 32 | 2.63% | 4.88% |
| CNXC | Concentrix | | IT | 56.62 | 58 | 2.57% | -42.35% |
| ALGM | Allegro MicroSystems | | Semiconductors | 26.56 | 93 | 1.34% | -12.31% |
| NGMS | NeoGames S.A | | Electronic Gaming & Multimedia | 29.45 | 58 | 0.07% | 3.41% |
| FOUR | Shift4 Payments | | Software Infrastructure | 61.67 | 35 | 1.07% | -17.04% |
| BIGC | BigCommerce | | Software | 5.79 | 20 | 0.61% | -40.50% |
| PLTR | Palantir | | Software Infrastructure | 21.64 | 58 | 3.20% | 26.03% |
| ARRY | Array | | Solar | 11.92 | 83 | 1.97% | -29.05% |
| MU | Micron | | Semiconductor- | 112.42 | 61 | 3.02% | 31.73% |
| For chart view version of above stock list: Chart View ➞ 0 - 25 , 25 - 50 , 50 - 75 , 75 - 100 , 100 - 125 , 125 - 150 , 150 - 175 , 175 - 200 , 200 - 225 , 225 - 250 , 250 - 275 , 275 - 300 , 300 - 325 , 325 - 350 , 350 - 375 , 375 - 400 , 400 - 425 , 425 - 450 , 450 - 475 , 475 - 500 , 500 - 525 , 525 - 550 , 550 - 575 , 575 - 600 , 600 - 625 , 625 - 650 | ||
 | Click To Change The Sort Order: By Market Cap or Company Size Performance: Year-to-date, Week and Day |  |
|
Get the most comprehensive stock market coverage daily at 12Stocks.com ➞ Best Stocks Today ➞ Best Stocks Weekly ➞ Best Stocks Year-to-Date ➞ Best Stocks Trends ➞  Best Stocks Today 12Stocks.com Best Nasdaq Stocks ➞ Best S&P 500 Stocks ➞ Best Tech Stocks ➞ Best Biotech Stocks ➞ |
| Detailed Overview of Tech Stocks |
| Tech Technical Overview, Leaders & Laggards, Top Tech ETF Funds & Detailed Tech Stocks List, Charts, Trends & More |
| Tech Sector: Technical Analysis, Trends & YTD Performance | |
| Technology sector is composed of stocks
from semiconductors, software, web, social media
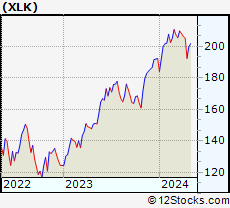
and services subsectors. Technology sector, as represented by XLK, an exchange-traded fund [ETF] that holds basket of tech stocks (e.g, Intel, Google) is up by 2.42% and is currently underperforming the overall market by -3.22% year-to-date. Below is a quick view of technical charts and trends: |
|
 XLK Weekly Chart |
|
| Long Term Trend: Not Good | |
| Medium Term Trend: Not Good | |
 XLK Daily Chart |
|
| Short Term Trend: Very Good | |
| Overall Trend Score: 38 | |
| YTD Performance: 2.42% | |
| **Trend Scores & Views Are Only For Educational Purposes And Not For Investing | |
| 12Stocks.com: Top Performing Technology Sector Stocks | ||||||||||||||||||||||||||||||||||||||||||||||||
 The top performing Technology sector stocks year to date are
Now, more recently, over last week, the top performing Technology sector stocks on the move are


|
||||||||||||||||||||||||||||||||||||||||||||||||
| 12Stocks.com: Investing in Tech Sector using Exchange Traded Funds | |
|
The following table shows list of key exchange traded funds (ETF) that
help investors track Tech Index. For detailed view, check out our ETF Funds section of our website. Quick View: Move mouse or cursor over ETF symbol (ticker) to view short-term technical chart and over ETF name to view long term chart. Click on ticker or stock name for detailed view. Click on to add stock symbol to your watchlist and to view watchlist. |
12Stocks.com List of ETFs that track Tech Index
| Ticker | ETF Name | Watchlist | Recent Price | Smart Investing & Trading Score | Change % | Week % | Year-to-date % |
| XLK | Technology | | 197.13 | 38 | 1.48 | 2.39 | 2.42% |
| QQQ | QQQ | | 424.02 | 51 | 2.34 | 2.26 | 3.54% |
| IYW | Technology | | 128.72 | 51 | 1.96 | 3.18 | 4.86% |
| VGT | Information Technology | | 495.19 | 38 | 1.80 | 3.19 | 2.31% |
| IXN | Global Tech | | 70.61 | 38 | 1.77 | 2.74 | 3.56% |
| IGV | Tech-Software | | 81.04 | 32 | 1.96 | 3.2 | -0.11% |
| XSD | Semiconductor | | 212.01 | 38 | 2.61 | 4.15 | -5.68% |
| TQQQ | QQQ | | 53.26 | 58 | 4.59 | 7.63 | 5.04% |
| SQQQ | Short QQQ | | 11.93 | 37 | -4.33 | -7.09 | -11.3% |
| SOXL | Semicondct Bull 3X | | 34.11 | 43 | 6.36 | 10.78 | 8.63% |
| SOXS | Semicondct Bear 3X | | 41.60 | 73 | -5.39 | -9.82 | 614.78% |
| SOXX | PHLX Semiconductor | | 206.62 | 51 | 2.46 | 4.15 | 7.6% |
| QTEC | First -100-Tech | | 180.57 | 38 | 2.39 | 3.81 | 2.91% |
| SMH | Semiconductor | | 207.78 | 51 | 2.34 | 4.3 | 18.82% |
| 12Stocks.com: Charts, Trends, Fundamental Data and Performances of Tech Stocks | |
|
We now take in-depth look at all Tech stocks including charts, multi-period performances and overall trends (as measured by Smart Investing & Trading Score). One can sort Tech stocks (click link to choose) by Daily, Weekly and by Year-to-Date performances. Also, one can sort by size of the company or by market capitalization. |
| Select Your Default Chart Type: | |||||
| |||||
| Click on stock symbol or name for detailed view. Click on to add stock symbol to your watchlist and to view watchlist. Quick View: Move mouse or cursor over "Daily" to quickly view daily technical stock chart and over "Weekly" to view weekly technical stock chart. | |||||


 | AVGO Broadcom Inc. |
| Sector: Technology | |
| SubSector: Semiconductor - Broad Line | |
| MarketCap: 86329.1 Millions | |
| Recent Price: 1248.11 Smart Investing & Trading Score: 51 | |
| Day Percent Change: 1.93% Day Change: 23.65 | |
| Week Change: 3.6% Year-to-date Change: 11.8% | |
| AVGO Links: Profile News Message Board | |
| Charts:- Daily , Weekly | |
| Add AVGO to Watchlist: View: Get Complete AVGO Trend Analysis ➞ | |
 | ABNB Airbnb, Inc. |
| Sector: Technology | |
| SubSector: Internet Content & Information | |
| MarketCap: 86237 Millions | |
| Recent Price: 160.94 Smart Investing & Trading Score: 63 | |
| Day Percent Change: 2.76% Day Change: 4.33 | |
| Week Change: 1.2% Year-to-date Change: 18.2% | |
| ABNB Links: Profile News Message Board | |
| Charts:- Daily , Weekly | |
| Add ABNB to Watchlist: View: Get Complete ABNB Trend Analysis ➞ | |
 | CHTR Charter Communications, Inc. |
| Sector: Technology | |
| SubSector: CATV Systems | |
| MarketCap: 82268.3 Millions | |
| Recent Price: 266.27 Smart Investing & Trading Score: 57 | |
| Day Percent Change: 0.45% Day Change: 1.19 | |
| Week Change: 0.4% Year-to-date Change: -31.5% | |
| CHTR Links: Profile News Message Board | |
| Charts:- Daily , Weekly | |
| Add CHTR to Watchlist: View: Get Complete CHTR Trend Analysis ➞ | |
 | OCFT OneConnect Financial Technology Co., Ltd. |
| Sector: Technology | |
| SubSector: Software Application | |
| MarketCap: 80387 Millions | |
| Recent Price: 1.83 Smart Investing & Trading Score: 17 | |
| Day Percent Change: -2.66% Day Change: -0.05 | |
| Week Change: -3.17% Year-to-date Change: -41.9% | |
| OCFT Links: Profile News Message Board | |
| Charts:- Daily , Weekly | |
| Add OCFT to Watchlist: View: Get Complete OCFT Trend Analysis ➞ | |
 | QCOM QUALCOMM Incorporated |
| Sector: Technology | |
| SubSector: Communication Equipment | |
| MarketCap: 77517.7 Millions | |
| Recent Price: 161.35 Smart Investing & Trading Score: 61 | |
| Day Percent Change: 0.73% Day Change: 1.17 | |
| Week Change: 2.36% Year-to-date Change: 11.6% | |
| QCOM Links: Profile News Message Board | |
| Charts:- Daily , Weekly | |
| Add QCOM to Watchlist: View: Get Complete QCOM Trend Analysis ➞ | |
 | NCNO nCino, Inc. |
| Sector: Technology | |
| SubSector: Software Application | |
| MarketCap: 74187 Millions | |
| Recent Price: 30.19 Smart Investing & Trading Score: 35 | |
| Day Percent Change: 1.86% Day Change: 0.55 | |
| Week Change: 1.26% Year-to-date Change: -10.2% | |
| NCNO Links: Profile News Message Board | |
| Charts:- Daily , Weekly | |
| Add NCNO to Watchlist: View: Get Complete NCNO Trend Analysis ➞ | |
 | TMUS T-Mobile US, Inc. |
| Sector: Technology | |
| SubSector: Wireless Communications | |
| MarketCap: 71949 Millions | |
| Recent Price: 163.26 Smart Investing & Trading Score: 95 | |
| Day Percent Change: 0.55% Day Change: 0.90 | |
| Week Change: 0.57% Year-to-date Change: 1.8% | |
| TMUS Links: Profile News Message Board | |
| Charts:- Daily , Weekly | |
| Add TMUS to Watchlist: View: Get Complete TMUS Trend Analysis ➞ | |
 | FIS Fidelity National Information Services, Inc. |
| Sector: Technology | |
| SubSector: Information Technology Services | |
| MarketCap: 71126.8 Millions | |
| Recent Price: 71.90 Smart Investing & Trading Score: 76 | |
| Day Percent Change: 0.84% Day Change: 0.60 | |
| Week Change: 1.65% Year-to-date Change: 19.7% | |
| FIS Links: Profile News Message Board | |
| Charts:- Daily , Weekly | |
| Add FIS to Watchlist: View: Get Complete FIS Trend Analysis ➞ | |
 | FROG JFrog Ltd. |
| Sector: Technology | |
| SubSector: Software Application | |
| MarketCap: 62287 Millions | |
| Recent Price: 39.20 Smart Investing & Trading Score: 65 | |
| Day Percent Change: 3.87% Day Change: 1.46 | |
| Week Change: 4.76% Year-to-date Change: 13.2% | |
| FROG Links: Profile News Message Board | |
| Charts:- Daily , Weekly | |
| Add FROG to Watchlist: View: Get Complete FROG Trend Analysis ➞ | |
 | JD JD.com, Inc. |
| Sector: Technology | |
| SubSector: Internet Information Providers | |
| MarketCap: 59907.3 Millions | |
| Recent Price: 27.55 Smart Investing & Trading Score: 100 | |
| Day Percent Change: 2.06% Day Change: 0.56 | |
| Week Change: 7.98% Year-to-date Change: -4.7% | |
| JD Links: Profile News Message Board | |
| Charts:- Daily , Weekly | |
| Add JD to Watchlist: View: Get Complete JD Trend Analysis ➞ | |
 | DASH DoorDash, Inc. |
| Sector: Technology | |
| SubSector: Internet Content & Information | |
| MarketCap: 59087 Millions | |
| Recent Price: 129.34 Smart Investing & Trading Score: 49 | |
| Day Percent Change: 1.62% Day Change: 2.07 | |
| Week Change: 1.46% Year-to-date Change: 30.9% | |
| DASH Links: Profile News Message Board | |
| Charts:- Daily , Weekly | |
| Add DASH to Watchlist: View: Get Complete DASH Trend Analysis ➞ | |
 | CCI Crown Castle International Corp. (REIT) |
| Sector: Technology | |
| SubSector: Diversified Communication Services | |
| MarketCap: 57615.4 Millions | |
| Recent Price: 95.47 Smart Investing & Trading Score: 32 | |
| Day Percent Change: 0.41% Day Change: 0.39 | |
| Week Change: 0.28% Year-to-date Change: -17.1% | |
| CCI Links: Profile News Message Board | |
| Charts:- Daily , Weekly | |
| Add CCI to Watchlist: View: Get Complete CCI Trend Analysis ➞ | |
 | PUBM PubMatic, Inc. |
| Sector: Technology | |
| SubSector: Software Application | |
| MarketCap: 56787 Millions | |
| Recent Price: 22.81 Smart Investing & Trading Score: 68 | |
| Day Percent Change: 2.89% Day Change: 0.64 | |
| Week Change: 5.55% Year-to-date Change: 39.9% | |
| PUBM Links: Profile News Message Board | |
| Charts:- Daily , Weekly | |
| Add PUBM to Watchlist: View: Get Complete PUBM Trend Analysis ➞ | |
 | ADP Automatic Data Processing, Inc. |
| Sector: Technology | |
| SubSector: Business Software & Services | |
| MarketCap: 54966.5 Millions | |
| Recent Price: 246.83 Smart Investing & Trading Score: 87 | |
| Day Percent Change: 0.21% Day Change: 0.52 | |
| Week Change: 1.45% Year-to-date Change: 6.0% | |
| ADP Links: Profile News Message Board | |
| Charts:- Daily , Weekly | |
| Add ADP to Watchlist: View: Get Complete ADP Trend Analysis ➞ | |
 | AMD Advanced Micro Devices, Inc. |
| Sector: Technology | |
| SubSector: Semiconductor - Broad Line | |
| MarketCap: 54275.1 Millions | |
| Recent Price: 152.23 Smart Investing & Trading Score: 17 | |
| Day Percent Change: 2.42% Day Change: 3.59 | |
| Week Change: 3.81% Year-to-date Change: 3.3% | |
| AMD Links: Profile News Message Board | |
| Charts:- Daily , Weekly | |
| Add AMD to Watchlist: View: Get Complete AMD Trend Analysis ➞ | |
 | VNT Vontier Corporation |
| Sector: Technology | |
| SubSector: Scientific & Technical Instruments | |
| MarketCap: 53787 Millions | |
| Recent Price: 40.76 Smart Investing & Trading Score: 58 | |
| Day Percent Change: 1.44% Day Change: 0.58 | |
| Week Change: 0.92% Year-to-date Change: 18.0% | |
| VNT Links: Profile News Message Board | |
| Charts:- Daily , Weekly | |
| Add VNT to Watchlist: View: Get Complete VNT Trend Analysis ➞ | |
 | NOW ServiceNow, Inc. |
| Sector: Technology | |
| SubSector: Information Technology Services | |
| MarketCap: 53599.1 Millions | |
| Recent Price: 740.95 Smart Investing & Trading Score: 32 | |
| Day Percent Change: 2.63% Day Change: 19.00 | |
| Week Change: 3.79% Year-to-date Change: 4.9% | |
| NOW Links: Profile News Message Board | |
| Charts:- Daily , Weekly | |
| Add NOW to Watchlist: View: Get Complete NOW Trend Analysis ➞ | |
 | CNXC Concentrix Corporation |
| Sector: Technology | |
| SubSector: Information Technology Services | |
| MarketCap: 51987 Millions | |
| Recent Price: 56.62 Smart Investing & Trading Score: 58 | |
| Day Percent Change: 2.57% Day Change: 1.42 | |
| Week Change: 2.59% Year-to-date Change: -42.4% | |
| CNXC Links: Profile News Message Board | |
| Charts:- Daily , Weekly | |
| Add CNXC to Watchlist: View: Get Complete CNXC Trend Analysis ➞ | |
 | ALGM Allegro MicroSystems, Inc. |
| Sector: Technology | |
| SubSector: Semiconductors | |
| MarketCap: 50287 Millions | |
| Recent Price: 26.56 Smart Investing & Trading Score: 93 | |
| Day Percent Change: 1.34% Day Change: 0.35 | |
| Week Change: 0.3% Year-to-date Change: -12.3% | |
| ALGM Links: Profile News Message Board | |
| Charts:- Daily , Weekly | |
| Add ALGM to Watchlist: View: Get Complete ALGM Trend Analysis ➞ | |
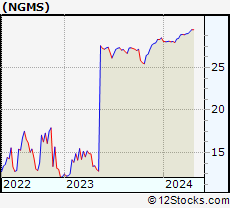 | NGMS NeoGames S.A. |
| Sector: Technology | |
| SubSector: Electronic Gaming & Multimedia | |
| MarketCap: 49837 Millions | |
| Recent Price: 29.45 Smart Investing & Trading Score: 58 | |
| Day Percent Change: 0.07% Day Change: 0.02 | |
| Week Change: -0.02% Year-to-date Change: 3.4% | |
| NGMS Links: Profile News Message Board | |
| Charts:- Daily , Weekly | |
| Add NGMS to Watchlist: View: Get Complete NGMS Trend Analysis ➞ | |
 | FOUR Shift4 Payments, Inc. |
| Sector: Technology | |
| SubSector: Software Infrastructure | |
| MarketCap: 49287 Millions | |
| Recent Price: 61.67 Smart Investing & Trading Score: 35 | |
| Day Percent Change: 1.07% Day Change: 0.65 | |
| Week Change: 1.46% Year-to-date Change: -17.0% | |
| FOUR Links: Profile News Message Board | |
| Charts:- Daily , Weekly | |
| Add FOUR to Watchlist: View: Get Complete FOUR Trend Analysis ➞ | |
 | BIGC BigCommerce Holdings, Inc. |
| Sector: Technology | |
| SubSector: Software Application | |
| MarketCap: 47587 Millions | |
| Recent Price: 5.79 Smart Investing & Trading Score: 20 | |
| Day Percent Change: 0.61% Day Change: 0.04 | |
| Week Change: -2.52% Year-to-date Change: -40.5% | |
| BIGC Links: Profile News Message Board | |
| Charts:- Daily , Weekly | |
| Add BIGC to Watchlist: View: Get Complete BIGC Trend Analysis ➞ | |
 | PLTR Palantir Technologies Inc. |
| Sector: Technology | |
| SubSector: Software Infrastructure | |
| MarketCap: 47107 Millions | |
| Recent Price: 21.64 Smart Investing & Trading Score: 58 | |
| Day Percent Change: 3.20% Day Change: 0.67 | |
| Week Change: 3.59% Year-to-date Change: 26.0% | |
| PLTR Links: Profile News Message Board | |
| Charts:- Daily , Weekly | |
| Add PLTR to Watchlist: View: Get Complete PLTR Trend Analysis ➞ | |
 | ARRY Array Technologies, Inc. |
| Sector: Technology | |
| SubSector: Solar | |
| MarketCap: 45887 Millions | |
| Recent Price: 11.92 Smart Investing & Trading Score: 83 | |
| Day Percent Change: 1.97% Day Change: 0.23 | |
| Week Change: 5.77% Year-to-date Change: -29.1% | |
| ARRY Links: Profile News Message Board | |
| Charts:- Daily , Weekly | |
| Add ARRY to Watchlist: View: Get Complete ARRY Trend Analysis ➞ | |
 | MU Micron Technology, Inc. |
| Sector: Technology | |
| SubSector: Semiconductor- Memory Chips | |
| MarketCap: 45188.4 Millions | |
| Recent Price: 112.42 Smart Investing & Trading Score: 61 | |
| Day Percent Change: 3.02% Day Change: 3.30 | |
| Week Change: 5.29% Year-to-date Change: 31.7% | |
| MU Links: Profile News Message Board | |
| Charts:- Daily , Weekly | |
| Add MU to Watchlist: View: Get Complete MU Trend Analysis ➞ | |
| For tabular summary view of above stock list: Summary View ➞ 0 - 25 , 25 - 50 , 50 - 75 , 75 - 100 , 100 - 125 , 125 - 150 , 150 - 175 , 175 - 200 , 200 - 225 , 225 - 250 , 250 - 275 , 275 - 300 , 300 - 325 , 325 - 350 , 350 - 375 , 375 - 400 , 400 - 425 , 425 - 450 , 450 - 475 , 475 - 500 , 500 - 525 , 525 - 550 , 550 - 575 , 575 - 600 , 600 - 625 , 625 - 650 | ||
| Click To Change The Sort Order: By Market Cap or Company Size Performance: Year-to-date, Week and Day | |
| Select Chart Type: | ||
|
Best Stocks Today 12Stocks.com |
© 2024 12Stocks.com Terms & Conditions Privacy Contact Us
All Information Provided Only For Education And Not To Be Used For Investing or Trading. See Terms & Conditions


One More Thing ... Get Best Stocks Delivered Daily!
Never Ever Miss A Move With Our Top Ten Stocks Lists
Find Best Stocks In Any Market - Bull or Bear Market
Take A Peek At Our Top Ten Stocks Lists: Daily, Weekly, Year-to-Date & Top Trends
Find Best Stocks In Any Market - Bull or Bear Market
Take A Peek At Our Top Ten Stocks Lists: Daily, Weekly, Year-to-Date & Top Trends
Technology Stocks With Best Up Trends [0-bearish to 100-bullish]: Payoneer Global[100], Grab [100], Sea [100], ACI Worldwide[100], NextNav [100], Full Truck[100], Badger Meter[100], Descartes Systems[100], Bentley Systems[100], JD.com [100], Cricut [100]
Best Technology Stocks Year-to-Date:
Pagaya [574.82%], MediaCo Holding[370.66%], CXApp [172.59%], Super Micro[168.16%], Smith Micro[155.45%], Uxin [131.81%], MicroStrategy [111.59%], GigaCloud [102.02%], CuriosityStream [101.81%], SoundHound AI[95.09%], NextNav [94.49%] Best Technology Stocks This Week:
Matterport [164.37%], HashiCorp [22.53%], Akoustis [21.27%], BigBear.ai [17.93%], SoundHound AI[17.61%], Cheetah Mobile[14.69%], MicroStrategy [13.83%], So-Young [13.3%], Sea [12.62%], Aerohive Networks[12.55%], IonQ [12.41%] Best Technology Stocks Daily:
HashiCorp [19.54%], Akoustis [10.46%], SoundHound AI[10.45%], MediaCo Holding[10.16%], on [9.92%], BigBear.ai [9.62%], HealthStream [9.42%], Vacasa [9.18%], Cheetah Mobile[8.85%], Viasat [7.99%], CuriosityStream [7.92%]