
 Login Sign Up


| |||||
 |  | ||||

| 12Stocks.com Market Intelligence |
Best Tech Stocks
| In a hurry? Tech Stocks Lists: Performance & Trends, Stock Charts, FANG Stocks
Sort Tech stocks: Daily, Weekly, Year-to-Date, Market Cap & Trends. Filter Tech stocks list by size:All Tech Large Mid-Range Small and MicroCap |
| 12Stocks.com Tech Stocks Performances & Trends Daily | |||||||||
|
|  The overall Smart Investing & Trading Score is 0 (0-bearish to 100-bullish) which puts Technology sector in short term bearish trend. The Smart Investing & Trading Score from previous trading session is 13 and hence a deterioration of trend.
| ||||||||
Here are the Smart Investing & Trading Scores of the most requested Technology stocks at 12Stocks.com (click stock name for detailed review):
|


| 12Stocks.com: Investing in Technology sector with Stocks | |
|
The following table helps investors and traders sort through current performance and trends (as measured by Smart Investing & Trading Score) of various
stocks in the Tech sector. Quick View: Move mouse or cursor over stock symbol (ticker) to view short-term technical chart and over stock name to view long term chart. Click on  to add stock symbol to your watchlist and to add stock symbol to your watchlist and  to view watchlist. Click on any ticker or stock name for detailed market intelligence report for that stock. to view watchlist. Click on any ticker or stock name for detailed market intelligence report for that stock. |
12Stocks.com Performance of Stocks in Tech Sector
| Ticker | Stock Name | Watchlist | Category | Recent Price | Smart Investing & Trading Score | Change % | YTD Change% |
| VIV | Telefonica Brasil |   | Wireless | 9.35 | 25 | 0.86% | -14.53% |
| SILC | Silicom | | Communication | 15.46 | 74 | 1.08% | -14.61% |
| STNE | StoneCo | | Software | 15.40 | 18 | 0.88% | -14.61% |
| WOW | WideOpenWest | | CATV | 3.46 | 33 | 0.14% | -14.69% |
| PRO | PROS | | Software | 33.08 | 0 | -1.19% | -14.72% |
| SWKS | Skyworks | | Semiconductor | 95.86 | 0 | -1.80% | -14.73% |
| USM | United States | | Wireless | 35.40 | 42 | 2.19% | -14.78% |
| TASK | TaskUs | | IT | 11.36 | 37 | 2.53% | -14.84% |
| KN | Knowles | | Communication | 15.23 | 0 | -0.29% | -14.99% |
| AMKR | Amkor | | Semiconductor | 28.23 | 0 | -2.54% | -15.13% |
| AMST | Amesite | | Software | 1.95 | 0 | -4.40% | -15.20% |
| RAMP | LiveRamp | | IT | 32.12 | 25 | -0.19% | -15.21% |
| FN | Fabrinet | | Electronic | 160.86 | 0 | -2.63% | -15.48% |
| SPT | Sprout Social | | Software | 51.92 | 0 | -1.55% | -15.49% |
| SPSC | SPS Commerce | | Software | 163.67 | 25 | 0.33% | -15.56% |
| TDC | Teradata | | IT | 36.42 | 35 | -0.90% | -16.30% |
| DQ | Daqo New | | Semiconductor | 22.25 | 46 | -2.03% | -16.35% |
| ONTF | ON24 | | Software - | 6.59 | 5 | -2.87% | -16.42% |
| DT | Dynatrace | | Software | 45.68 | 42 | -1.25% | -16.47% |
| TDS | Telephone and | | Wireless | 15.28 | 42 | 0.86% | -16.73% |
| IQ | iQIYI | | Internet | 4.06 | 56 | -3.33% | -16.80% |
| OTEX | Open Text | | Software | 34.94 | 32 | 0.53% | -16.86% |
| DLO | DLocal | | Software - Infrastructure | 14.70 | 8 | -5.32% | -16.98% |
| CCOI | Cogent | | Communication | 63.13 | 30 | -0.01% | -17.01% |
| SEMR | Semrush | | Software - | 11.52 | 36 | -2.91% | -17.06% |
| For chart view version of above stock list: Chart View ➞ 0 - 25 , 25 - 50 , 50 - 75 , 75 - 100 , 100 - 125 , 125 - 150 , 150 - 175 , 175 - 200 , 200 - 225 , 225 - 250 , 250 - 275 , 275 - 300 , 300 - 325 , 325 - 350 , 350 - 375 , 375 - 400 , 400 - 425 , 425 - 450 , 450 - 475 , 475 - 500 , 500 - 525 , 525 - 550 , 550 - 575 , 575 - 600 , 600 - 625 , 625 - 650 | ||
 | Click To Change The Sort Order: By Market Cap or Company Size Performance: Year-to-date, Week and Day |  |
|
Get the most comprehensive stock market coverage daily at 12Stocks.com ➞ Best Stocks Today ➞ Best Stocks Weekly ➞ Best Stocks Year-to-Date ➞ Best Stocks Trends ➞  Best Stocks Today 12Stocks.com Best Nasdaq Stocks ➞ Best S&P 500 Stocks ➞ Best Tech Stocks ➞ Best Biotech Stocks ➞ |
| Detailed Overview of Tech Stocks |
| Tech Technical Overview, Leaders & Laggards, Top Tech ETF Funds & Detailed Tech Stocks List, Charts, Trends & More |
| Tech Sector: Technical Analysis, Trends & YTD Performance | |
| Technology sector is composed of stocks
from semiconductors, software, web, social media
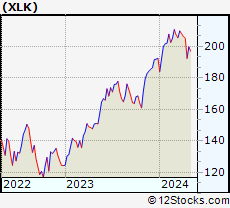
and services subsectors. Technology sector, as represented by XLK, an exchange-traded fund [ETF] that holds basket of tech stocks (e.g, Intel, Google) is up by 0.02% and is currently underperforming the overall market by -3.13% year-to-date. Below is a quick view of technical charts and trends: |
|
 XLK Weekly Chart |
|
| Long Term Trend: Not Good | |
| Medium Term Trend: Not Good | |
 XLK Daily Chart |
|
| Short Term Trend: Not Good | |
| Overall Trend Score: 0 | |
| YTD Performance: 0.02% | |
| **Trend Scores & Views Are Only For Educational Purposes And Not For Investing | |
| 12Stocks.com: Top Performing Technology Sector Stocks | ||||||||||||||||||||||||||||||||||||||||||||||||
 The top performing Technology sector stocks year to date are
Now, more recently, over last week, the top performing Technology sector stocks on the move are


|
||||||||||||||||||||||||||||||||||||||||||||||||
| 12Stocks.com: Investing in Tech Sector using Exchange Traded Funds | |
|
The following table shows list of key exchange traded funds (ETF) that
help investors track Tech Index. For detailed view, check out our ETF Funds section of our website. Quick View: Move mouse or cursor over ETF symbol (ticker) to view short-term technical chart and over ETF name to view long term chart. Click on ticker or stock name for detailed view. Click on to add stock symbol to your watchlist and to view watchlist. |
12Stocks.com List of ETFs that track Tech Index
| Ticker | ETF Name | Watchlist | Recent Price | Smart Investing & Trading Score | Change % | Week % | Year-to-date % |
| XLK | Technology | | 192.51 | 0 | -2.07 | -6.28 | 0.02% |
| QQQ | QQQ | | 414.22 | 13 | -2.17 | -5.49 | 1.15% |
| IYW | Technology | | 124.63 | 36 | -2.94 | -6.96 | 1.53% |
| VGT | Information Technology | | 479.37 | 23 | -2.76 | -6.86 | -0.96% |
| IXN | Global Tech | | 69.03 | 36 | -2.21 | -6.46 | 1.25% |
| IGV | Tech-Software | | 78.30 | 10 | -1.51 | -5.39 | -3.49% |
| XSD | Semiconductor | | 204.00 | 23 | -2.94 | -8.59 | -9.25% |
| TQQQ | QQQ | | 49.26 | 0 | -6.63 | -16.12 | -2.85% |
| SQQQ | Short QQQ | | 12.90 | 95 | 6.88 | 18.46 | -4.09% |
| SOXL | Semicondct Bull 3X | | 30.61 | 0 | -12.32 | -26.26 | -2.52% |
| SOXS | Semicondct Bear 3X | | 46.23 | 90 | 12.02 | 1213.35 | 694.33% |
| SOXX | PHLX Semiconductor | | 198.11 | 36 | -4.12 | -9.15 | 3.16% |
| QTEC | First -100-Tech | | 173.54 | 10 | -2.44 | -6.71 | -1.1% |
| SMH | Semiconductor | | 199.54 | 26 | -4.35 | -9.58 | 14.11% |
| 12Stocks.com: Charts, Trends, Fundamental Data and Performances of Tech Stocks | |
|
We now take in-depth look at all Tech stocks including charts, multi-period performances and overall trends (as measured by Smart Investing & Trading Score). One can sort Tech stocks (click link to choose) by Daily, Weekly and by Year-to-Date performances. Also, one can sort by size of the company or by market capitalization. |
| Select Your Default Chart Type: | |||||
| |||||
| Click on stock symbol or name for detailed view. Click on to add stock symbol to your watchlist and to view watchlist. Quick View: Move mouse or cursor over "Daily" to quickly view daily technical stock chart and over "Weekly" to view weekly technical stock chart. | |||||


 | VIV Telefonica Brasil S.A. |
| Sector: Technology | |
| SubSector: Wireless Communications | |
| MarketCap: 19611.1 Millions | |
| Recent Price: 9.35 Smart Investing & Trading Score: 25 | |
| Day Percent Change: 0.86% Day Change: 0.08 | |
| Week Change: -2.2% Year-to-date Change: -14.5% | |
| VIV Links: Profile News Message Board | |
| Charts:- Daily , Weekly | |
| Add VIV to Watchlist: View: Get Complete VIV Trend Analysis ➞ | |
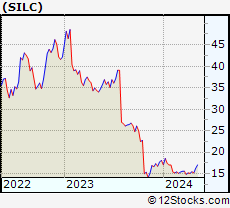 | SILC Silicom Ltd. |
| Sector: Technology | |
| SubSector: Communication Equipment | |
| MarketCap: 178.339 Millions | |
| Recent Price: 15.46 Smart Investing & Trading Score: 74 | |
| Day Percent Change: 1.08% Day Change: 0.17 | |
| Week Change: 2.28% Year-to-date Change: -14.6% | |
| SILC Links: Profile News Message Board | |
| Charts:- Daily , Weekly | |
| Add SILC to Watchlist: View: Get Complete SILC Trend Analysis ➞ | |
 | STNE StoneCo Ltd. |
| Sector: Technology | |
| SubSector: Application Software | |
| MarketCap: 7347.82 Millions | |
| Recent Price: 15.40 Smart Investing & Trading Score: 18 | |
| Day Percent Change: 0.88% Day Change: 0.13 | |
| Week Change: -4.5% Year-to-date Change: -14.6% | |
| STNE Links: Profile News Message Board | |
| Charts:- Daily , Weekly | |
| Add STNE to Watchlist: View: Get Complete STNE Trend Analysis ➞ | |
 | WOW WideOpenWest, Inc. |
| Sector: Technology | |
| SubSector: CATV Systems | |
| MarketCap: 328.932 Millions | |
| Recent Price: 3.46 Smart Investing & Trading Score: 33 | |
| Day Percent Change: 0.14% Day Change: 0.00 | |
| Week Change: -5.08% Year-to-date Change: -14.7% | |
| WOW Links: Profile News Message Board | |
| Charts:- Daily , Weekly | |
| Add WOW to Watchlist: View: Get Complete WOW Trend Analysis ➞ | |
 | PRO PROS Holdings, Inc. |
| Sector: Technology | |
| SubSector: Application Software | |
| MarketCap: 1357.42 Millions | |
| Recent Price: 33.08 Smart Investing & Trading Score: 0 | |
| Day Percent Change: -1.19% Day Change: -0.40 | |
| Week Change: -7.44% Year-to-date Change: -14.7% | |
| PRO Links: Profile News Message Board | |
| Charts:- Daily , Weekly | |
| Add PRO to Watchlist: View: Get Complete PRO Trend Analysis ➞ | |
 | SWKS Skyworks Solutions, Inc. |
| Sector: Technology | |
| SubSector: Semiconductor - Integrated Circuits | |
| MarketCap: 13981 Millions | |
| Recent Price: 95.86 Smart Investing & Trading Score: 0 | |
| Day Percent Change: -1.80% Day Change: -1.76 | |
| Week Change: -5.6% Year-to-date Change: -14.7% | |
| SWKS Links: Profile News Message Board | |
| Charts:- Daily , Weekly | |
| Add SWKS to Watchlist: View: Get Complete SWKS Trend Analysis ➞ | |
 | USM United States Cellular Corporation |
| Sector: Technology | |
| SubSector: Wireless Communications | |
| MarketCap: 2587.67 Millions | |
| Recent Price: 35.40 Smart Investing & Trading Score: 42 | |
| Day Percent Change: 2.19% Day Change: 0.76 | |
| Week Change: 0.4% Year-to-date Change: -14.8% | |
| USM Links: Profile News Message Board | |
| Charts:- Daily , Weekly | |
| Add USM to Watchlist: View: Get Complete USM Trend Analysis ➞ | |
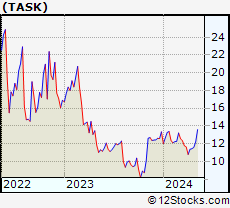 | TASK TaskUs, Inc. |
| Sector: Technology | |
| SubSector: Information Technology Services | |
| MarketCap: 1050 Millions | |
| Recent Price: 11.36 Smart Investing & Trading Score: 37 | |
| Day Percent Change: 2.53% Day Change: 0.28 | |
| Week Change: -0.09% Year-to-date Change: -14.8% | |
| TASK Links: Profile News Message Board | |
| Charts:- Daily , Weekly | |
| Add TASK to Watchlist: View: Get Complete TASK Trend Analysis ➞ | |
 | KN Knowles Corporation |
| Sector: Technology | |
| SubSector: Communication Equipment | |
| MarketCap: 1231.39 Millions | |
| Recent Price: 15.23 Smart Investing & Trading Score: 0 | |
| Day Percent Change: -0.29% Day Change: -0.04 | |
| Week Change: -3.7% Year-to-date Change: -15.0% | |
| KN Links: Profile News Message Board | |
| Charts:- Daily , Weekly | |
| Add KN to Watchlist: View: Get Complete KN Trend Analysis ➞ | |
 | AMKR Amkor Technology, Inc. |
| Sector: Technology | |
| SubSector: Semiconductor - Integrated Circuits | |
| MarketCap: 1966.2 Millions | |
| Recent Price: 28.23 Smart Investing & Trading Score: 0 | |
| Day Percent Change: -2.54% Day Change: -0.73 | |
| Week Change: -12.77% Year-to-date Change: -15.1% | |
| AMKR Links: Profile News Message Board | |
| Charts:- Daily , Weekly | |
| Add AMKR to Watchlist: View: Get Complete AMKR Trend Analysis ➞ | |
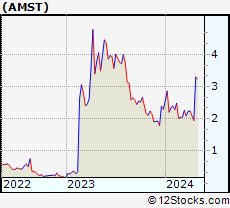 | AMST Amesite Inc. |
| Sector: Technology | |
| SubSector: Software Application | |
| MarketCap: 96787 Millions | |
| Recent Price: 1.95 Smart Investing & Trading Score: 0 | |
| Day Percent Change: -4.40% Day Change: -0.09 | |
| Week Change: -7.3% Year-to-date Change: -15.2% | |
| AMST Links: Profile News Message Board | |
| Charts:- Daily , Weekly | |
| Add AMST to Watchlist: View: Get Complete AMST Trend Analysis ➞ | |
 | RAMP LiveRamp Holdings, Inc. |
| Sector: Technology | |
| SubSector: Information Technology Services | |
| MarketCap: 2124.38 Millions | |
| Recent Price: 32.12 Smart Investing & Trading Score: 25 | |
| Day Percent Change: -0.19% Day Change: -0.06 | |
| Week Change: -4.66% Year-to-date Change: -15.2% | |
| RAMP Links: Profile News Message Board | |
| Charts:- Daily , Weekly | |
| Add RAMP to Watchlist: View: Get Complete RAMP Trend Analysis ➞ | |
 | FN Fabrinet |
| Sector: Technology | |
| SubSector: Electronic Equipment | |
| MarketCap: 1876 Millions | |
| Recent Price: 160.86 Smart Investing & Trading Score: 0 | |
| Day Percent Change: -2.63% Day Change: -4.34 | |
| Week Change: -7.19% Year-to-date Change: -15.5% | |
| FN Links: Profile News Message Board | |
| Charts:- Daily , Weekly | |
| Add FN to Watchlist: View: Get Complete FN Trend Analysis ➞ | |
 | SPT Sprout Social, Inc. |
| Sector: Technology | |
| SubSector: Software Application | |
| MarketCap: 25087 Millions | |
| Recent Price: 51.92 Smart Investing & Trading Score: 0 | |
| Day Percent Change: -1.55% Day Change: -0.82 | |
| Week Change: -7.73% Year-to-date Change: -15.5% | |
| SPT Links: Profile News Message Board | |
| Charts:- Daily , Weekly | |
| Add SPT to Watchlist: View: Get Complete SPT Trend Analysis ➞ | |
 | SPSC SPS Commerce, Inc. |
| Sector: Technology | |
| SubSector: Application Software | |
| MarketCap: 1398.02 Millions | |
| Recent Price: 163.67 Smart Investing & Trading Score: 25 | |
| Day Percent Change: 0.33% Day Change: 0.54 | |
| Week Change: -3.52% Year-to-date Change: -15.6% | |
| SPSC Links: Profile News Message Board | |
| Charts:- Daily , Weekly | |
| Add SPSC to Watchlist: View: Get Complete SPSC Trend Analysis ➞ | |
 | TDC Teradata Corporation |
| Sector: Technology | |
| SubSector: Information Technology Services | |
| MarketCap: 2229.48 Millions | |
| Recent Price: 36.42 Smart Investing & Trading Score: 35 | |
| Day Percent Change: -0.90% Day Change: -0.33 | |
| Week Change: 0.3% Year-to-date Change: -16.3% | |
| TDC Links: Profile News Message Board | |
| Charts:- Daily , Weekly | |
| Add TDC to Watchlist: View: Get Complete TDC Trend Analysis ➞ | |
 | DQ Daqo New Energy Corp. |
| Sector: Technology | |
| SubSector: Semiconductor Equipment & Materials | |
| MarketCap: 660.918 Millions | |
| Recent Price: 22.25 Smart Investing & Trading Score: 46 | |
| Day Percent Change: -2.03% Day Change: -0.46 | |
| Week Change: -4.67% Year-to-date Change: -16.4% | |
| DQ Links: Profile News Message Board | |
| Charts:- Daily , Weekly | |
| Add DQ to Watchlist: View: Get Complete DQ Trend Analysis ➞ | |
 | ONTF ON24, Inc. |
| Sector: Technology | |
| SubSector: Software - Application | |
| MarketCap: 386 Millions | |
| Recent Price: 6.59 Smart Investing & Trading Score: 5 | |
| Day Percent Change: -2.87% Day Change: -0.20 | |
| Week Change: -5.72% Year-to-date Change: -16.4% | |
| ONTF Links: Profile News Message Board | |
| Charts:- Daily , Weekly | |
| Add ONTF to Watchlist: View: Get Complete ONTF Trend Analysis ➞ | |
 | DT Dynatrace, Inc. |
| Sector: Technology | |
| SubSector: Application Software | |
| MarketCap: 7007.12 Millions | |
| Recent Price: 45.68 Smart Investing & Trading Score: 42 | |
| Day Percent Change: -1.25% Day Change: -0.58 | |
| Week Change: -0.37% Year-to-date Change: -16.5% | |
| DT Links: Profile News Message Board | |
| Charts:- Daily , Weekly | |
| Add DT to Watchlist: View: Get Complete DT Trend Analysis ➞ | |
 | TDS Telephone and Data Systems, Inc. |
| Sector: Technology | |
| SubSector: Wireless Communications | |
| MarketCap: 1851.87 Millions | |
| Recent Price: 15.28 Smart Investing & Trading Score: 42 | |
| Day Percent Change: 0.86% Day Change: 0.13 | |
| Week Change: -2.36% Year-to-date Change: -16.7% | |
| TDS Links: Profile News Message Board | |
| Charts:- Daily , Weekly | |
| Add TDS to Watchlist: View: Get Complete TDS Trend Analysis ➞ | |
 | IQ iQIYI, Inc. |
| Sector: Technology | |
| SubSector: Internet Information Providers | |
| MarketCap: 13591.5 Millions | |
| Recent Price: 4.06 Smart Investing & Trading Score: 56 | |
| Day Percent Change: -3.33% Day Change: -0.14 | |
| Week Change: -1.46% Year-to-date Change: -16.8% | |
| IQ Links: Profile News Message Board | |
| Charts:- Daily , Weekly | |
| Add IQ to Watchlist: View: Get Complete IQ Trend Analysis ➞ | |
 | OTEX Open Text Corporation |
| Sector: Technology | |
| SubSector: Application Software | |
| MarketCap: 9291.92 Millions | |
| Recent Price: 34.94 Smart Investing & Trading Score: 32 | |
| Day Percent Change: 0.53% Day Change: 0.19 | |
| Week Change: -1.65% Year-to-date Change: -16.9% | |
| OTEX Links: Profile News Message Board | |
| Charts:- Daily , Weekly | |
| Add OTEX to Watchlist: View: Get Complete OTEX Trend Analysis ➞ | |
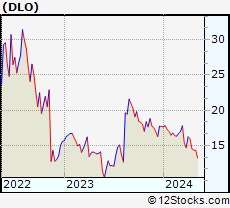 | DLO DLocal Limited |
| Sector: Technology | |
| SubSector: Software - Infrastructure | |
| MarketCap: 3620 Millions | |
| Recent Price: 14.70 Smart Investing & Trading Score: 8 | |
| Day Percent Change: -5.32% Day Change: -0.82 | |
| Week Change: -7.98% Year-to-date Change: -17.0% | |
| DLO Links: Profile News Message Board | |
| Charts:- Daily , Weekly | |
| Add DLO to Watchlist: View: Get Complete DLO Trend Analysis ➞ | |
 | CCOI Cogent Communications Holdings, Inc. |
| Sector: Technology | |
| SubSector: Diversified Communication Services | |
| MarketCap: 3868.14 Millions | |
| Recent Price: 63.13 Smart Investing & Trading Score: 30 | |
| Day Percent Change: -0.01% Day Change: -0.01 | |
| Week Change: 0.2% Year-to-date Change: -17.0% | |
| CCOI Links: Profile News Message Board | |
| Charts:- Daily , Weekly | |
| Add CCOI to Watchlist: View: Get Complete CCOI Trend Analysis ➞ | |
 | SEMR Semrush Holdings, Inc. |
| Sector: Technology | |
| SubSector: Software - Application | |
| MarketCap: 1330 Millions | |
| Recent Price: 11.52 Smart Investing & Trading Score: 36 | |
| Day Percent Change: -2.91% Day Change: -0.35 | |
| Week Change: -6.57% Year-to-date Change: -17.1% | |
| SEMR Links: Profile News Message Board | |
| Charts:- Daily , Weekly | |
| Add SEMR to Watchlist: View: Get Complete SEMR Trend Analysis ➞ | |
| For tabular summary view of above stock list: Summary View ➞ 0 - 25 , 25 - 50 , 50 - 75 , 75 - 100 , 100 - 125 , 125 - 150 , 150 - 175 , 175 - 200 , 200 - 225 , 225 - 250 , 250 - 275 , 275 - 300 , 300 - 325 , 325 - 350 , 350 - 375 , 375 - 400 , 400 - 425 , 425 - 450 , 450 - 475 , 475 - 500 , 500 - 525 , 525 - 550 , 550 - 575 , 575 - 600 , 600 - 625 , 625 - 650 | ||
| Click To Change The Sort Order: By Market Cap or Company Size Performance: Year-to-date, Week and Day | |
| Select Chart Type: | ||
|
Best Stocks Today 12Stocks.com |
© 2024 12Stocks.com Terms & Conditions Privacy Contact Us
All Information Provided Only For Education And Not To Be Used For Investing or Trading. See Terms & Conditions


One More Thing ... Get Best Stocks Delivered Daily!
Never Ever Miss A Move With Our Top Ten Stocks Lists
Find Best Stocks In Any Market - Bull or Bear Market
Take A Peek At Our Top Ten Stocks Lists: Daily, Weekly, Year-to-Date & Top Trends
Find Best Stocks In Any Market - Bull or Bear Market
Take A Peek At Our Top Ten Stocks Lists: Daily, Weekly, Year-to-Date & Top Trends
Technology Stocks With Best Up Trends [0-bearish to 100-bullish]: Cricut [100], Karooooo [100], Payoneer Global[100], Badger Meter[100], Turkcell Iletisim[93], Zuora [93], Full Truck[93], Grab [93], GigaCloud [88], GDS [88], So-Young [83]
Best Technology Stocks Year-to-Date:
MediaCo Holding[544.37%], Smith Micro[163.32%], CXApp [157.92%], Super Micro[155.54%], Uxin [141.08%], CuriosityStream [107.37%], GigaCloud [95.49%], MicroStrategy [87.95%], NextNav [78.88%], D-Wave Quantum[74.38%], AppLovin [67.63%] Best Technology Stocks This Week:
Snap One[29.61%], Badger Meter[15.82%], Mynaric AG[11.76%], Expensify [10.2%], SYLA [9.96%], Iridium [9.53%], Zuora [9.36%], Quhuo [8.87%], Encore Wire[8.81%], Bentley Systems[7.96%], NextNav [7.42%] Best Technology Stocks Daily:
CuriosityStream [10.89%], Markforged Holding[6.04%], CXApp [5.36%], Cheetah Mobile[4.15%], Tigo Energy[3.86%], Cricut [3.69%], Iridium [3.68%], MediaCo Holding[3.58%], Karooooo [3.20%], HealthStream [3.00%], DXC [2.86%]