
 Login Sign Up


| |||||
 |  | ||||

| 12Stocks.com Market Intelligence |
Best Tech Stocks
| In a hurry? Tech Stocks Lists: Performance & Trends, Stock Charts, FANG Stocks
Sort Tech stocks: Daily, Weekly, Year-to-Date, Market Cap & Trends. Filter Tech stocks list by size:All Tech Large Mid-Range Small and MicroCap |
| 12Stocks.com Tech Stocks Performances & Trends Daily | |||||||||
|
|  The overall Smart Investing & Trading Score is 38 (0-bearish to 100-bullish) which puts Technology sector in short term bearish to neutral trend. The Smart Investing & Trading Score from previous trading session is 10 and hence an improvement of trend.
| ||||||||
Here are the Smart Investing & Trading Scores of the most requested Technology stocks at 12Stocks.com (click stock name for detailed review):
|


| 12Stocks.com: Investing in Technology sector with Stocks | |
|
The following table helps investors and traders sort through current performance and trends (as measured by Smart Investing & Trading Score) of various
stocks in the Tech sector. Quick View: Move mouse or cursor over stock symbol (ticker) to view short-term technical chart and over stock name to view long term chart. Click on  to add stock symbol to your watchlist and to add stock symbol to your watchlist and  to view watchlist. Click on any ticker or stock name for detailed market intelligence report for that stock. to view watchlist. Click on any ticker or stock name for detailed market intelligence report for that stock. |
12Stocks.com Performance of Stocks in Tech Sector
| Ticker | Stock Name | Watchlist | Category | Recent Price | Smart Investing & Trading Score | Change % | YTD Change% |
| TLS | Telos |   | IT | 3.43 | 37 | 2.69% | -6.03% |
| IQ | iQIYI | | Internet | 4.58 | 70 | 6.26% | -6.15% |
| IAC | IAC/InterActiveCorp | | Internet | 49.15 | 32 | 1.37% | -6.18% |
| PDFS | | Software | 30.12 | 17 | 1.45% | -6.29% | |
| FLEX | Flex | | Circuit Boards | 28.52 | 68 | 3.22% | -6.37% |
| INFY | Infosys | | IT | 17.16 | 42 | -0.81% | -6.64% |
| CSGS | CSG Systems | | Software | 49.58 | 74 | 0.71% | -6.82% |
| AMSWA | American Software | | Software | 10.52 | 28 | 0.38% | -6.90% |
| WDAY | Workday | | Software | 256.81 | 42 | 1.29% | -6.97% |
| EA | Electronic Arts | | Software | 127.18 | 42 | 0.05% | -7.04% |
| DCBO | Docebo | | Software | 45.00 | 30 | 1.95% | -7.04% |
| LBTYK | Liberty Global | | CATV | 17.28 | 42 | 1.41% | -7.30% |
| DXC | DXC | | IT | 21.16 | 52 | 3.62% | -7.48% |
| SATS | EchoStar | | Communication | 15.30 | 100 | 1.56% | -7.69% |
| KEYS | Keysight | | Instruments | 146.80 | 35 | 1.42% | -7.73% |
| TTMI | TTM | | Circuit Boards | 14.59 | 93 | 2.28% | -7.75% |
| NABL | N-able | | IT | 12.25 | 25 | 0.74% | -7.93% |
| TER | Teradyne | | Semiconductor | 99.87 | 51 | 2.16% | -7.97% |
| HPQ | HP | | Computer | 27.67 | 25 | -0.11% | -8.04% |
| GBTG | Global Business | | Software - | 6.00 | 70 | 0.00% | -8.12% |
| DLB | Dolby | | Electronics | 79.16 | 32 | 0.44% | -8.15% |
| COMP | Compass | | Software - | 3.41 | 63 | 2.71% | -8.46% |
| DAO | Youdao | | Internet | 3.60 | 41 | 0.84% | -8.63% |
| FLYW | Flywire | | Software - Infrastructure | 21.40 | 52 | 1.81% | -8.66% |
| BLKB | Blackbaud | | Software | 79.15 | 69 | 0.66% | -8.71% |
| For chart view version of above stock list: Chart View ➞ 0 - 25 , 25 - 50 , 50 - 75 , 75 - 100 , 100 - 125 , 125 - 150 , 150 - 175 , 175 - 200 , 200 - 225 , 225 - 250 , 250 - 275 , 275 - 300 , 300 - 325 , 325 - 350 , 350 - 375 , 375 - 400 , 400 - 425 , 425 - 450 , 450 - 475 , 475 - 500 , 500 - 525 , 525 - 550 , 550 - 575 , 575 - 600 , 600 - 625 , 625 - 650 | ||
 | Click To Change The Sort Order: By Market Cap or Company Size Performance: Year-to-date, Week and Day |  |
|
Get the most comprehensive stock market coverage daily at 12Stocks.com ➞ Best Stocks Today ➞ Best Stocks Weekly ➞ Best Stocks Year-to-Date ➞ Best Stocks Trends ➞  Best Stocks Today 12Stocks.com Best Nasdaq Stocks ➞ Best S&P 500 Stocks ➞ Best Tech Stocks ➞ Best Biotech Stocks ➞ |
| Detailed Overview of Tech Stocks |
| Tech Technical Overview, Leaders & Laggards, Top Tech ETF Funds & Detailed Tech Stocks List, Charts, Trends & More |
| Tech Sector: Technical Analysis, Trends & YTD Performance | |
| Technology sector is composed of stocks
from semiconductors, software, web, social media
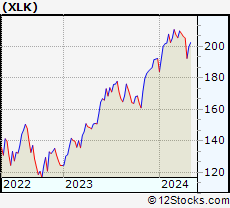
and services subsectors. Technology sector, as represented by XLK, an exchange-traded fund [ETF] that holds basket of tech stocks (e.g, Intel, Google) is up by 2.42% and is currently underperforming the overall market by -3.22% year-to-date. Below is a quick view of technical charts and trends: |
|
 XLK Weekly Chart |
|
| Long Term Trend: Not Good | |
| Medium Term Trend: Not Good | |
 XLK Daily Chart |
|
| Short Term Trend: Very Good | |
| Overall Trend Score: 38 | |
| YTD Performance: 2.42% | |
| **Trend Scores & Views Are Only For Educational Purposes And Not For Investing | |
| 12Stocks.com: Top Performing Technology Sector Stocks | ||||||||||||||||||||||||||||||||||||||||||||||||
 The top performing Technology sector stocks year to date are
Now, more recently, over last week, the top performing Technology sector stocks on the move are


|
||||||||||||||||||||||||||||||||||||||||||||||||
| 12Stocks.com: Investing in Tech Sector using Exchange Traded Funds | |
|
The following table shows list of key exchange traded funds (ETF) that
help investors track Tech Index. For detailed view, check out our ETF Funds section of our website. Quick View: Move mouse or cursor over ETF symbol (ticker) to view short-term technical chart and over ETF name to view long term chart. Click on ticker or stock name for detailed view. Click on to add stock symbol to your watchlist and to view watchlist. |
12Stocks.com List of ETFs that track Tech Index
| Ticker | ETF Name | Watchlist | Recent Price | Smart Investing & Trading Score | Change % | Week % | Year-to-date % |
| XLK | Technology | | 197.13 | 38 | 1.48 | 2.39 | 2.42% |
| QQQ | QQQ | | 424.02 | 51 | 2.34 | 2.26 | 3.54% |
| IYW | Technology | | 128.72 | 51 | 1.96 | 3.18 | 4.86% |
| VGT | Information Technology | | 495.19 | 38 | 1.80 | 3.19 | 2.31% |
| IXN | Global Tech | | 70.61 | 38 | 1.77 | 2.74 | 3.56% |
| IGV | Tech-Software | | 81.04 | 32 | 1.96 | 3.2 | -0.11% |
| XSD | Semiconductor | | 212.01 | 38 | 2.61 | 4.15 | -5.68% |
| TQQQ | QQQ | | 53.26 | 58 | 4.59 | 7.63 | 5.04% |
| SQQQ | Short QQQ | | 11.93 | 37 | -4.33 | -7.09 | -11.3% |
| SOXL | Semicondct Bull 3X | | 34.11 | 43 | 6.36 | 10.78 | 8.63% |
| SOXS | Semicondct Bear 3X | | 41.60 | 73 | -5.39 | -9.82 | 614.78% |
| SOXX | PHLX Semiconductor | | 206.62 | 51 | 2.46 | 4.15 | 7.6% |
| QTEC | First -100-Tech | | 180.57 | 38 | 2.39 | 3.81 | 2.91% |
| SMH | Semiconductor | | 207.78 | 51 | 2.34 | 4.3 | 18.82% |
| 12Stocks.com: Charts, Trends, Fundamental Data and Performances of Tech Stocks | |
|
We now take in-depth look at all Tech stocks including charts, multi-period performances and overall trends (as measured by Smart Investing & Trading Score). One can sort Tech stocks (click link to choose) by Daily, Weekly and by Year-to-Date performances. Also, one can sort by size of the company or by market capitalization. |
| Select Your Default Chart Type: | |||||
| |||||
| Click on stock symbol or name for detailed view. Click on to add stock symbol to your watchlist and to view watchlist. Quick View: Move mouse or cursor over "Daily" to quickly view daily technical stock chart and over "Weekly" to view weekly technical stock chart. | |||||


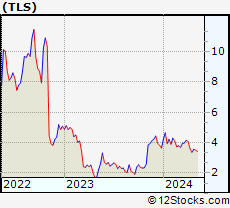 | TLS Telos Corporation |
| Sector: Technology | |
| SubSector: Information Technology Services | |
| MarketCap: 11787 Millions | |
| Recent Price: 3.43 Smart Investing & Trading Score: 37 | |
| Day Percent Change: 2.69% Day Change: 0.09 | |
| Week Change: 1.78% Year-to-date Change: -6.0% | |
| TLS Links: Profile News Message Board | |
| Charts:- Daily , Weekly | |
| Add TLS to Watchlist: View: Get Complete TLS Trend Analysis ➞ | |
 | IQ iQIYI, Inc. |
| Sector: Technology | |
| SubSector: Internet Information Providers | |
| MarketCap: 13591.5 Millions | |
| Recent Price: 4.58 Smart Investing & Trading Score: 70 | |
| Day Percent Change: 6.26% Day Change: 0.27 | |
| Week Change: 12.12% Year-to-date Change: -6.2% | |
| IQ Links: Profile News Message Board | |
| Charts:- Daily , Weekly | |
| Add IQ to Watchlist: View: Get Complete IQ Trend Analysis ➞ | |
 | IAC IAC/InterActiveCorp |
| Sector: Technology | |
| SubSector: Internet Information Providers | |
| MarketCap: 12561.2 Millions | |
| Recent Price: 49.15 Smart Investing & Trading Score: 32 | |
| Day Percent Change: 1.37% Day Change: 0.67 | |
| Week Change: 2.39% Year-to-date Change: -6.2% | |
| IAC Links: Profile News Message Board | |
| Charts:- Daily , Weekly | |
| Add IAC to Watchlist: View: Get Complete IAC Trend Analysis ➞ | |
 | PDFS PDF Solutions, Inc. |
| Sector: Technology | |
| SubSector: Technical & System Software | |
| MarketCap: 345.1 Millions | |
| Recent Price: 30.12 Smart Investing & Trading Score: 17 | |
| Day Percent Change: 1.45% Day Change: 0.43 | |
| Week Change: 1.89% Year-to-date Change: -6.3% | |
| PDFS Links: Profile News Message Board | |
| Charts:- Daily , Weekly | |
| Add PDFS to Watchlist: View: Get Complete PDFS Trend Analysis ➞ | |
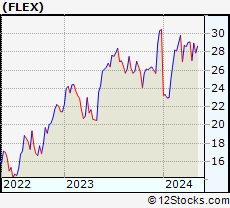 | FLEX Flex Ltd. |
| Sector: Technology | |
| SubSector: Printed Circuit Boards | |
| MarketCap: 3939.75 Millions | |
| Recent Price: 28.52 Smart Investing & Trading Score: 68 | |
| Day Percent Change: 3.22% Day Change: 0.89 | |
| Week Change: 5.36% Year-to-date Change: -6.4% | |
| FLEX Links: Profile News Message Board | |
| Charts:- Daily , Weekly | |
| Add FLEX to Watchlist: View: Get Complete FLEX Trend Analysis ➞ | |
 | INFY Infosys Limited |
| Sector: Technology | |
| SubSector: Information Technology Services | |
| MarketCap: 33819.1 Millions | |
| Recent Price: 17.16 Smart Investing & Trading Score: 42 | |
| Day Percent Change: -0.81% Day Change: -0.14 | |
| Week Change: 2.08% Year-to-date Change: -6.6% | |
| INFY Links: Profile News Message Board | |
| Charts:- Daily , Weekly | |
| Add INFY to Watchlist: View: Get Complete INFY Trend Analysis ➞ | |
 | CSGS CSG Systems International, Inc. |
| Sector: Technology | |
| SubSector: Business Software & Services | |
| MarketCap: 1336.78 Millions | |
| Recent Price: 49.58 Smart Investing & Trading Score: 74 | |
| Day Percent Change: 0.71% Day Change: 0.35 | |
| Week Change: 1.39% Year-to-date Change: -6.8% | |
| CSGS Links: Profile News Message Board | |
| Charts:- Daily , Weekly | |
| Add CSGS to Watchlist: View: Get Complete CSGS Trend Analysis ➞ | |
 | AMSWA American Software, Inc. |
| Sector: Technology | |
| SubSector: Application Software | |
| MarketCap: 389.862 Millions | |
| Recent Price: 10.52 Smart Investing & Trading Score: 28 | |
| Day Percent Change: 0.38% Day Change: 0.04 | |
| Week Change: -0.94% Year-to-date Change: -6.9% | |
| AMSWA Links: Profile News Message Board | |
| Charts:- Daily , Weekly | |
| Add AMSWA to Watchlist: View: Get Complete AMSWA Trend Analysis ➞ | |
 | WDAY Workday, Inc. |
| Sector: Technology | |
| SubSector: Application Software | |
| MarketCap: 31372.1 Millions | |
| Recent Price: 256.81 Smart Investing & Trading Score: 42 | |
| Day Percent Change: 1.29% Day Change: 3.28 | |
| Week Change: 1.82% Year-to-date Change: -7.0% | |
| WDAY Links: Profile News Message Board | |
| Charts:- Daily , Weekly | |
| Add WDAY to Watchlist: View: Get Complete WDAY Trend Analysis ➞ | |
 | EA Electronic Arts Inc. |
| Sector: Technology | |
| SubSector: Multimedia & Graphics Software | |
| MarketCap: 27296.5 Millions | |
| Recent Price: 127.18 Smart Investing & Trading Score: 42 | |
| Day Percent Change: 0.05% Day Change: 0.06 | |
| Week Change: -0.07% Year-to-date Change: -7.0% | |
| EA Links: Profile News Message Board | |
| Charts:- Daily , Weekly | |
| Add EA to Watchlist: View: Get Complete EA Trend Analysis ➞ | |
 | DCBO Docebo Inc. |
| Sector: Technology | |
| SubSector: Software Application | |
| MarketCap: 15787 Millions | |
| Recent Price: 45.00 Smart Investing & Trading Score: 30 | |
| Day Percent Change: 1.95% Day Change: 0.86 | |
| Week Change: 1.51% Year-to-date Change: -7.0% | |
| DCBO Links: Profile News Message Board | |
| Charts:- Daily , Weekly | |
| Add DCBO to Watchlist: View: Get Complete DCBO Trend Analysis ➞ | |
 | LBTYK Liberty Global plc |
| Sector: Technology | |
| SubSector: CATV Systems | |
| MarketCap: 7253.02 Millions | |
| Recent Price: 17.28 Smart Investing & Trading Score: 42 | |
| Day Percent Change: 1.41% Day Change: 0.24 | |
| Week Change: -0.63% Year-to-date Change: -7.3% | |
| LBTYK Links: Profile News Message Board | |
| Charts:- Daily , Weekly | |
| Add LBTYK to Watchlist: View: Get Complete LBTYK Trend Analysis ➞ | |
 | DXC DXC Technology Company |
| Sector: Technology | |
| SubSector: Information Technology Services | |
| MarketCap: 3622.28 Millions | |
| Recent Price: 21.16 Smart Investing & Trading Score: 52 | |
| Day Percent Change: 3.62% Day Change: 0.74 | |
| Week Change: 5.06% Year-to-date Change: -7.5% | |
| DXC Links: Profile News Message Board | |
| Charts:- Daily , Weekly | |
| Add DXC to Watchlist: View: Get Complete DXC Trend Analysis ➞ | |
 | SATS EchoStar Corporation |
| Sector: Technology | |
| SubSector: Communication Equipment | |
| MarketCap: 3175.69 Millions | |
| Recent Price: 15.30 Smart Investing & Trading Score: 100 | |
| Day Percent Change: 1.56% Day Change: 0.23 | |
| Week Change: 5.12% Year-to-date Change: -7.7% | |
| SATS Links: Profile News Message Board | |
| Charts:- Daily , Weekly | |
| Add SATS to Watchlist: View: Get Complete SATS Trend Analysis ➞ | |
 | KEYS Keysight Technologies, Inc. |
| Sector: Technology | |
| SubSector: Scientific & Technical Instruments | |
| MarketCap: 17355.1 Millions | |
| Recent Price: 146.80 Smart Investing & Trading Score: 35 | |
| Day Percent Change: 1.42% Day Change: 2.06 | |
| Week Change: 1.16% Year-to-date Change: -7.7% | |
| KEYS Links: Profile News Message Board | |
| Charts:- Daily , Weekly | |
| Add KEYS to Watchlist: View: Get Complete KEYS Trend Analysis ➞ | |
 | TTMI TTM Technologies, Inc. |
| Sector: Technology | |
| SubSector: Printed Circuit Boards | |
| MarketCap: 1028.35 Millions | |
| Recent Price: 14.59 Smart Investing & Trading Score: 93 | |
| Day Percent Change: 2.28% Day Change: 0.33 | |
| Week Change: 3.81% Year-to-date Change: -7.8% | |
| TTMI Links: Profile News Message Board | |
| Charts:- Daily , Weekly | |
| Add TTMI to Watchlist: View: Get Complete TTMI Trend Analysis ➞ | |
 | NABL N-able, Inc. |
| Sector: Technology | |
| SubSector: Information Technology Services | |
| MarketCap: 2590 Millions | |
| Recent Price: 12.25 Smart Investing & Trading Score: 25 | |
| Day Percent Change: 0.74% Day Change: 0.09 | |
| Week Change: 0.49% Year-to-date Change: -7.9% | |
| NABL Links: Profile News Message Board | |
| Charts:- Daily , Weekly | |
| Add NABL to Watchlist: View: Get Complete NABL Trend Analysis ➞ | |
 | TER Teradyne, Inc. |
| Sector: Technology | |
| SubSector: Semiconductor Equipment & Materials | |
| MarketCap: 8135.68 Millions | |
| Recent Price: 99.87 Smart Investing & Trading Score: 51 | |
| Day Percent Change: 2.16% Day Change: 2.11 | |
| Week Change: 4.06% Year-to-date Change: -8.0% | |
| TER Links: Profile News Message Board | |
| Charts:- Daily , Weekly | |
| Add TER to Watchlist: View: Get Complete TER Trend Analysis ➞ | |
 | HPQ HP Inc. |
| Sector: Technology | |
| SubSector: Diversified Computer Systems | |
| MarketCap: 22107.8 Millions | |
| Recent Price: 27.67 Smart Investing & Trading Score: 25 | |
| Day Percent Change: -0.11% Day Change: -0.03 | |
| Week Change: -0.5% Year-to-date Change: -8.0% | |
| HPQ Links: Profile News Message Board | |
| Charts:- Daily , Weekly | |
| Add HPQ to Watchlist: View: Get Complete HPQ Trend Analysis ➞ | |
 | GBTG Global Business Travel Group, Inc. |
| Sector: Technology | |
| SubSector: Software - Application | |
| MarketCap: 3440 Millions | |
| Recent Price: 6.00 Smart Investing & Trading Score: 70 | |
| Day Percent Change: 0.00% Day Change: 0.00 | |
| Week Change: 0% Year-to-date Change: -8.1% | |
| GBTG Links: Profile News Message Board | |
| Charts:- Daily , Weekly | |
| Add GBTG to Watchlist: View: Get Complete GBTG Trend Analysis ➞ | |
 | DLB Dolby Laboratories, Inc. |
| Sector: Technology | |
| SubSector: Diversified Electronics | |
| MarketCap: 5618.16 Millions | |
| Recent Price: 79.16 Smart Investing & Trading Score: 32 | |
| Day Percent Change: 0.44% Day Change: 0.35 | |
| Week Change: 1.25% Year-to-date Change: -8.2% | |
| DLB Links: Profile News Message Board | |
| Charts:- Daily , Weekly | |
| Add DLB to Watchlist: View: Get Complete DLB Trend Analysis ➞ | |
 | COMP Compass, Inc. |
| Sector: Technology | |
| SubSector: Software - Application | |
| MarketCap: 1580 Millions | |
| Recent Price: 3.41 Smart Investing & Trading Score: 63 | |
| Day Percent Change: 2.71% Day Change: 0.09 | |
| Week Change: 5.25% Year-to-date Change: -8.5% | |
| COMP Links: Profile News Message Board | |
| Charts:- Daily , Weekly | |
| Add COMP to Watchlist: View: Get Complete COMP Trend Analysis ➞ | |
 | DAO Youdao, Inc. |
| Sector: Technology | |
| SubSector: Internet Information Providers | |
| MarketCap: 2073.2 Millions | |
| Recent Price: 3.60 Smart Investing & Trading Score: 41 | |
| Day Percent Change: 0.84% Day Change: 0.03 | |
| Week Change: 1.41% Year-to-date Change: -8.6% | |
| DAO Links: Profile News Message Board | |
| Charts:- Daily , Weekly | |
| Add DAO to Watchlist: View: Get Complete DAO Trend Analysis ➞ | |
 | FLYW Flywire Corporation |
| Sector: Technology | |
| SubSector: Software - Infrastructure | |
| MarketCap: 3390 Millions | |
| Recent Price: 21.40 Smart Investing & Trading Score: 52 | |
| Day Percent Change: 1.81% Day Change: 0.38 | |
| Week Change: 1.42% Year-to-date Change: -8.7% | |
| FLYW Links: Profile News Message Board | |
| Charts:- Daily , Weekly | |
| Add FLYW to Watchlist: View: Get Complete FLYW Trend Analysis ➞ | |
 | BLKB Blackbaud, Inc. |
| Sector: Technology | |
| SubSector: Business Software & Services | |
| MarketCap: 2838.48 Millions | |
| Recent Price: 79.15 Smart Investing & Trading Score: 69 | |
| Day Percent Change: 0.66% Day Change: 0.52 | |
| Week Change: 3.49% Year-to-date Change: -8.7% | |
| BLKB Links: Profile News Message Board | |
| Charts:- Daily , Weekly | |
| Add BLKB to Watchlist: View: Get Complete BLKB Trend Analysis ➞ | |
| For tabular summary view of above stock list: Summary View ➞ 0 - 25 , 25 - 50 , 50 - 75 , 75 - 100 , 100 - 125 , 125 - 150 , 150 - 175 , 175 - 200 , 200 - 225 , 225 - 250 , 250 - 275 , 275 - 300 , 300 - 325 , 325 - 350 , 350 - 375 , 375 - 400 , 400 - 425 , 425 - 450 , 450 - 475 , 475 - 500 , 500 - 525 , 525 - 550 , 550 - 575 , 575 - 600 , 600 - 625 , 625 - 650 | ||
| Click To Change The Sort Order: By Market Cap or Company Size Performance: Year-to-date, Week and Day | |
| Select Chart Type: | ||
|
Best Stocks Today 12Stocks.com |
© 2024 12Stocks.com Terms & Conditions Privacy Contact Us
All Information Provided Only For Education And Not To Be Used For Investing or Trading. See Terms & Conditions


One More Thing ... Get Best Stocks Delivered Daily!
Never Ever Miss A Move With Our Top Ten Stocks Lists
Find Best Stocks In Any Market - Bull or Bear Market
Take A Peek At Our Top Ten Stocks Lists: Daily, Weekly, Year-to-Date & Top Trends
Find Best Stocks In Any Market - Bull or Bear Market
Take A Peek At Our Top Ten Stocks Lists: Daily, Weekly, Year-to-Date & Top Trends
Technology Stocks With Best Up Trends [0-bearish to 100-bullish]: HashiCorp [100], Payoneer Global[100], Grab [100], Sea [100], ACI Worldwide[100], NextNav [100], Full Truck[100], Badger Meter[100], Descartes Systems[100], Bentley Systems[100], JD.com [100]
Best Technology Stocks Year-to-Date:
Pagaya [574.82%], MediaCo Holding[370.66%], CXApp [172.59%], Super Micro[168.16%], Smith Micro[155.45%], Uxin [131.81%], MicroStrategy [111.59%], GigaCloud [102.02%], CuriosityStream [101.81%], SoundHound AI[95.09%], NextNav [94.49%] Best Technology Stocks This Week:
Matterport [164.37%], HashiCorp [22.53%], Akoustis [21.27%], BigBear.ai [17.93%], SoundHound AI[17.61%], Cheetah Mobile[14.69%], MicroStrategy [13.83%], So-Young [13.3%], Sea [12.62%], Aerohive Networks[12.55%], IonQ [12.41%] Best Technology Stocks Daily:
HashiCorp [19.54%], Akoustis [10.46%], SoundHound AI[10.45%], MediaCo Holding[10.16%], on [9.92%], BigBear.ai [9.62%], HealthStream [9.42%], Vacasa [9.18%], Cheetah Mobile[8.85%], Viasat [7.99%], CuriosityStream [7.92%]