
 Login Sign Up


| |||||
 |  | ||||

| 12Stocks.com Market Intelligence |
Best Tech Stocks
| In a hurry? Tech Stocks Lists: Performance & Trends, Stock Charts, FANG Stocks
Sort Tech stocks: Daily, Weekly, Year-to-Date, Market Cap & Trends. Filter Tech stocks list by size:All Tech Large Mid-Range Small and MicroCap |
| 12Stocks.com Tech Stocks Performances & Trends Daily | |||||||||
|
|  The overall Smart Investing & Trading Score is 13 (0-bearish to 100-bullish) which puts Technology sector in short term bearish trend. The Smart Investing & Trading Score from previous trading session is 26 and hence a deterioration of trend.
| ||||||||
Here are the Smart Investing & Trading Scores of the most requested Technology stocks at 12Stocks.com (click stock name for detailed review):
|


| 12Stocks.com: Investing in Technology sector with Stocks | |
|
The following table helps investors and traders sort through current performance and trends (as measured by Smart Investing & Trading Score) of various
stocks in the Tech sector. Quick View: Move mouse or cursor over stock symbol (ticker) to view short-term technical chart and over stock name to view long term chart. Click on  to add stock symbol to your watchlist and to add stock symbol to your watchlist and  to view watchlist. Click on any ticker or stock name for detailed market intelligence report for that stock. to view watchlist. Click on any ticker or stock name for detailed market intelligence report for that stock. |
12Stocks.com Performance of Stocks in Tech Sector
| Ticker | Stock Name | Watchlist | Category | Recent Price | Smart Investing & Trading Score | Change % | Weekly Change% |
| HUBS | HubSpot |   | Software | 633.45 | 53 | -0.06% | -4.51% |
| ALLT | Allot | | Communication | 2.11 | 36 | -0.24% | -4.52% |
| SQ | Square | | Internet | 73.51 | 48 | 0.51% | -4.52% |
| OKTA | Okta | | Software | 93.80 | 43 | -1.27% | -4.54% |
| MRCY | Mercury Systems | | Computer | 27.46 | 10 | -0.36% | -4.55% |
| ROG | Rogers | | Electronics | 105.82 | 10 | -3.57% | -4.55% |
| CXAI | CXApp | | Software - | 4.19 | 63 | 7.16% | -4.56% |
| AVGO | Broadcom | | Semiconductor | 1282.63 | 26 | -3.49% | -4.57% |
| PYCR | Paycor HCM | | Software - | 17.01 | 0 | -0.29% | -4.60% |
| ZS | Zscaler | | Security Software | 172.96 | 10 | -0.78% | -4.66% |
| ZBRA | Zebra | | Communication | 276.14 | 36 | -1.52% | -4.67% |
| LRCX | Lam Research | | Semiconductor | 912.26 | 26 | -5.29% | -4.68% |
| SPSC | SPS Commerce | | Software | 161.70 | 0 | -1.01% | -4.69% |
| GRND | Grindr | | Software - | 9.76 | 43 | -1.61% | -4.69% |
| NVDA | NVIDIA | | Semiconductor | 840.35 | 31 | -3.87% | -4.71% |
| CTS | CTS | | Electronics | 43.80 | 36 | -1.28% | -4.72% |
| HKD | AMTD Digital | | Software - | 3.20 | 27 | -0.31% | -4.76% |
| UMC | United Microelectronics | | Semiconductor | 7.59 | 0 | -0.91% | -4.77% |
| OLED | Universal Display | | Semiconductor | 151.97 | 0 | -1.34% | -4.77% |
| RMBS | Rambus | | Semiconductor- | 57.25 | 0 | -2.50% | -4.81% |
| AAPL | Apple | | Electronic | 168.00 | 17 | -0.81% | -4.84% |
| SQSP | Squarespace | | Software - Infrastructure | 34.82 | 31 | -1.36% | -4.84% |
| AOSL | Alpha and | | Semiconductor | 20.66 | 10 | -3.23% | -4.88% |
| COHU | Cohu | | Semiconductor | 29.74 | 10 | -2.40% | -4.89% |
| NTGR | NETGEAR | | Communication | 13.96 | 5 | -0.64% | -4.90% |
| For chart view version of above stock list: Chart View ➞ 0 - 25 , 25 - 50 , 50 - 75 , 75 - 100 , 100 - 125 , 125 - 150 , 150 - 175 , 175 - 200 , 200 - 225 , 225 - 250 , 250 - 275 , 275 - 300 , 300 - 325 , 325 - 350 , 350 - 375 , 375 - 400 , 400 - 425 , 425 - 450 , 450 - 475 , 475 - 500 , 500 - 525 , 525 - 550 , 550 - 575 , 575 - 600 , 600 - 625 , 625 - 650 | ||
 | Click To Change The Sort Order: By Market Cap or Company Size Performance: Year-to-date, Week and Day |  |
|
Get the most comprehensive stock market coverage daily at 12Stocks.com ➞ Best Stocks Today ➞ Best Stocks Weekly ➞ Best Stocks Year-to-Date ➞ Best Stocks Trends ➞  Best Stocks Today 12Stocks.com Best Nasdaq Stocks ➞ Best S&P 500 Stocks ➞ Best Tech Stocks ➞ Best Biotech Stocks ➞ |
| Detailed Overview of Tech Stocks |
| Tech Technical Overview, Leaders & Laggards, Top Tech ETF Funds & Detailed Tech Stocks List, Charts, Trends & More |
| Tech Sector: Technical Analysis, Trends & YTD Performance | |
| Technology sector is composed of stocks
from semiconductors, software, web, social media
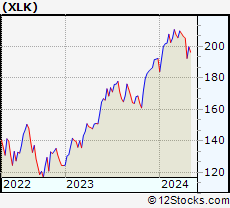
and services subsectors. Technology sector, as represented by XLK, an exchange-traded fund [ETF] that holds basket of tech stocks (e.g, Intel, Google) is up by 3.31% and is currently underperforming the overall market by -1.1% year-to-date. Below is a quick view of technical charts and trends: |
|
 XLK Weekly Chart |
|
| Long Term Trend: Good | |
| Medium Term Trend: Not Good | |
 XLK Daily Chart |
|
| Short Term Trend: Not Good | |
| Overall Trend Score: 13 | |
| YTD Performance: 3.31% | |
| **Trend Scores & Views Are Only For Educational Purposes And Not For Investing | |
| 12Stocks.com: Top Performing Technology Sector Stocks | ||||||||||||||||||||||||||||||||||||||||||||||||
 The top performing Technology sector stocks year to date are
Now, more recently, over last week, the top performing Technology sector stocks on the move are


|
||||||||||||||||||||||||||||||||||||||||||||||||
| 12Stocks.com: Investing in Tech Sector using Exchange Traded Funds | |
|
The following table shows list of key exchange traded funds (ETF) that
help investors track Tech Index. For detailed view, check out our ETF Funds section of our website. Quick View: Move mouse or cursor over ETF symbol (ticker) to view short-term technical chart and over ETF name to view long term chart. Click on ticker or stock name for detailed view. Click on to add stock symbol to your watchlist and to view watchlist. |
12Stocks.com List of ETFs that track Tech Index
| Ticker | ETF Name | Watchlist | Recent Price | Smart Investing & Trading Score | Change % | Week % | Year-to-date % |
| XLK | Technology | | 198.85 | 13 | -1.44 | -3.2 | 3.31% |
| QQQ | QQQ | | 425.84 | 26 | -1.31 | -2.84 | 3.99% |
| IYW | Technology | | 129.34 | 26 | -1.55 | -3.44 | 5.37% |
| VGT | Information Technology | | 497.69 | 13 | -1.48 | -3.3 | 2.83% |
| IXN | Global Tech | | 71.31 | 26 | -1.75 | -3.37 | 4.59% |
| IGV | Tech-Software | | 80.06 | 0 | -0.79 | -3.26 | -1.32% |
| XSD | Semiconductor | | 214.44 | 26 | -2.18 | -3.91 | -4.6% |
| TQQQ | QQQ | | 53.71 | 26 | -3.71 | -8.53 | 5.94% |
| SQQQ | Short QQQ | | 11.86 | 69 | 3.67 | 8.91 | -11.82% |
| SOXL | Semicondct Bull 3X | | 37.06 | 26 | -8.58 | -10.72 | 18.03% |
| SOXS | Semicondct Bear 3X | | 39.15 | 90 | 8.18 | 1012.22 | 572.68% |
| SOXX | PHLX Semiconductor | | 210.36 | 26 | -2.77 | -3.54 | 9.54% |
| QTEC | First -100-Tech | | 179.73 | 13 | -1.93 | -3.38 | 2.43% |
| SMH | Semiconductor | | 212.40 | 31 | -3.08 | -3.75 | 21.46% |
| 12Stocks.com: Charts, Trends, Fundamental Data and Performances of Tech Stocks | |
|
We now take in-depth look at all Tech stocks including charts, multi-period performances and overall trends (as measured by Smart Investing & Trading Score). One can sort Tech stocks (click link to choose) by Daily, Weekly and by Year-to-Date performances. Also, one can sort by size of the company or by market capitalization. |
| Select Your Default Chart Type: | |||||
| |||||
| Click on stock symbol or name for detailed view. Click on to add stock symbol to your watchlist and to view watchlist. Quick View: Move mouse or cursor over "Daily" to quickly view daily technical stock chart and over "Weekly" to view weekly technical stock chart. | |||||


 | HUBS HubSpot, Inc. |
| Sector: Technology | |
| SubSector: Application Software | |
| MarketCap: 5715.12 Millions | |
| Recent Price: 633.45 Smart Investing & Trading Score: 53 | |
| Day Percent Change: -0.06% Day Change: -0.40 | |
| Week Change: -4.51% Year-to-date Change: 9.1% | |
| HUBS Links: Profile News Message Board | |
| Charts:- Daily , Weekly | |
| Add HUBS to Watchlist: View: Get Complete HUBS Trend Analysis ➞ | |
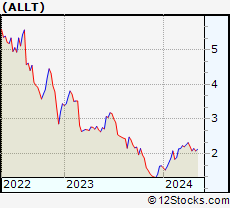 | ALLT Allot Ltd. |
| Sector: Technology | |
| SubSector: Communication Equipment | |
| MarketCap: 236.639 Millions | |
| Recent Price: 2.11 Smart Investing & Trading Score: 36 | |
| Day Percent Change: -0.24% Day Change: -0.01 | |
| Week Change: -4.52% Year-to-date Change: 27.9% | |
| ALLT Links: Profile News Message Board | |
| Charts:- Daily , Weekly | |
| Add ALLT to Watchlist: View: Get Complete ALLT Trend Analysis ➞ | |
 | SQ Square, Inc. |
| Sector: Technology | |
| SubSector: Internet Software & Services | |
| MarketCap: 19323.1 Millions | |
| Recent Price: 73.51 Smart Investing & Trading Score: 48 | |
| Day Percent Change: 0.51% Day Change: 0.37 | |
| Week Change: -4.52% Year-to-date Change: -5.0% | |
| SQ Links: Profile News Message Board | |
| Charts:- Daily , Weekly | |
| Add SQ to Watchlist: View: Get Complete SQ Trend Analysis ➞ | |
 | OKTA Okta, Inc. |
| Sector: Technology | |
| SubSector: Technical & System Software | |
| MarketCap: 15332.9 Millions | |
| Recent Price: 93.80 Smart Investing & Trading Score: 43 | |
| Day Percent Change: -1.27% Day Change: -1.21 | |
| Week Change: -4.54% Year-to-date Change: 3.6% | |
| OKTA Links: Profile News Message Board | |
| Charts:- Daily , Weekly | |
| Add OKTA to Watchlist: View: Get Complete OKTA Trend Analysis ➞ | |
 | MRCY Mercury Systems, Inc. |
| Sector: Technology | |
| SubSector: Computer Peripherals | |
| MarketCap: 3797.09 Millions | |
| Recent Price: 27.46 Smart Investing & Trading Score: 10 | |
| Day Percent Change: -0.36% Day Change: -0.10 | |
| Week Change: -4.55% Year-to-date Change: -24.9% | |
| MRCY Links: Profile News Message Board | |
| Charts:- Daily , Weekly | |
| Add MRCY to Watchlist: View: Get Complete MRCY Trend Analysis ➞ | |
 | ROG Rogers Corporation |
| Sector: Technology | |
| SubSector: Diversified Electronics | |
| MarketCap: 1756.36 Millions | |
| Recent Price: 105.82 Smart Investing & Trading Score: 10 | |
| Day Percent Change: -3.57% Day Change: -3.92 | |
| Week Change: -4.55% Year-to-date Change: -19.9% | |
| ROG Links: Profile News Message Board | |
| Charts:- Daily , Weekly | |
| Add ROG to Watchlist: View: Get Complete ROG Trend Analysis ➞ | |
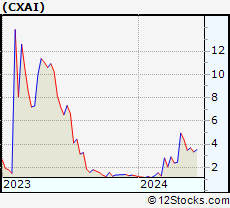 | CXAI CXApp Inc. |
| Sector: Technology | |
| SubSector: Software - Application | |
| MarketCap: 154 Millions | |
| Recent Price: 4.19 Smart Investing & Trading Score: 63 | |
| Day Percent Change: 7.16% Day Change: 0.28 | |
| Week Change: -4.56% Year-to-date Change: 223.6% | |
| CXAI Links: Profile News Message Board | |
| Charts:- Daily , Weekly | |
| Add CXAI to Watchlist: View: Get Complete CXAI Trend Analysis ➞ | |
 | AVGO Broadcom Inc. |
| Sector: Technology | |
| SubSector: Semiconductor - Broad Line | |
| MarketCap: 86329.1 Millions | |
| Recent Price: 1282.63 Smart Investing & Trading Score: 26 | |
| Day Percent Change: -3.49% Day Change: -46.43 | |
| Week Change: -4.57% Year-to-date Change: 14.9% | |
| AVGO Links: Profile News Message Board | |
| Charts:- Daily , Weekly | |
| Add AVGO to Watchlist: View: Get Complete AVGO Trend Analysis ➞ | |
 | PYCR Paycor HCM, Inc. |
| Sector: Technology | |
| SubSector: Software - Application | |
| MarketCap: 4220 Millions | |
| Recent Price: 17.01 Smart Investing & Trading Score: 0 | |
| Day Percent Change: -0.29% Day Change: -0.05 | |
| Week Change: -4.6% Year-to-date Change: -21.5% | |
| PYCR Links: Profile News Message Board | |
| Charts:- Daily , Weekly | |
| Add PYCR to Watchlist: View: Get Complete PYCR Trend Analysis ➞ | |
 | ZS Zscaler, Inc. |
| Sector: Technology | |
| SubSector: Security Software & Services | |
| MarketCap: 7532.17 Millions | |
| Recent Price: 172.96 Smart Investing & Trading Score: 10 | |
| Day Percent Change: -0.78% Day Change: -1.36 | |
| Week Change: -4.66% Year-to-date Change: -21.9% | |
| ZS Links: Profile News Message Board | |
| Charts:- Daily , Weekly | |
| Add ZS to Watchlist: View: Get Complete ZS Trend Analysis ➞ | |
 | ZBRA Zebra Technologies Corporation |
| Sector: Technology | |
| SubSector: Communication Equipment | |
| MarketCap: 11474.9 Millions | |
| Recent Price: 276.14 Smart Investing & Trading Score: 36 | |
| Day Percent Change: -1.52% Day Change: -4.28 | |
| Week Change: -4.67% Year-to-date Change: 1.0% | |
| ZBRA Links: Profile News Message Board | |
| Charts:- Daily , Weekly | |
| Add ZBRA to Watchlist: View: Get Complete ZBRA Trend Analysis ➞ | |
 | LRCX Lam Research Corporation |
| Sector: Technology | |
| SubSector: Semiconductor Equipment & Materials | |
| MarketCap: 31806 Millions | |
| Recent Price: 912.26 Smart Investing & Trading Score: 26 | |
| Day Percent Change: -5.29% Day Change: -50.97 | |
| Week Change: -4.68% Year-to-date Change: 16.5% | |
| LRCX Links: Profile News Message Board | |
| Charts:- Daily , Weekly | |
| Add LRCX to Watchlist: View: Get Complete LRCX Trend Analysis ➞ | |
 | SPSC SPS Commerce, Inc. |
| Sector: Technology | |
| SubSector: Application Software | |
| MarketCap: 1398.02 Millions | |
| Recent Price: 161.70 Smart Investing & Trading Score: 0 | |
| Day Percent Change: -1.01% Day Change: -1.65 | |
| Week Change: -4.69% Year-to-date Change: -16.6% | |
| SPSC Links: Profile News Message Board | |
| Charts:- Daily , Weekly | |
| Add SPSC to Watchlist: View: Get Complete SPSC Trend Analysis ➞ | |
 | GRND Grindr Inc. |
| Sector: Technology | |
| SubSector: Software - Application | |
| MarketCap: 929 Millions | |
| Recent Price: 9.76 Smart Investing & Trading Score: 43 | |
| Day Percent Change: -1.61% Day Change: -0.16 | |
| Week Change: -4.69% Year-to-date Change: 8.9% | |
| GRND Links: Profile News Message Board | |
| Charts:- Daily , Weekly | |
| Add GRND to Watchlist: View: Get Complete GRND Trend Analysis ➞ | |
 | NVDA NVIDIA Corporation |
| Sector: Technology | |
| SubSector: Semiconductor - Specialized | |
| MarketCap: 143476 Millions | |
| Recent Price: 840.35 Smart Investing & Trading Score: 31 | |
| Day Percent Change: -3.87% Day Change: -33.80 | |
| Week Change: -4.71% Year-to-date Change: 69.7% | |
| NVDA Links: Profile News Message Board | |
| Charts:- Daily , Weekly | |
| Add NVDA to Watchlist: View: Get Complete NVDA Trend Analysis ➞ | |
 | CTS CTS Corporation |
| Sector: Technology | |
| SubSector: Diversified Electronics | |
| MarketCap: 645.896 Millions | |
| Recent Price: 43.80 Smart Investing & Trading Score: 36 | |
| Day Percent Change: -1.28% Day Change: -0.57 | |
| Week Change: -4.72% Year-to-date Change: 0.1% | |
| CTS Links: Profile News Message Board | |
| Charts:- Daily , Weekly | |
| Add CTS to Watchlist: View: Get Complete CTS Trend Analysis ➞ | |
 | HKD AMTD Digital Inc. |
| Sector: Technology | |
| SubSector: Software - Application | |
| MarketCap: 1200 Millions | |
| Recent Price: 3.20 Smart Investing & Trading Score: 27 | |
| Day Percent Change: -0.31% Day Change: -0.01 | |
| Week Change: -4.76% Year-to-date Change: -22.5% | |
| HKD Links: Profile News Message Board | |
| Charts:- Daily , Weekly | |
| Add HKD to Watchlist: View: Get Complete HKD Trend Analysis ➞ | |
 | UMC United Microelectronics Corporation |
| Sector: Technology | |
| SubSector: Semiconductor Equipment & Materials | |
| MarketCap: 5672.78 Millions | |
| Recent Price: 7.59 Smart Investing & Trading Score: 0 | |
| Day Percent Change: -0.91% Day Change: -0.07 | |
| Week Change: -4.77% Year-to-date Change: -10.3% | |
| UMC Links: Profile News Message Board | |
| Charts:- Daily , Weekly | |
| Add UMC to Watchlist: View: Get Complete UMC Trend Analysis ➞ | |
 | OLED Universal Display Corporation |
| Sector: Technology | |
| SubSector: Semiconductor Equipment & Materials | |
| MarketCap: 5660.08 Millions | |
| Recent Price: 151.97 Smart Investing & Trading Score: 0 | |
| Day Percent Change: -1.34% Day Change: -2.06 | |
| Week Change: -4.77% Year-to-date Change: -20.5% | |
| OLED Links: Profile News Message Board | |
| Charts:- Daily , Weekly | |
| Add OLED to Watchlist: View: Get Complete OLED Trend Analysis ➞ | |
 | RMBS Rambus Inc. |
| Sector: Technology | |
| SubSector: Semiconductor- Memory Chips | |
| MarketCap: 1296 Millions | |
| Recent Price: 57.25 Smart Investing & Trading Score: 0 | |
| Day Percent Change: -2.50% Day Change: -1.47 | |
| Week Change: -4.81% Year-to-date Change: -16.1% | |
| RMBS Links: Profile News Message Board | |
| Charts:- Daily , Weekly | |
| Add RMBS to Watchlist: View: Get Complete RMBS Trend Analysis ➞ | |
 | AAPL Apple Inc. |
| Sector: Technology | |
| SubSector: Electronic Equipment | |
| MarketCap: 1112940 Millions | |
| Recent Price: 168.00 Smart Investing & Trading Score: 17 | |
| Day Percent Change: -0.81% Day Change: -1.38 | |
| Week Change: -4.84% Year-to-date Change: -12.7% | |
| AAPL Links: Profile News Message Board | |
| Charts:- Daily , Weekly | |
| Add AAPL to Watchlist: View: Get Complete AAPL Trend Analysis ➞ | |
 | SQSP Squarespace, Inc. |
| Sector: Technology | |
| SubSector: Software - Infrastructure | |
| MarketCap: 4150 Millions | |
| Recent Price: 34.82 Smart Investing & Trading Score: 31 | |
| Day Percent Change: -1.36% Day Change: -0.48 | |
| Week Change: -4.84% Year-to-date Change: 4.9% | |
| SQSP Links: Profile News Message Board | |
| Charts:- Daily , Weekly | |
| Add SQSP to Watchlist: View: Get Complete SQSP Trend Analysis ➞ | |
 | AOSL Alpha and Omega Semiconductor Limited |
| Sector: Technology | |
| SubSector: Semiconductor - Specialized | |
| MarketCap: 158.66 Millions | |
| Recent Price: 20.66 Smart Investing & Trading Score: 10 | |
| Day Percent Change: -3.23% Day Change: -0.69 | |
| Week Change: -4.88% Year-to-date Change: -20.7% | |
| AOSL Links: Profile News Message Board | |
| Charts:- Daily , Weekly | |
| Add AOSL to Watchlist: View: Get Complete AOSL Trend Analysis ➞ | |
 | COHU Cohu, Inc. |
| Sector: Technology | |
| SubSector: Semiconductor Equipment & Materials | |
| MarketCap: 519.518 Millions | |
| Recent Price: 29.74 Smart Investing & Trading Score: 10 | |
| Day Percent Change: -2.40% Day Change: -0.73 | |
| Week Change: -4.89% Year-to-date Change: -16.0% | |
| COHU Links: Profile News Message Board | |
| Charts:- Daily , Weekly | |
| Add COHU to Watchlist: View: Get Complete COHU Trend Analysis ➞ | |
 | NTGR NETGEAR, Inc. |
| Sector: Technology | |
| SubSector: Communication Equipment | |
| MarketCap: 558.839 Millions | |
| Recent Price: 13.96 Smart Investing & Trading Score: 5 | |
| Day Percent Change: -0.64% Day Change: -0.09 | |
| Week Change: -4.9% Year-to-date Change: -4.3% | |
| NTGR Links: Profile News Message Board | |
| Charts:- Daily , Weekly | |
| Add NTGR to Watchlist: View: Get Complete NTGR Trend Analysis ➞ | |
| For tabular summary view of above stock list: Summary View ➞ 0 - 25 , 25 - 50 , 50 - 75 , 75 - 100 , 100 - 125 , 125 - 150 , 150 - 175 , 175 - 200 , 200 - 225 , 225 - 250 , 250 - 275 , 275 - 300 , 300 - 325 , 325 - 350 , 350 - 375 , 375 - 400 , 400 - 425 , 425 - 450 , 450 - 475 , 475 - 500 , 500 - 525 , 525 - 550 , 550 - 575 , 575 - 600 , 600 - 625 , 625 - 650 | ||
| Click To Change The Sort Order: By Market Cap or Company Size Performance: Year-to-date, Week and Day | |
| Select Chart Type: | ||
|
Best Stocks Today 12Stocks.com |
© 2024 12Stocks.com Terms & Conditions Privacy Contact Us
All Information Provided Only For Education And Not To Be Used For Investing or Trading. See Terms & Conditions


One More Thing ... Get Best Stocks Delivered Daily!
Never Ever Miss A Move With Our Top Ten Stocks Lists
Find Best Stocks In Any Market - Bull or Bear Market
Take A Peek At Our Top Ten Stocks Lists: Daily, Weekly, Year-to-Date & Top Trends
Find Best Stocks In Any Market - Bull or Bear Market
Take A Peek At Our Top Ten Stocks Lists: Daily, Weekly, Year-to-Date & Top Trends
Technology Stocks With Best Up Trends [0-bearish to 100-bullish]: Zuora [100], GigaCloud [100], Inspire Medical[93], Allegro MicroSystems[93], Snap One[93], Encore Wire[93], NextNav [90], SYNNEX [88], Turkcell Iletisim[83], Model N[83], Benchmark Electronics[83]
Best Technology Stocks Year-to-Date:
MicroCloud Hologram[541.73%], MediaCo Holding[538.5%], Super Micro[237.75%], CXApp [223.55%], Smith Micro[136.08%], Uxin [133.95%], CuriosityStream [92.56%], GigaCloud [90.77%], D-Wave Quantum[90.34%], MicroStrategy [88.1%], SoundHound AI[85.28%] Best Technology Stocks This Week:
Snap One[29.85%], Mynaric AG[11.76%], Encore Wire[10.06%], Zuora [10%], Super Micro[6.85%], Applied Optoelectronics[6.68%], Luna Innovations[6.15%], NextNav [5.13%], Inspire Medical[5.08%], Sea [4.41%], Momo [4.15%] Best Technology Stocks Daily:
Zuora [11.69%], Inspire Medical[9.87%], MediaCo Holding[8.80%], Maxeon Solar[7.67%], CXApp [7.16%], FiscalNote [7.02%], Sunrun [4.99%], Snap [4.71%], Luna Innovations[4.55%], Cango [4.41%], Digital Turbine[4.20%]