
 Login Sign Up


| |||||
 |  | ||||

| 12Stocks.com Market Intelligence |
Best Tech Stocks
| In a hurry? Tech Stocks Lists: Performance & Trends, Stock Charts, FANG Stocks
Sort Tech stocks: Daily, Weekly, Year-to-Date, Market Cap & Trends. Filter Tech stocks list by size:All Tech Large Mid-Range Small and MicroCap |
| 12Stocks.com Tech Stocks Performances & Trends Daily | |||||||||
|
|  The overall Smart Investing & Trading Score is 45 (0-bearish to 100-bullish) which puts Technology sector in short term neutral trend. The Smart Investing & Trading Score from previous trading session is 38 and hence an improvement of trend.
| ||||||||
Here are the Smart Investing & Trading Scores of the most requested Technology stocks at 12Stocks.com (click stock name for detailed review):
|


| 12Stocks.com: Investing in Technology sector with Stocks | |
|
The following table helps investors and traders sort through current performance and trends (as measured by Smart Investing & Trading Score) of various
stocks in the Tech sector. Quick View: Move mouse or cursor over stock symbol (ticker) to view short-term technical chart and over stock name to view long term chart. Click on  to add stock symbol to your watchlist and to add stock symbol to your watchlist and  to view watchlist. Click on any ticker or stock name for detailed market intelligence report for that stock. to view watchlist. Click on any ticker or stock name for detailed market intelligence report for that stock. |
12Stocks.com Performance of Stocks in Tech Sector
| Ticker | Stock Name | Watchlist | Category | Recent Price | Smart Investing & Trading Score | Change % | Weekly Change% |
| ARQQ | Arqit Quantum |   | Software - Infrastructure | 0.49 | 61 | -3.57% | 2.97% |
| DT | Dynatrace | | Software | 46.74 | 57 | 1.06% | 2.95% |
| DOCU | DocuSign | | Software | 57.29 | 22 | 1.02% | 2.93% |
| NVT | nVent Electric | | Electronics | 73.72 | 48 | 1.65% | 2.92% |
| NICE | NICE | | Computer | 230.71 | 63 | 1.00% | 2.91% |
| VIOT | Viomi | | Electronic | 0.56 | 50 | 2.00% | 2.84% |
| FFIV | F5 Networks | | Software | 182.35 | 45 | 1.18% | 2.83% |
| SAIC | Science Applications | | IT | 128.47 | 62 | 0.30% | 2.83% |
| WK | Workiva | | Software | 80.06 | 57 | -0.29% | 2.83% |
| SPT | Sprout Social | | Software | 52.48 | 10 | 0.69% | 2.82% |
| YELP | Yelp | | Internet | 40.39 | 57 | 0.60% | 2.80% |
| OESX | Orion Energy | | Electronics | 0.88 | 20 | 4.00% | 2.79% |
| CNXC | Concentrix | | IT | 56.73 | 58 | 0.16% | 2.79% |
| CGNX | Cognex | | Instruments | 39.53 | 68 | -0.03% | 2.78% |
| NTCT | NetScout Systems | | Software | 19.97 | 50 | -0.15% | 2.78% |
| OTEX | Open Text | | Software | 36.02 | 49 | -0.19% | 2.77% |
| EVTC | EVERTEC | | Software | 38.83 | 67 | 0.49% | 2.75% |
| LOGI | Logitech | | Computer | 79.41 | 32 | 0.51% | 2.72% |
| CACI | CACI | | IT | 379.38 | 88 | -0.80% | 2.71% |
| HUBB | Hubbell | | Electronics | 398.55 | 63 | 0.14% | 2.71% |
| HIMX | Himax | | Semiconductor | 4.96 | 32 | 1.02% | 2.69% |
| ALKT | Alkami | | Software - | 24.42 | 70 | -0.49% | 2.69% |
| TRMB | Trimble | | Instruments | 59.51 | 68 | -0.30% | 2.66% |
| CCOI | Cogent | | Communication | 64.96 | 57 | 1.00% | 2.64% |
| MAX | MediaAlpha | | Internet Content & Information | 19.07 | 71 | 0.37% | 2.64% |
| For chart view version of above stock list: Chart View ➞ 0 - 25 , 25 - 50 , 50 - 75 , 75 - 100 , 100 - 125 , 125 - 150 , 150 - 175 , 175 - 200 , 200 - 225 , 225 - 250 , 250 - 275 , 275 - 300 , 300 - 325 , 325 - 350 , 350 - 375 , 375 - 400 , 400 - 425 , 425 - 450 , 450 - 475 , 475 - 500 , 500 - 525 , 525 - 550 , 550 - 575 , 575 - 600 , 600 - 625 , 625 - 650 | ||
 | Click To Change The Sort Order: By Market Cap or Company Size Performance: Year-to-date, Week and Day |  |
|
Get the most comprehensive stock market coverage daily at 12Stocks.com ➞ Best Stocks Today ➞ Best Stocks Weekly ➞ Best Stocks Year-to-Date ➞ Best Stocks Trends ➞  Best Stocks Today 12Stocks.com Best Nasdaq Stocks ➞ Best S&P 500 Stocks ➞ Best Tech Stocks ➞ Best Biotech Stocks ➞ |
| Detailed Overview of Tech Stocks |
| Tech Technical Overview, Leaders & Laggards, Top Tech ETF Funds & Detailed Tech Stocks List, Charts, Trends & More |
| Tech Sector: Technical Analysis, Trends & YTD Performance | |
| Technology sector is composed of stocks
from semiconductors, software, web, social media
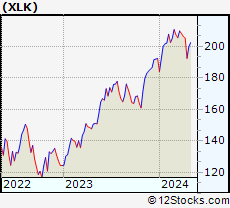
and services subsectors. Technology sector, as represented by XLK, an exchange-traded fund [ETF] that holds basket of tech stocks (e.g, Intel, Google) is up by 2.88% and is currently underperforming the overall market by -2.78% year-to-date. Below is a quick view of technical charts and trends: |
|
 XLK Weekly Chart |
|
| Long Term Trend: Good | |
| Medium Term Trend: Not Good | |
 XLK Daily Chart |
|
| Short Term Trend: Very Good | |
| Overall Trend Score: 45 | |
| YTD Performance: 2.88% | |
| **Trend Scores & Views Are Only For Educational Purposes And Not For Investing | |
| 12Stocks.com: Top Performing Technology Sector Stocks | ||||||||||||||||||||||||||||||||||||||||||||||||
 The top performing Technology sector stocks year to date are
Now, more recently, over last week, the top performing Technology sector stocks on the move are


|
||||||||||||||||||||||||||||||||||||||||||||||||
| 12Stocks.com: Investing in Tech Sector using Exchange Traded Funds | |
|
The following table shows list of key exchange traded funds (ETF) that
help investors track Tech Index. For detailed view, check out our ETF Funds section of our website. Quick View: Move mouse or cursor over ETF symbol (ticker) to view short-term technical chart and over ETF name to view long term chart. Click on ticker or stock name for detailed view. Click on to add stock symbol to your watchlist and to view watchlist. |
12Stocks.com List of ETFs that track Tech Index
| Ticker | ETF Name | Watchlist | Recent Price | Smart Investing & Trading Score | Change % | Week % | Year-to-date % |
| XLK | Technology | | 198.03 | 45 | 0.46 | 2.86 | 2.88% |
| QQQ | QQQ | | 426.51 | 58 | 0.34 | 2.86 | 4.15% |
| IYW | Technology | | 128.84 | 58 | 0.25 | 3.28 | 4.96% |
| VGT | Information Technology | | 495.24 | 45 | 0.16 | 3.2 | 2.32% |
| IXN | Global Tech | | 70.84 | 43 | 0.47 | 3.08 | 3.9% |
| IGV | Tech-Software | | 80.94 | 32 | 0.10 | 3.07 | -0.23% |
| XSD | Semiconductor | | 215.54 | 30 | 2.30 | 5.89 | -4.11% |
| TQQQ | QQQ | | 53.71 | 58 | 0.98 | 8.55 | 5.94% |
| SQQQ | Short QQQ | | 11.81 | 37 | -0.84 | -8.02 | -12.19% |
| SOXL | Semicondct Bull 3X | | 35.49 | 58 | 4.05 | 15.26 | 13.03% |
| SOXS | Semicondct Bear 3X | | 39.61 | 58 | -3.81 | -14.13 | 580.58% |
| SOXX | PHLX Semiconductor | | 208.54 | 58 | 1.30 | 5.12 | 8.6% |
| QTEC | First -100-Tech | | 181.14 | 58 | 0.69 | 4.14 | 3.23% |
| SMH | Semiconductor | | 208.04 | 58 | 0.12 | 4.43 | 18.97% |
| 12Stocks.com: Charts, Trends, Fundamental Data and Performances of Tech Stocks | |
|
We now take in-depth look at all Tech stocks including charts, multi-period performances and overall trends (as measured by Smart Investing & Trading Score). One can sort Tech stocks (click link to choose) by Daily, Weekly and by Year-to-Date performances. Also, one can sort by size of the company or by market capitalization. |
| Select Your Default Chart Type: | |||||
| |||||
| Click on stock symbol or name for detailed view. Click on to add stock symbol to your watchlist and to view watchlist. Quick View: Move mouse or cursor over "Daily" to quickly view daily technical stock chart and over "Weekly" to view weekly technical stock chart. | |||||


 | ARQQ Arqit Quantum Inc. |
| Sector: Technology | |
| SubSector: Software - Infrastructure | |
| MarketCap: 165 Millions | |
| Recent Price: 0.49 Smart Investing & Trading Score: 61 | |
| Day Percent Change: -3.57% Day Change: -0.02 | |
| Week Change: 2.97% Year-to-date Change: 6.2% | |
| ARQQ Links: Profile News Message Board | |
| Charts:- Daily , Weekly | |
| Add ARQQ to Watchlist: View: Get Complete ARQQ Trend Analysis ➞ | |
 | DT Dynatrace, Inc. |
| Sector: Technology | |
| SubSector: Application Software | |
| MarketCap: 7007.12 Millions | |
| Recent Price: 46.74 Smart Investing & Trading Score: 57 | |
| Day Percent Change: 1.06% Day Change: 0.49 | |
| Week Change: 2.95% Year-to-date Change: -14.5% | |
| DT Links: Profile News Message Board | |
| Charts:- Daily , Weekly | |
| Add DT to Watchlist: View: Get Complete DT Trend Analysis ➞ | |
 | DOCU DocuSign, Inc. |
| Sector: Technology | |
| SubSector: Business Software & Services | |
| MarketCap: 15618.8 Millions | |
| Recent Price: 57.29 Smart Investing & Trading Score: 22 | |
| Day Percent Change: 1.02% Day Change: 0.58 | |
| Week Change: 2.93% Year-to-date Change: -3.6% | |
| DOCU Links: Profile News Message Board | |
| Charts:- Daily , Weekly | |
| Add DOCU to Watchlist: View: Get Complete DOCU Trend Analysis ➞ | |
 | NVT nVent Electric plc |
| Sector: Technology | |
| SubSector: Diversified Electronics | |
| MarketCap: 2752.86 Millions | |
| Recent Price: 73.72 Smart Investing & Trading Score: 48 | |
| Day Percent Change: 1.65% Day Change: 1.20 | |
| Week Change: 2.92% Year-to-date Change: 24.8% | |
| NVT Links: Profile News Message Board | |
| Charts:- Daily , Weekly | |
| Add NVT to Watchlist: View: Get Complete NVT Trend Analysis ➞ | |
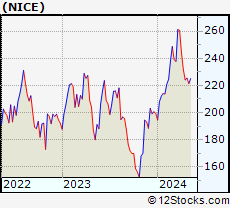 | NICE NICE Ltd. |
| Sector: Technology | |
| SubSector: Computer Peripherals | |
| MarketCap: 8637.89 Millions | |
| Recent Price: 230.71 Smart Investing & Trading Score: 63 | |
| Day Percent Change: 1.00% Day Change: 2.28 | |
| Week Change: 2.91% Year-to-date Change: 15.6% | |
| NICE Links: Profile News Message Board | |
| Charts:- Daily , Weekly | |
| Add NICE to Watchlist: View: Get Complete NICE Trend Analysis ➞ | |
 | VIOT Viomi Technology Co., Ltd |
| Sector: Technology | |
| SubSector: Electronic Equipment | |
| MarketCap: 357.2 Millions | |
| Recent Price: 0.56 Smart Investing & Trading Score: 50 | |
| Day Percent Change: 2.00% Day Change: 0.01 | |
| Week Change: 2.84% Year-to-date Change: -43.9% | |
| VIOT Links: Profile News Message Board | |
| Charts:- Daily , Weekly | |
| Add VIOT to Watchlist: View: Get Complete VIOT Trend Analysis ➞ | |
 | FFIV F5 Networks, Inc. |
| Sector: Technology | |
| SubSector: Business Software & Services | |
| MarketCap: 6675.38 Millions | |
| Recent Price: 182.35 Smart Investing & Trading Score: 45 | |
| Day Percent Change: 1.18% Day Change: 2.12 | |
| Week Change: 2.83% Year-to-date Change: 1.9% | |
| FFIV Links: Profile News Message Board | |
| Charts:- Daily , Weekly | |
| Add FFIV to Watchlist: View: Get Complete FFIV Trend Analysis ➞ | |
 | SAIC Science Applications International Corporation |
| Sector: Technology | |
| SubSector: Information Technology Services | |
| MarketCap: 3388.78 Millions | |
| Recent Price: 128.47 Smart Investing & Trading Score: 62 | |
| Day Percent Change: 0.30% Day Change: 0.39 | |
| Week Change: 2.83% Year-to-date Change: 3.3% | |
| SAIC Links: Profile News Message Board | |
| Charts:- Daily , Weekly | |
| Add SAIC to Watchlist: View: Get Complete SAIC Trend Analysis ➞ | |
 | WK Workiva Inc. |
| Sector: Technology | |
| SubSector: Application Software | |
| MarketCap: 1537.42 Millions | |
| Recent Price: 80.06 Smart Investing & Trading Score: 57 | |
| Day Percent Change: -0.29% Day Change: -0.23 | |
| Week Change: 2.83% Year-to-date Change: -21.2% | |
| WK Links: Profile News Message Board | |
| Charts:- Daily , Weekly | |
| Add WK to Watchlist: View: Get Complete WK Trend Analysis ➞ | |
 | SPT Sprout Social, Inc. |
| Sector: Technology | |
| SubSector: Software Application | |
| MarketCap: 25087 Millions | |
| Recent Price: 52.48 Smart Investing & Trading Score: 10 | |
| Day Percent Change: 0.69% Day Change: 0.36 | |
| Week Change: 2.82% Year-to-date Change: -14.6% | |
| SPT Links: Profile News Message Board | |
| Charts:- Daily , Weekly | |
| Add SPT to Watchlist: View: Get Complete SPT Trend Analysis ➞ | |
 | YELP Yelp Inc. |
| Sector: Technology | |
| SubSector: Internet Information Providers | |
| MarketCap: 1430.1 Millions | |
| Recent Price: 40.39 Smart Investing & Trading Score: 57 | |
| Day Percent Change: 0.60% Day Change: 0.24 | |
| Week Change: 2.8% Year-to-date Change: -14.7% | |
| YELP Links: Profile News Message Board | |
| Charts:- Daily , Weekly | |
| Add YELP to Watchlist: View: Get Complete YELP Trend Analysis ➞ | |
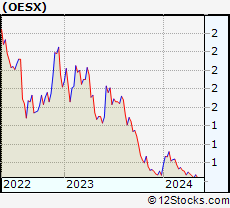 | OESX Orion Energy Systems, Inc. |
| Sector: Technology | |
| SubSector: Diversified Electronics | |
| MarketCap: 121.396 Millions | |
| Recent Price: 0.88 Smart Investing & Trading Score: 20 | |
| Day Percent Change: 4.00% Day Change: 0.03 | |
| Week Change: 2.79% Year-to-date Change: 2.0% | |
| OESX Links: Profile News Message Board | |
| Charts:- Daily , Weekly | |
| Add OESX to Watchlist: View: Get Complete OESX Trend Analysis ➞ | |
 | CNXC Concentrix Corporation |
| Sector: Technology | |
| SubSector: Information Technology Services | |
| MarketCap: 51987 Millions | |
| Recent Price: 56.73 Smart Investing & Trading Score: 58 | |
| Day Percent Change: 0.16% Day Change: 0.09 | |
| Week Change: 2.79% Year-to-date Change: -42.2% | |
| CNXC Links: Profile News Message Board | |
| Charts:- Daily , Weekly | |
| Add CNXC to Watchlist: View: Get Complete CNXC Trend Analysis ➞ | |
 | CGNX Cognex Corporation |
| Sector: Technology | |
| SubSector: Scientific & Technical Instruments | |
| MarketCap: 7373.13 Millions | |
| Recent Price: 39.53 Smart Investing & Trading Score: 68 | |
| Day Percent Change: -0.03% Day Change: -0.01 | |
| Week Change: 2.78% Year-to-date Change: -5.3% | |
| CGNX Links: Profile News Message Board | |
| Charts:- Daily , Weekly | |
| Add CGNX to Watchlist: View: Get Complete CGNX Trend Analysis ➞ | |
 | NTCT NetScout Systems, Inc. |
| Sector: Technology | |
| SubSector: Business Software & Services | |
| MarketCap: 1657.28 Millions | |
| Recent Price: 19.97 Smart Investing & Trading Score: 50 | |
| Day Percent Change: -0.15% Day Change: -0.03 | |
| Week Change: 2.78% Year-to-date Change: -9.0% | |
| NTCT Links: Profile News Message Board | |
| Charts:- Daily , Weekly | |
| Add NTCT to Watchlist: View: Get Complete NTCT Trend Analysis ➞ | |
 | OTEX Open Text Corporation |
| Sector: Technology | |
| SubSector: Application Software | |
| MarketCap: 9291.92 Millions | |
| Recent Price: 36.02 Smart Investing & Trading Score: 49 | |
| Day Percent Change: -0.19% Day Change: -0.07 | |
| Week Change: 2.77% Year-to-date Change: -14.3% | |
| OTEX Links: Profile News Message Board | |
| Charts:- Daily , Weekly | |
| Add OTEX to Watchlist: View: Get Complete OTEX Trend Analysis ➞ | |
 | EVTC EVERTEC, Inc. |
| Sector: Technology | |
| SubSector: Business Software & Services | |
| MarketCap: 1646.08 Millions | |
| Recent Price: 38.83 Smart Investing & Trading Score: 67 | |
| Day Percent Change: 0.49% Day Change: 0.19 | |
| Week Change: 2.75% Year-to-date Change: -5.2% | |
| EVTC Links: Profile News Message Board | |
| Charts:- Daily , Weekly | |
| Add EVTC to Watchlist: View: Get Complete EVTC Trend Analysis ➞ | |
 | LOGI Logitech International S.A. |
| Sector: Technology | |
| SubSector: Computer Peripherals | |
| MarketCap: 7998.19 Millions | |
| Recent Price: 79.41 Smart Investing & Trading Score: 32 | |
| Day Percent Change: 0.51% Day Change: 0.40 | |
| Week Change: 2.72% Year-to-date Change: -16.5% | |
| LOGI Links: Profile News Message Board | |
| Charts:- Daily , Weekly | |
| Add LOGI to Watchlist: View: Get Complete LOGI Trend Analysis ➞ | |
 | CACI CACI International Inc |
| Sector: Technology | |
| SubSector: Information Technology Services | |
| MarketCap: 5211.58 Millions | |
| Recent Price: 379.38 Smart Investing & Trading Score: 88 | |
| Day Percent Change: -0.80% Day Change: -3.05 | |
| Week Change: 2.71% Year-to-date Change: 17.1% | |
| CACI Links: Profile News Message Board | |
| Charts:- Daily , Weekly | |
| Add CACI to Watchlist: View: Get Complete CACI Trend Analysis ➞ | |
 | HUBB Hubbell Incorporated |
| Sector: Technology | |
| SubSector: Diversified Electronics | |
| MarketCap: 6002.46 Millions | |
| Recent Price: 398.55 Smart Investing & Trading Score: 63 | |
| Day Percent Change: 0.14% Day Change: 0.55 | |
| Week Change: 2.71% Year-to-date Change: 21.2% | |
| HUBB Links: Profile News Message Board | |
| Charts:- Daily , Weekly | |
| Add HUBB to Watchlist: View: Get Complete HUBB Trend Analysis ➞ | |
 | HIMX Himax Technologies, Inc. |
| Sector: Technology | |
| SubSector: Semiconductor - Specialized | |
| MarketCap: 496.16 Millions | |
| Recent Price: 4.96 Smart Investing & Trading Score: 32 | |
| Day Percent Change: 1.02% Day Change: 0.05 | |
| Week Change: 2.69% Year-to-date Change: -18.3% | |
| HIMX Links: Profile News Message Board | |
| Charts:- Daily , Weekly | |
| Add HIMX to Watchlist: View: Get Complete HIMX Trend Analysis ➞ | |
 | ALKT Alkami Technology, Inc. |
| Sector: Technology | |
| SubSector: Software - Application | |
| MarketCap: 1530 Millions | |
| Recent Price: 24.42 Smart Investing & Trading Score: 70 | |
| Day Percent Change: -0.49% Day Change: -0.12 | |
| Week Change: 2.69% Year-to-date Change: 1.0% | |
| ALKT Links: Profile News Message Board | |
| Charts:- Daily , Weekly | |
| Add ALKT to Watchlist: View: Get Complete ALKT Trend Analysis ➞ | |
 | TRMB Trimble Inc. |
| Sector: Technology | |
| SubSector: Scientific & Technical Instruments | |
| MarketCap: 7990.33 Millions | |
| Recent Price: 59.51 Smart Investing & Trading Score: 68 | |
| Day Percent Change: -0.30% Day Change: -0.18 | |
| Week Change: 2.66% Year-to-date Change: 11.9% | |
| TRMB Links: Profile News Message Board | |
| Charts:- Daily , Weekly | |
| Add TRMB to Watchlist: View: Get Complete TRMB Trend Analysis ➞ | |
 | CCOI Cogent Communications Holdings, Inc. |
| Sector: Technology | |
| SubSector: Diversified Communication Services | |
| MarketCap: 3868.14 Millions | |
| Recent Price: 64.96 Smart Investing & Trading Score: 57 | |
| Day Percent Change: 1.00% Day Change: 0.64 | |
| Week Change: 2.64% Year-to-date Change: -14.6% | |
| CCOI Links: Profile News Message Board | |
| Charts:- Daily , Weekly | |
| Add CCOI to Watchlist: View: Get Complete CCOI Trend Analysis ➞ | |
 | MAX MediaAlpha, Inc. |
| Sector: Technology | |
| SubSector: Internet Content & Information | |
| MarketCap: 22537 Millions | |
| Recent Price: 19.07 Smart Investing & Trading Score: 71 | |
| Day Percent Change: 0.37% Day Change: 0.07 | |
| Week Change: 2.64% Year-to-date Change: 71.5% | |
| MAX Links: Profile News Message Board | |
| Charts:- Daily , Weekly | |
| Add MAX to Watchlist: View: Get Complete MAX Trend Analysis ➞ | |
| For tabular summary view of above stock list: Summary View ➞ 0 - 25 , 25 - 50 , 50 - 75 , 75 - 100 , 100 - 125 , 125 - 150 , 150 - 175 , 175 - 200 , 200 - 225 , 225 - 250 , 250 - 275 , 275 - 300 , 300 - 325 , 325 - 350 , 350 - 375 , 375 - 400 , 400 - 425 , 425 - 450 , 450 - 475 , 475 - 500 , 500 - 525 , 525 - 550 , 550 - 575 , 575 - 600 , 600 - 625 , 625 - 650 | ||
| Click To Change The Sort Order: By Market Cap or Company Size Performance: Year-to-date, Week and Day | |
| Select Chart Type: | ||
|
Best Stocks Today 12Stocks.com |
© 2024 12Stocks.com Terms & Conditions Privacy Contact Us
All Information Provided Only For Education And Not To Be Used For Investing or Trading. See Terms & Conditions


One More Thing ... Get Best Stocks Delivered Daily!
Never Ever Miss A Move With Our Top Ten Stocks Lists
Find Best Stocks In Any Market - Bull or Bear Market
Take A Peek At Our Top Ten Stocks Lists: Daily, Weekly, Year-to-Date & Top Trends
Find Best Stocks In Any Market - Bull or Bear Market
Take A Peek At Our Top Ten Stocks Lists: Daily, Weekly, Year-to-Date & Top Trends
Technology Stocks With Best Up Trends [0-bearish to 100-bullish]: Amesite [100], Ribbon [100], Allegro MicroSystems[100], Texas [100], Microchip [100], EchoStar [100], Analog Devices[100], Vishay Inter[100], JD.com [100], Sea [100], Jamf Holding[100]
Best Technology Stocks Year-to-Date:
Pagaya [581.02%], MicroCloud Hologram[574.82%], MediaCo Holding[364.79%], Uxin [169.61%], CXApp [167.95%], Super Micro[165.5%], Smith Micro[162.71%], SoundHound AI[103.27%], MicroStrategy [100.38%], GigaCloud [96.01%], NextNav [95.73%] Best Technology Stocks This Week:
Matterport [166.09%], Amesite [69.72%], WiMi Hologram[64.85%], Ribbon [25.97%], HashiCorp [23.7%], SoundHound AI[22.54%], Intchains [20.36%], iQIYI [17.99%], Bilibili [16.87%], FTC Solar[16.56%], BigBear.ai [16.55%] Best Technology Stocks Daily:
Amesite [65.50%], WiMi Hologram[58.53%], Ribbon [26.46%], Intchains [22.28%], Uxin [13.86%], Bilibili [10.97%], Comtech Tele[10.76%], Mitcham Industries[9.88%], Navitas Semiconductor[8.83%], FTC Solar[8.51%], AMTD Digital[8.33%]