
 Login Sign Up


| |||||
 |  | ||||

| 12Stocks.com Market Intelligence |
Best Tech Stocks
| In a hurry? Tech Stocks Lists: Performance & Trends, Stock Charts, FANG Stocks
Sort Tech stocks: Daily, Weekly, Year-to-Date, Market Cap & Trends. Filter Tech stocks list by size:All Tech Large Mid-Range Small and MicroCap |
| 12Stocks.com Tech Stocks Performances & Trends Daily | |||||||||
|
|  The overall Smart Investing & Trading Score is 0 (0-bearish to 100-bullish) which puts Technology sector in short term bearish trend. The Smart Investing & Trading Score from previous trading session is 13 and hence a deterioration of trend.
| ||||||||
Here are the Smart Investing & Trading Scores of the most requested Technology stocks at 12Stocks.com (click stock name for detailed review):
|


| 12Stocks.com: Investing in Technology sector with Stocks | |
|
The following table helps investors and traders sort through current performance and trends (as measured by Smart Investing & Trading Score) of various
stocks in the Tech sector. Quick View: Move mouse or cursor over stock symbol (ticker) to view short-term technical chart and over stock name to view long term chart. Click on  to add stock symbol to your watchlist and to add stock symbol to your watchlist and  to view watchlist. Click on any ticker or stock name for detailed market intelligence report for that stock. to view watchlist. Click on any ticker or stock name for detailed market intelligence report for that stock. |
12Stocks.com Performance of Stocks in Tech Sector
| Ticker | Stock Name | Watchlist | Category | Recent Price | Smart Investing & Trading Score | Change % | YTD Change% |
| PLUS | ePlus |   | Software | 75.37 | 13 | 0.12% | -5.60% |
| TER | Teradyne | | Semiconductor | 95.97 | 13 | -4.22% | -11.56% |
| SEMR | Semrush | | Software - | 11.50 | 13 | -3.08% | -17.21% |
| MSFT | Microsoft | | Software | 399.12 | 13 | -1.27% | 6.14% |
| CHT | Chunghwa Telecom | | Telecom | 37.85 | 13 | -0.81% | -3.12% |
| COGT | Cogint | | Software | 6.71 | 12 | 1.51% | 14.12% |
| PGNY | Progyny | | Healthcare Information | 32.68 | 10 | 2.51% | -12.10% |
| OCFT | OneConnect Financial | | Software | 1.89 | 10 | 2.16% | -40.00% |
| TENB | Tenable | | Software | 44.83 | 10 | 1.68% | -2.67% |
| LASR | nLIGHT | | Semiconductor | 10.87 | 10 | 1.68% | -19.48% |
| GSAT | Globalstar | | Wireless | 1.27 | 10 | 1.60% | -34.54% |
| EGHT | 8x8 | | Communication | 2.18 | 10 | 1.40% | -42.33% |
| RUN | Sunrun | | Semiconductor | 10.25 | 10 | 1.38% | -47.78% |
| CNDT | Conduent | | IT | 3.06 | 10 | 1.32% | -16.16% |
| GDYN | Grid Dynamics | | IT | 10.35 | 10 | 1.17% | -22.36% |
| ASUR | Asure Software | | Software | 6.99 | 10 | 0.58% | -26.58% |
| PTC | PTC | | Software | 176.37 | 10 | 0.38% | 0.81% |
| VRNS | Varonis Systems | | Software | 43.34 | 10 | 0.37% | -4.28% |
| HKD | AMTD Digital | | Software - | 3.08 | 10 | 0.33% | -25.42% |
| EXTR | Extreme Networks | | Communication | 10.97 | 10 | 0.27% | -37.81% |
| STNE | StoneCo | | Software | 15.30 | 10 | 0.26% | -15.14% |
| CRNC | Cerence | | Software | 10.37 | 10 | 0.19% | -47.25% |
| IBM | IBM | | IT | 181.58 | 10 | 0.06% | 11.02% |
| Z | Zillow | | Internet | 41.82 | 10 | 0.02% | -27.72% |
| TIGR | UP Fintech | | Software | 3.15 | 10 | 0.00% | -28.73% |
| For chart view version of above stock list: Chart View ➞ 0 - 25 , 25 - 50 , 50 - 75 , 75 - 100 , 100 - 125 , 125 - 150 , 150 - 175 , 175 - 200 , 200 - 225 , 225 - 250 , 250 - 275 , 275 - 300 , 300 - 325 , 325 - 350 , 350 - 375 , 375 - 400 , 400 - 425 , 425 - 450 , 450 - 475 , 475 - 500 , 500 - 525 , 525 - 550 , 550 - 575 , 575 - 600 , 600 - 625 , 625 - 650 | ||
 | Click To Change The Sort Order: By Market Cap or Company Size Performance: Year-to-date, Week and Day |  |
|
Get the most comprehensive stock market coverage daily at 12Stocks.com ➞ Best Stocks Today ➞ Best Stocks Weekly ➞ Best Stocks Year-to-Date ➞ Best Stocks Trends ➞  Best Stocks Today 12Stocks.com Best Nasdaq Stocks ➞ Best S&P 500 Stocks ➞ Best Tech Stocks ➞ Best Biotech Stocks ➞ |
| Detailed Overview of Tech Stocks |
| Tech Technical Overview, Leaders & Laggards, Top Tech ETF Funds & Detailed Tech Stocks List, Charts, Trends & More |
| Tech Sector: Technical Analysis, Trends & YTD Performance | |
| Technology sector is composed of stocks
from semiconductors, software, web, social media
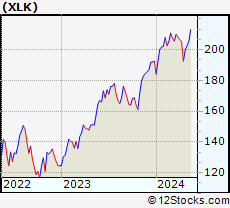
and services subsectors. Technology sector, as represented by XLK, an exchange-traded fund [ETF] that holds basket of tech stocks (e.g, Intel, Google) is up by 0.03% and is currently underperforming the overall market by -3.35% year-to-date. Below is a quick view of technical charts and trends: |
|
 XLK Weekly Chart |
|
| Long Term Trend: Not Good | |
| Medium Term Trend: Not Good | |
 XLK Daily Chart |
|
| Short Term Trend: Not Good | |
| Overall Trend Score: 0 | |
| YTD Performance: 0.03% | |
| **Trend Scores & Views Are Only For Educational Purposes And Not For Investing | |
| 12Stocks.com: Top Performing Technology Sector Stocks | ||||||||||||||||||||||||||||||||||||||||||||||||
 The top performing Technology sector stocks year to date are
Now, more recently, over last week, the top performing Technology sector stocks on the move are


|
||||||||||||||||||||||||||||||||||||||||||||||||
| 12Stocks.com: Investing in Tech Sector using Exchange Traded Funds | |
|
The following table shows list of key exchange traded funds (ETF) that
help investors track Tech Index. For detailed view, check out our ETF Funds section of our website. Quick View: Move mouse or cursor over ETF symbol (ticker) to view short-term technical chart and over ETF name to view long term chart. Click on ticker or stock name for detailed view. Click on to add stock symbol to your watchlist and to view watchlist. |
12Stocks.com List of ETFs that track Tech Index
| Ticker | ETF Name | Watchlist | Recent Price | Smart Investing & Trading Score | Change % | Week % | Year-to-date % |
| XLK | Technology | | 192.53 | 0 | -2.06 | -6.27 | 0.03% |
| QQQ | QQQ | | 414.65 | 13 | -2.07 | -5.39 | 1.25% |
| IYW | Technology | | 124.75 | 0 | -2.85 | -6.87 | 1.63% |
| VGT | Information Technology | | 479.90 | 0 | -2.65 | -6.76 | -0.85% |
| IXN | Global Tech | | 68.72 | 0 | -2.65 | -6.88 | 0.79% |
| IGV | Tech-Software | | 78.53 | 0 | -1.22 | -5.11 | -3.2% |
| XSD | Semiconductor | | 203.56 | 0 | -3.15 | -8.78 | -9.44% |
| TQQQ | QQQ | | 49.48 | 0 | -6.20 | -15.74 | -2.41% |
| SQQQ | Short QQQ | | 12.84 | 82 | 6.38 | 17.91 | -4.54% |
| SOXL | Semicondct Bull 3X | | 30.79 | 0 | -11.80 | -25.83 | -1.94% |
| SOXS | Semicondct Bear 3X | | 46.13 | 90 | 11.78 | 1210.51 | 692.61% |
| SOXX | PHLX Semiconductor | | 198.39 | 26 | -3.99 | -9.02 | 3.31% |
| QTEC | First -100-Tech | | 173.94 | 0 | -2.21 | -6.49 | -0.87% |
| SMH | Semiconductor | | 199.21 | 26 | -4.52 | -9.73 | 13.92% |
| 12Stocks.com: Charts, Trends, Fundamental Data and Performances of Tech Stocks | |
|
We now take in-depth look at all Tech stocks including charts, multi-period performances and overall trends (as measured by Smart Investing & Trading Score). One can sort Tech stocks (click link to choose) by Daily, Weekly and by Year-to-Date performances. Also, one can sort by size of the company or by market capitalization. |
| Select Your Default Chart Type: | |||||
| |||||
| Click on stock symbol or name for detailed view. Click on to add stock symbol to your watchlist and to view watchlist. Quick View: Move mouse or cursor over "Daily" to quickly view daily technical stock chart and over "Weekly" to view weekly technical stock chart. | |||||


 | PLUS ePlus inc. |
| Sector: Technology | |
| SubSector: Application Software | |
| MarketCap: 728.262 Millions | |
| Recent Price: 75.37 Smart Investing & Trading Score: 13 | |
| Day Percent Change: 0.12% Day Change: 0.09 | |
| Week Change: -2.21% Year-to-date Change: -5.6% | |
| PLUS Links: Profile News Message Board | |
| Charts:- Daily , Weekly | |
| Add PLUS to Watchlist: View: Get Complete PLUS Trend Analysis ➞ | |
 | TER Teradyne, Inc. |
| Sector: Technology | |
| SubSector: Semiconductor Equipment & Materials | |
| MarketCap: 8135.68 Millions | |
| Recent Price: 95.97 Smart Investing & Trading Score: 13 | |
| Day Percent Change: -4.22% Day Change: -4.23 | |
| Week Change: -9.35% Year-to-date Change: -11.6% | |
| TER Links: Profile News Message Board | |
| Charts:- Daily , Weekly | |
| Add TER to Watchlist: View: Get Complete TER Trend Analysis ➞ | |
 | SEMR Semrush Holdings, Inc. |
| Sector: Technology | |
| SubSector: Software - Application | |
| MarketCap: 1330 Millions | |
| Recent Price: 11.50 Smart Investing & Trading Score: 13 | |
| Day Percent Change: -3.08% Day Change: -0.37 | |
| Week Change: -6.73% Year-to-date Change: -17.2% | |
| SEMR Links: Profile News Message Board | |
| Charts:- Daily , Weekly | |
| Add SEMR to Watchlist: View: Get Complete SEMR Trend Analysis ➞ | |
 | MSFT Microsoft Corporation |
| Sector: Technology | |
| SubSector: Business Software & Services | |
| MarketCap: 1154150 Millions | |
| Recent Price: 399.12 Smart Investing & Trading Score: 13 | |
| Day Percent Change: -1.27% Day Change: -5.15 | |
| Week Change: -5.4% Year-to-date Change: 6.1% | |
| MSFT Links: Profile News Message Board | |
| Charts:- Daily , Weekly | |
| Add MSFT to Watchlist: View: Get Complete MSFT Trend Analysis ➞ | |
 | CHT Chunghwa Telecom Co., Ltd. |
| Sector: Technology | |
| SubSector: Telecom Services - Domestic | |
| MarketCap: 28101.3 Millions | |
| Recent Price: 37.85 Smart Investing & Trading Score: 13 | |
| Day Percent Change: -0.81% Day Change: -0.31 | |
| Week Change: -1.69% Year-to-date Change: -3.1% | |
| CHT Links: Profile News Message Board | |
| Charts:- Daily , Weekly | |
| Add CHT to Watchlist: View: Get Complete CHT Trend Analysis ➞ | |
 | COGT Cogint, Inc. |
| Sector: Technology | |
| SubSector: Business Software & Services | |
| MarketCap: 214.55 Millions | |
| Recent Price: 6.71 Smart Investing & Trading Score: 12 | |
| Day Percent Change: 1.51% Day Change: 0.10 | |
| Week Change: 3.07% Year-to-date Change: 14.1% | |
| COGT Links: Profile News Message Board | |
| Charts:- Daily , Weekly | |
| Add COGT to Watchlist: View: Get Complete COGT Trend Analysis ➞ | |
 | PGNY Progyny, Inc. |
| Sector: Technology | |
| SubSector: Healthcare Information Services | |
| MarketCap: 1839.05 Millions | |
| Recent Price: 32.68 Smart Investing & Trading Score: 10 | |
| Day Percent Change: 2.51% Day Change: 0.80 | |
| Week Change: -4.44% Year-to-date Change: -12.1% | |
| PGNY Links: Profile News Message Board | |
| Charts:- Daily , Weekly | |
| Add PGNY to Watchlist: View: Get Complete PGNY Trend Analysis ➞ | |
 | OCFT OneConnect Financial Technology Co., Ltd. |
| Sector: Technology | |
| SubSector: Software Application | |
| MarketCap: 80387 Millions | |
| Recent Price: 1.89 Smart Investing & Trading Score: 10 | |
| Day Percent Change: 2.16% Day Change: 0.04 | |
| Week Change: -3.08% Year-to-date Change: -40.0% | |
| OCFT Links: Profile News Message Board | |
| Charts:- Daily , Weekly | |
| Add OCFT to Watchlist: View: Get Complete OCFT Trend Analysis ➞ | |
 | TENB Tenable Holdings, Inc. |
| Sector: Technology | |
| SubSector: Business Software & Services | |
| MarketCap: 1986.68 Millions | |
| Recent Price: 44.83 Smart Investing & Trading Score: 10 | |
| Day Percent Change: 1.68% Day Change: 0.74 | |
| Week Change: -7.59% Year-to-date Change: -2.7% | |
| TENB Links: Profile News Message Board | |
| Charts:- Daily , Weekly | |
| Add TENB to Watchlist: View: Get Complete TENB Trend Analysis ➞ | |
 | LASR nLIGHT, Inc. |
| Sector: Technology | |
| SubSector: Semiconductor - Broad Line | |
| MarketCap: 445.642 Millions | |
| Recent Price: 10.87 Smart Investing & Trading Score: 10 | |
| Day Percent Change: 1.68% Day Change: 0.18 | |
| Week Change: -6.86% Year-to-date Change: -19.5% | |
| LASR Links: Profile News Message Board | |
| Charts:- Daily , Weekly | |
| Add LASR to Watchlist: View: Get Complete LASR Trend Analysis ➞ | |
 | GSAT Globalstar, Inc. |
| Sector: Technology | |
| SubSector: Wireless Communications | |
| MarketCap: 485.127 Millions | |
| Recent Price: 1.27 Smart Investing & Trading Score: 10 | |
| Day Percent Change: 1.60% Day Change: 0.02 | |
| Week Change: -4.51% Year-to-date Change: -34.5% | |
| GSAT Links: Profile News Message Board | |
| Charts:- Daily , Weekly | |
| Add GSAT to Watchlist: View: Get Complete GSAT Trend Analysis ➞ | |
 | EGHT 8x8, Inc. |
| Sector: Technology | |
| SubSector: Diversified Communication Services | |
| MarketCap: 1861.64 Millions | |
| Recent Price: 2.18 Smart Investing & Trading Score: 10 | |
| Day Percent Change: 1.40% Day Change: 0.03 | |
| Week Change: -6.44% Year-to-date Change: -42.3% | |
| EGHT Links: Profile News Message Board | |
| Charts:- Daily , Weekly | |
| Add EGHT to Watchlist: View: Get Complete EGHT Trend Analysis ➞ | |
 | RUN Sunrun Inc. |
| Sector: Technology | |
| SubSector: Semiconductor - Specialized | |
| MarketCap: 1286.2 Millions | |
| Recent Price: 10.25 Smart Investing & Trading Score: 10 | |
| Day Percent Change: 1.38% Day Change: 0.14 | |
| Week Change: -11.94% Year-to-date Change: -47.8% | |
| RUN Links: Profile News Message Board | |
| Charts:- Daily , Weekly | |
| Add RUN to Watchlist: View: Get Complete RUN Trend Analysis ➞ | |
 | CNDT Conduent Incorporated |
| Sector: Technology | |
| SubSector: Information Technology Services | |
| MarketCap: 514.968 Millions | |
| Recent Price: 3.06 Smart Investing & Trading Score: 10 | |
| Day Percent Change: 1.32% Day Change: 0.04 | |
| Week Change: -4.38% Year-to-date Change: -16.2% | |
| CNDT Links: Profile News Message Board | |
| Charts:- Daily , Weekly | |
| Add CNDT to Watchlist: View: Get Complete CNDT Trend Analysis ➞ | |
 | GDYN Grid Dynamics Holdings, Inc. |
| Sector: Technology | |
| SubSector: Information Technology Services | |
| MarketCap: 318.968 Millions | |
| Recent Price: 10.35 Smart Investing & Trading Score: 10 | |
| Day Percent Change: 1.17% Day Change: 0.12 | |
| Week Change: -7.17% Year-to-date Change: -22.4% | |
| GDYN Links: Profile News Message Board | |
| Charts:- Daily , Weekly | |
| Add GDYN to Watchlist: View: Get Complete GDYN Trend Analysis ➞ | |
 | ASUR Asure Software, Inc. |
| Sector: Technology | |
| SubSector: Business Software & Services | |
| MarketCap: 103.758 Millions | |
| Recent Price: 6.99 Smart Investing & Trading Score: 10 | |
| Day Percent Change: 0.58% Day Change: 0.04 | |
| Week Change: -4.25% Year-to-date Change: -26.6% | |
| ASUR Links: Profile News Message Board | |
| Charts:- Daily , Weekly | |
| Add ASUR to Watchlist: View: Get Complete ASUR Trend Analysis ➞ | |
 | PTC PTC Inc. |
| Sector: Technology | |
| SubSector: Technical & System Software | |
| MarketCap: 6166.7 Millions | |
| Recent Price: 176.37 Smart Investing & Trading Score: 10 | |
| Day Percent Change: 0.38% Day Change: 0.67 | |
| Week Change: -2.05% Year-to-date Change: 0.8% | |
| PTC Links: Profile News Message Board | |
| Charts:- Daily , Weekly | |
| Add PTC to Watchlist: View: Get Complete PTC Trend Analysis ➞ | |
 | VRNS Varonis Systems, Inc. |
| Sector: Technology | |
| SubSector: Technical & System Software | |
| MarketCap: 1715 Millions | |
| Recent Price: 43.34 Smart Investing & Trading Score: 10 | |
| Day Percent Change: 0.37% Day Change: 0.16 | |
| Week Change: -2.65% Year-to-date Change: -4.3% | |
| VRNS Links: Profile News Message Board | |
| Charts:- Daily , Weekly | |
| Add VRNS to Watchlist: View: Get Complete VRNS Trend Analysis ➞ | |
 | HKD AMTD Digital Inc. |
| Sector: Technology | |
| SubSector: Software - Application | |
| MarketCap: 1200 Millions | |
| Recent Price: 3.08 Smart Investing & Trading Score: 10 | |
| Day Percent Change: 0.33% Day Change: 0.01 | |
| Week Change: -8.33% Year-to-date Change: -25.4% | |
| HKD Links: Profile News Message Board | |
| Charts:- Daily , Weekly | |
| Add HKD to Watchlist: View: Get Complete HKD Trend Analysis ➞ | |
 | EXTR Extreme Networks, Inc. |
| Sector: Technology | |
| SubSector: Communication Equipment | |
| MarketCap: 339.939 Millions | |
| Recent Price: 10.97 Smart Investing & Trading Score: 10 | |
| Day Percent Change: 0.27% Day Change: 0.03 | |
| Week Change: -0.9% Year-to-date Change: -37.8% | |
| EXTR Links: Profile News Message Board | |
| Charts:- Daily , Weekly | |
| Add EXTR to Watchlist: View: Get Complete EXTR Trend Analysis ➞ | |
 | STNE StoneCo Ltd. |
| Sector: Technology | |
| SubSector: Application Software | |
| MarketCap: 7347.82 Millions | |
| Recent Price: 15.30 Smart Investing & Trading Score: 10 | |
| Day Percent Change: 0.26% Day Change: 0.04 | |
| Week Change: -5.09% Year-to-date Change: -15.1% | |
| STNE Links: Profile News Message Board | |
| Charts:- Daily , Weekly | |
| Add STNE to Watchlist: View: Get Complete STNE Trend Analysis ➞ | |
 | CRNC Cerence Inc. |
| Sector: Technology | |
| SubSector: Application Software | |
| MarketCap: 640.662 Millions | |
| Recent Price: 10.37 Smart Investing & Trading Score: 10 | |
| Day Percent Change: 0.19% Day Change: 0.02 | |
| Week Change: -22.38% Year-to-date Change: -47.3% | |
| CRNC Links: Profile News Message Board | |
| Charts:- Daily , Weekly | |
| Add CRNC to Watchlist: View: Get Complete CRNC Trend Analysis ➞ | |
 | IBM International Business Machines Corporation |
| Sector: Technology | |
| SubSector: Information Technology Services | |
| MarketCap: 97241.6 Millions | |
| Recent Price: 181.58 Smart Investing & Trading Score: 10 | |
| Day Percent Change: 0.06% Day Change: 0.11 | |
| Week Change: -0.38% Year-to-date Change: 11.0% | |
| IBM Links: Profile News Message Board | |
| Charts:- Daily , Weekly | |
| Add IBM to Watchlist: View: Get Complete IBM Trend Analysis ➞ | |
 | Z Zillow Group, Inc. |
| Sector: Technology | |
| SubSector: Internet Information Providers | |
| MarketCap: 3880.4 Millions | |
| Recent Price: 41.82 Smart Investing & Trading Score: 10 | |
| Day Percent Change: 0.02% Day Change: 0.01 | |
| Week Change: -5.85% Year-to-date Change: -27.7% | |
| Z Links: Profile News Message Board | |
| Charts:- Daily , Weekly | |
| Add Z to Watchlist: View: Get Complete Z Trend Analysis ➞ | |
 | TIGR UP Fintech Holding Limited |
| Sector: Technology | |
| SubSector: Application Software | |
| MarketCap: 385.062 Millions | |
| Recent Price: 3.15 Smart Investing & Trading Score: 10 | |
| Day Percent Change: 0.00% Day Change: 0.00 | |
| Week Change: -4.26% Year-to-date Change: -28.7% | |
| TIGR Links: Profile News Message Board | |
| Charts:- Daily , Weekly | |
| Add TIGR to Watchlist: View: Get Complete TIGR Trend Analysis ➞ | |
| For tabular summary view of above stock list: Summary View ➞ 0 - 25 , 25 - 50 , 50 - 75 , 75 - 100 , 100 - 125 , 125 - 150 , 150 - 175 , 175 - 200 , 200 - 225 , 225 - 250 , 250 - 275 , 275 - 300 , 300 - 325 , 325 - 350 , 350 - 375 , 375 - 400 , 400 - 425 , 425 - 450 , 450 - 475 , 475 - 500 , 500 - 525 , 525 - 550 , 550 - 575 , 575 - 600 , 600 - 625 , 625 - 650 | ||
| Click To Change The Sort Order: By Market Cap or Company Size Performance: Year-to-date, Week and Day | |
| Select Chart Type: | ||
|
Best Stocks Today 12Stocks.com |
© 2024 12Stocks.com Terms & Conditions Privacy Contact Us
All Information Provided Only For Education And Not To Be Used For Investing or Trading. See Terms & Conditions


One More Thing ... Get Best Stocks Delivered Daily!
Never Ever Miss A Move With Our Top Ten Stocks Lists
Find Best Stocks In Any Market - Bull or Bear Market
Take A Peek At Our Top Ten Stocks Lists: Daily, Weekly, Year-to-Date & Top Trends
Find Best Stocks In Any Market - Bull or Bear Market
Take A Peek At Our Top Ten Stocks Lists: Daily, Weekly, Year-to-Date & Top Trends
Technology Stocks With Best Up Trends [0-bearish to 100-bullish]: Karooooo [100], NextNav [100], EchoStar [100], Badger Meter[100], Full Truck[93], Turkcell Iletisim[93], Grab [93], Zuora [93], GDS [88], Criteo S.A[83], So-Young [83]
Best Technology Stocks Year-to-Date:
Pagaya [589.78%], MediaCo Holding[544.37%], CXApp [168.73%], Smith Micro[151.82%], Super Micro[151.06%], Uxin [141.08%], CuriosityStream [107.37%], GigaCloud [89.46%], MicroStrategy [85.89%], NextNav [83.37%], D-Wave Quantum[81.22%] Best Technology Stocks This Week:
Snap One[29.73%], Badger Meter[15.61%], Mynaric AG[13.08%], Expensify [11.56%], Iridium [11.07%], NextNav [10.12%], Encore Wire[8.97%], Quhuo [8.87%], Bentley Systems[7.96%], Applied Optoelectronics[7.93%], Zuora [7.56%] Best Technology Stocks Daily:
Markforged Holding[16.32%], CuriosityStream [10.89%], CXApp [9.78%], Iridium [5.14%], Cheetah Mobile[5.04%], Aerohive Networks[4.23%], Materialise NV[3.98%], Applied Optoelectronics[3.95%], QuinStreet [3.70%], ATN [3.58%], MediaCo Holding[3.58%]