
 Login Sign Up


| |||||
 |  | ||||

| 12Stocks.com Market Intelligence |
Best Tech Stocks
| In a hurry? Tech Stocks Lists: Performance & Trends, Stock Charts, FANG Stocks
Sort Tech stocks: Daily, Weekly, Year-to-Date, Market Cap & Trends. Filter Tech stocks list by size:All Tech Large Mid-Range Small and MicroCap |
| 12Stocks.com Tech Stocks Performances & Trends Daily | |||||||||
|
|  The overall Smart Investing & Trading Score is 18 (0-bearish to 100-bullish) which puts Technology sector in short term bearish trend. The Smart Investing & Trading Score from previous trading session is 45 and hence a deterioration of trend.
| ||||||||
Here are the Smart Investing & Trading Scores of the most requested Technology stocks at 12Stocks.com (click stock name for detailed review):
|


| 12Stocks.com: Investing in Technology sector with Stocks | |
|
The following table helps investors and traders sort through current performance and trends (as measured by Smart Investing & Trading Score) of various
stocks in the Tech sector. Quick View: Move mouse or cursor over stock symbol (ticker) to view short-term technical chart and over stock name to view long term chart. Click on  to add stock symbol to your watchlist and to add stock symbol to your watchlist and  to view watchlist. Click on any ticker or stock name for detailed market intelligence report for that stock. to view watchlist. Click on any ticker or stock name for detailed market intelligence report for that stock. |
12Stocks.com Performance of Stocks in Tech Sector
| Ticker | Stock Name | Watchlist | Category | Recent Price | Smart Investing & Trading Score | Change % | YTD Change% |
| IMOS | ChipMOS |   | Semiconductor | 28.22 | 56 | -0.63% | 3.71% |
| TOST | Toast | | Software - Infrastructure | 22.83 | 56 | -0.37% | 24.69% |
| GDDY | GoDaddy | | Internet | 123.49 | 56 | -0.27% | 16.32% |
| HUBB | Hubbell | | Electronics | 398.38 | 56 | -0.04% | 21.11% |
| MSI | Motorola | | Communication | 343.81 | 56 | -0.38% | 9.81% |
| FICO | Fair Isaac | | Software | 1196.81 | 55 | 0.32% | 2.82% |
| TWLO | Twilio | | Software | 59.16 | 55 | -2.98% | -22.02% |
| CNXN | PC Connection | | Computers Wholesale | 63.97 | 55 | -1.55% | -4.82% |
| VRNS | Varonis Systems | | Software | 44.42 | 55 | -1.00% | -1.90% |
| NSIT | Insight Enterprises | | IT | 183.33 | 55 | -0.56% | 3.47% |
| G | Genpact | | IT | 30.95 | 54 | -2.55% | -10.83% |
| FORTY | Formula Systems | | IT | 74.60 | 54 | 0.00% | 14.22% |
| APP | AppLovin | | Software - | 67.62 | 54 | -2.63% | 69.92% |
| SIMO | Silicon Motion | | Electronics | 73.08 | 54 | -0.88% | 19.28% |
| PGY | Pagaya | | Software - Infrastructure | 9.29 | 54 | -0.43% | 578.10% |
| ENFN | Enfusion | | Software - | 9.23 | 54 | -0.43% | -6.37% |
| VZIO | VIZIO Holding | | Consumer Electronics | 10.77 | 54 | -0.19% | 39.62% |
| PHI | PLDT | | Telecom | 23.28 | 54 | -0.17% | -0.64% |
| FENG | Phoenix New | | Internet | 1.92 | 53 | 8.81% | 40.81% |
| TSEM | Tower Semiconductor | | Semiconductor | 31.78 | 53 | 0.16% | 4.13% |
| BAND | Bandwidth | | Software | 17.66 | 53 | -4.28% | 22.05% |
| SONO | Sonos | | Electronics | 17.06 | 53 | -1.64% | -0.50% |
| LHX | L3Harris | | Communication | 206.07 | 53 | -0.79% | -2.16% |
| SITM | SiTime | | Semiconductor | 79.09 | 52 | 3.77% | -35.21% |
| COHU | Cohu | | Semiconductor | 30.82 | 52 | 1.52% | -12.91% |
| For chart view version of above stock list: Chart View ➞ 0 - 25 , 25 - 50 , 50 - 75 , 75 - 100 , 100 - 125 , 125 - 150 , 150 - 175 , 175 - 200 , 200 - 225 , 225 - 250 , 250 - 275 , 275 - 300 , 300 - 325 , 325 - 350 , 350 - 375 , 375 - 400 , 400 - 425 , 425 - 450 , 450 - 475 , 475 - 500 , 500 - 525 , 525 - 550 , 550 - 575 , 575 - 600 , 600 - 625 | ||
 | Click To Change The Sort Order: By Market Cap or Company Size Performance: Year-to-date, Week and Day |  |
|
Get the most comprehensive stock market coverage daily at 12Stocks.com ➞ Best Stocks Today ➞ Best Stocks Weekly ➞ Best Stocks Year-to-Date ➞ Best Stocks Trends ➞  Best Stocks Today 12Stocks.com Best Nasdaq Stocks ➞ Best S&P 500 Stocks ➞ Best Tech Stocks ➞ Best Biotech Stocks ➞ |
| Detailed Overview of Tech Stocks |
| Tech Technical Overview, Leaders & Laggards, Top Tech ETF Funds & Detailed Tech Stocks List, Charts, Trends & More |
| Tech Sector: Technical Analysis, Trends & YTD Performance | |
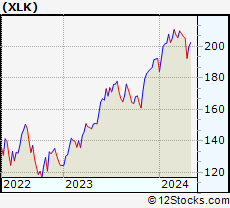
| Technology sector is composed of stocks
from semiconductors, software, web, social media
and services subsectors. Technology sector, as represented by XLK, an exchange-traded fund [ETF] that holds basket of tech stocks (e.g, Intel, Google) is up by 1.46% and is currently underperforming the overall market by -2.79% year-to-date. Below is a quick view of technical charts and trends: |
|
 XLK Weekly Chart |
|
| Long Term Trend: Not Good | |
| Medium Term Trend: Not Good | |
 XLK Daily Chart |
|
| Short Term Trend: Very Good | |
| Overall Trend Score: 18 | |
| YTD Performance: 1.46% | |
| **Trend Scores & Views Are Only For Educational Purposes And Not For Investing | |
| 12Stocks.com: Top Performing Technology Sector Stocks | ||||||||||||||||||||||||||||||||||||||||||||||||
 The top performing Technology sector stocks year to date are
Now, more recently, over last week, the top performing Technology sector stocks on the move are


|
||||||||||||||||||||||||||||||||||||||||||||||||
| 12Stocks.com: Investing in Tech Sector using Exchange Traded Funds | |
|
The following table shows list of key exchange traded funds (ETF) that
help investors track Tech Index. For detailed view, check out our ETF Funds section of our website. Quick View: Move mouse or cursor over ETF symbol (ticker) to view short-term technical chart and over ETF name to view long term chart. Click on ticker or stock name for detailed view. Click on to add stock symbol to your watchlist and to view watchlist. |
12Stocks.com List of ETFs that track Tech Index
| Ticker | ETF Name | Watchlist | Recent Price | Smart Investing & Trading Score | Change % | Week % | Year-to-date % |
| XLK | Technology | | 195.29 | 18 | -1.38 | 1.43 | 1.46% |
| TQQQ | QQQ | | 51.20 | 18 | -4.67 | 3.48 | 0.99% |
| SQQQ | Short QQQ | | 12.36 | 57 | 4.66 | -3.74 | -8.1% |
| SOXL | Semicondct Bull 3X | | 36.39 | 58 | 2.54 | 18.19 | 15.89% |
| SMH | Semiconductor | | 210.08 | 58 | 0.98 | 5.46 | 20.13% |
| 12Stocks.com: Charts, Trends, Fundamental Data and Performances of Tech Stocks | |
|
We now take in-depth look at all Tech stocks including charts, multi-period performances and overall trends (as measured by Smart Investing & Trading Score). One can sort Tech stocks (click link to choose) by Daily, Weekly and by Year-to-Date performances. Also, one can sort by size of the company or by market capitalization. |
| Select Your Default Chart Type: | |||||
| |||||
| Click on stock symbol or name for detailed view. Click on to add stock symbol to your watchlist and to view watchlist. Quick View: Move mouse or cursor over "Daily" to quickly view daily technical stock chart and over "Weekly" to view weekly technical stock chart. | |||||


 | IMOS ChipMOS TECHNOLOGIES INC. |
| Sector: Technology | |
| SubSector: Semiconductor Equipment & Materials | |
| MarketCap: 658.918 Millions | |
| Recent Price: 28.22 Smart Investing & Trading Score: 56 | |
| Day Percent Change: -0.63% Day Change: -0.18 | |
| Week Change: 1.47% Year-to-date Change: 3.7% | |
| IMOS Links: Profile News Message Board | |
| Charts:- Daily , Weekly | |
| Add IMOS to Watchlist: View: Get Complete IMOS Trend Analysis ➞ | |
 | TOST Toast, Inc. |
| Sector: Technology | |
| SubSector: Software - Infrastructure | |
| MarketCap: 11680 Millions | |
| Recent Price: 22.83 Smart Investing & Trading Score: 56 | |
| Day Percent Change: -0.37% Day Change: -0.09 | |
| Week Change: 5.6% Year-to-date Change: 24.7% | |
| TOST Links: Profile News Message Board | |
| Charts:- Daily , Weekly | |
| Add TOST to Watchlist: View: Get Complete TOST Trend Analysis ➞ | |
 | GDDY GoDaddy Inc. |
| Sector: Technology | |
| SubSector: Internet Software & Services | |
| MarketCap: 9570.51 Millions | |
| Recent Price: 123.49 Smart Investing & Trading Score: 56 | |
| Day Percent Change: -0.27% Day Change: -0.34 | |
| Week Change: 2.81% Year-to-date Change: 16.3% | |
| GDDY Links: Profile News Message Board | |
| Charts:- Daily , Weekly | |
| Add GDDY to Watchlist: View: Get Complete GDDY Trend Analysis ➞ | |
 | HUBB Hubbell Incorporated |
| Sector: Technology | |
| SubSector: Diversified Electronics | |
| MarketCap: 6002.46 Millions | |
| Recent Price: 398.38 Smart Investing & Trading Score: 56 | |
| Day Percent Change: -0.04% Day Change: -0.17 | |
| Week Change: 2.67% Year-to-date Change: 21.1% | |
| HUBB Links: Profile News Message Board | |
| Charts:- Daily , Weekly | |
| Add HUBB to Watchlist: View: Get Complete HUBB Trend Analysis ➞ | |
 | MSI Motorola Solutions, Inc. |
| Sector: Technology | |
| SubSector: Communication Equipment | |
| MarketCap: 26573.3 Millions | |
| Recent Price: 343.81 Smart Investing & Trading Score: 56 | |
| Day Percent Change: -0.38% Day Change: -1.30 | |
| Week Change: 1.22% Year-to-date Change: 9.8% | |
| MSI Links: Profile News Message Board | |
| Charts:- Daily , Weekly | |
| Add MSI to Watchlist: View: Get Complete MSI Trend Analysis ➞ | |
 | FICO Fair Isaac Corporation |
| Sector: Technology | |
| SubSector: Business Software & Services | |
| MarketCap: 7930.98 Millions | |
| Recent Price: 1196.81 Smart Investing & Trading Score: 55 | |
| Day Percent Change: 0.32% Day Change: 3.79 | |
| Week Change: 5.91% Year-to-date Change: 2.8% | |
| FICO Links: Profile News Message Board | |
| Charts:- Daily , Weekly | |
| Add FICO to Watchlist: View: Get Complete FICO Trend Analysis ➞ | |
 | TWLO Twilio Inc. |
| Sector: Technology | |
| SubSector: Application Software | |
| MarketCap: 13055.8 Millions | |
| Recent Price: 59.16 Smart Investing & Trading Score: 55 | |
| Day Percent Change: -2.98% Day Change: -1.82 | |
| Week Change: 2.8% Year-to-date Change: -22.0% | |
| TWLO Links: Profile News Message Board | |
| Charts:- Daily , Weekly | |
| Add TWLO to Watchlist: View: Get Complete TWLO Trend Analysis ➞ | |
 | CNXN PC Connection, Inc. |
| Sector: Technology | |
| SubSector: Computers Wholesale | |
| MarketCap: 1020.19 Millions | |
| Recent Price: 63.97 Smart Investing & Trading Score: 55 | |
| Day Percent Change: -1.55% Day Change: -1.01 | |
| Week Change: 1.83% Year-to-date Change: -4.8% | |
| CNXN Links: Profile News Message Board | |
| Charts:- Daily , Weekly | |
| Add CNXN to Watchlist: View: Get Complete CNXN Trend Analysis ➞ | |
 | VRNS Varonis Systems, Inc. |
| Sector: Technology | |
| SubSector: Technical & System Software | |
| MarketCap: 1715 Millions | |
| Recent Price: 44.42 Smart Investing & Trading Score: 55 | |
| Day Percent Change: -1.00% Day Change: -0.45 | |
| Week Change: 2.49% Year-to-date Change: -1.9% | |
| VRNS Links: Profile News Message Board | |
| Charts:- Daily , Weekly | |
| Add VRNS to Watchlist: View: Get Complete VRNS Trend Analysis ➞ | |
 | NSIT Insight Enterprises, Inc. |
| Sector: Technology | |
| SubSector: Information Technology Services | |
| MarketCap: 1498.48 Millions | |
| Recent Price: 183.33 Smart Investing & Trading Score: 55 | |
| Day Percent Change: -0.56% Day Change: -1.03 | |
| Week Change: 0.41% Year-to-date Change: 3.5% | |
| NSIT Links: Profile News Message Board | |
| Charts:- Daily , Weekly | |
| Add NSIT to Watchlist: View: Get Complete NSIT Trend Analysis ➞ | |
 | G Genpact Limited |
| Sector: Technology | |
| SubSector: Information Technology Services | |
| MarketCap: 5485.78 Millions | |
| Recent Price: 30.95 Smart Investing & Trading Score: 54 | |
| Day Percent Change: -2.55% Day Change: -0.81 | |
| Week Change: -2.03% Year-to-date Change: -10.8% | |
| G Links: Profile News Message Board | |
| Charts:- Daily , Weekly | |
| Add G to Watchlist: View: Get Complete G Trend Analysis ➞ | |
 | FORTY Formula Systems (1985) Ltd. |
| Sector: Technology | |
| SubSector: Information Technology Services | |
| MarketCap: 735.768 Millions | |
| Recent Price: 74.60 Smart Investing & Trading Score: 54 | |
| Day Percent Change: 0.00% Day Change: 0.00 | |
| Week Change: 3.31% Year-to-date Change: 14.2% | |
| FORTY Links: Profile News Message Board | |
| Charts:- Daily , Weekly | |
| Add FORTY to Watchlist: View: Get Complete FORTY Trend Analysis ➞ | |
 | APP AppLovin Corporation |
| Sector: Technology | |
| SubSector: Software - Application | |
| MarketCap: 9000 Millions | |
| Recent Price: 67.62 Smart Investing & Trading Score: 54 | |
| Day Percent Change: -2.63% Day Change: -1.83 | |
| Week Change: 1.23% Year-to-date Change: 69.9% | |
| APP Links: Profile News Message Board | |
| Charts:- Daily , Weekly | |
| Add APP to Watchlist: View: Get Complete APP Trend Analysis ➞ | |
 | SIMO Silicon Motion Technology Corporation |
| Sector: Technology | |
| SubSector: Diversified Electronics | |
| MarketCap: 1186.66 Millions | |
| Recent Price: 73.08 Smart Investing & Trading Score: 54 | |
| Day Percent Change: -0.88% Day Change: -0.65 | |
| Week Change: 1.73% Year-to-date Change: 19.3% | |
| SIMO Links: Profile News Message Board | |
| Charts:- Daily , Weekly | |
| Add SIMO to Watchlist: View: Get Complete SIMO Trend Analysis ➞ | |
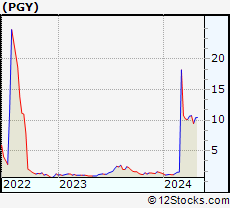 | PGY Pagaya Technologies Ltd. |
| Sector: Technology | |
| SubSector: Software - Infrastructure | |
| MarketCap: 974 Millions | |
| Recent Price: 9.29 Smart Investing & Trading Score: 54 | |
| Day Percent Change: -0.43% Day Change: -0.04 | |
| Week Change: -1.69% Year-to-date Change: 578.1% | |
| PGY Links: Profile News Message Board | |
| Charts:- Daily , Weekly | |
| Add PGY to Watchlist: View: Get Complete PGY Trend Analysis ➞ | |
 | ENFN Enfusion, Inc. |
| Sector: Technology | |
| SubSector: Software - Application | |
| MarketCap: 1290 Millions | |
| Recent Price: 9.23 Smart Investing & Trading Score: 54 | |
| Day Percent Change: -0.43% Day Change: -0.04 | |
| Week Change: -0.11% Year-to-date Change: -6.4% | |
| ENFN Links: Profile News Message Board | |
| Charts:- Daily , Weekly | |
| Add ENFN to Watchlist: View: Get Complete ENFN Trend Analysis ➞ | |
 | VZIO VIZIO Holding Corp. |
| Sector: Technology | |
| SubSector: Consumer Electronics | |
| MarketCap: 1300 Millions | |
| Recent Price: 10.77 Smart Investing & Trading Score: 54 | |
| Day Percent Change: -0.19% Day Change: -0.02 | |
| Week Change: -0.14% Year-to-date Change: 39.6% | |
| VZIO Links: Profile News Message Board | |
| Charts:- Daily , Weekly | |
| Add VZIO to Watchlist: View: Get Complete VZIO Trend Analysis ➞ | |
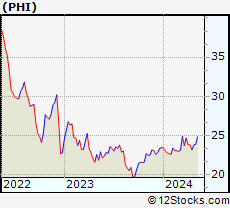 | PHI PLDT Inc. |
| Sector: Technology | |
| SubSector: Telecom Services - Foreign | |
| MarketCap: 4095.19 Millions | |
| Recent Price: 23.28 Smart Investing & Trading Score: 54 | |
| Day Percent Change: -0.17% Day Change: -0.04 | |
| Week Change: 0.52% Year-to-date Change: -0.6% | |
| PHI Links: Profile News Message Board | |
| Charts:- Daily , Weekly | |
| Add PHI to Watchlist: View: Get Complete PHI Trend Analysis ➞ | |
 | FENG Phoenix New Media Limited |
| Sector: Technology | |
| SubSector: Internet Information Providers | |
| MarketCap: 107.08 Millions | |
| Recent Price: 1.92 Smart Investing & Trading Score: 53 | |
| Day Percent Change: 8.81% Day Change: 0.16 | |
| Week Change: 5.22% Year-to-date Change: 40.8% | |
| FENG Links: Profile News Message Board | |
| Charts:- Daily , Weekly | |
| Add FENG to Watchlist: View: Get Complete FENG Trend Analysis ➞ | |
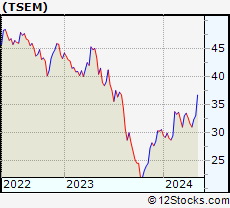 | TSEM Tower Semiconductor Ltd. |
| Sector: Technology | |
| SubSector: Semiconductor - Integrated Circuits | |
| MarketCap: 1745.1 Millions | |
| Recent Price: 31.78 Smart Investing & Trading Score: 53 | |
| Day Percent Change: 0.16% Day Change: 0.05 | |
| Week Change: 2.55% Year-to-date Change: 4.1% | |
| TSEM Links: Profile News Message Board | |
| Charts:- Daily , Weekly | |
| Add TSEM to Watchlist: View: Get Complete TSEM Trend Analysis ➞ | |
 | BAND Bandwidth Inc. |
| Sector: Technology | |
| SubSector: Business Software & Services | |
| MarketCap: 1549.38 Millions | |
| Recent Price: 17.66 Smart Investing & Trading Score: 53 | |
| Day Percent Change: -4.28% Day Change: -0.79 | |
| Week Change: 1.79% Year-to-date Change: 22.1% | |
| BAND Links: Profile News Message Board | |
| Charts:- Daily , Weekly | |
| Add BAND to Watchlist: View: Get Complete BAND Trend Analysis ➞ | |
 | SONO Sonos, Inc. |
| Sector: Technology | |
| SubSector: Diversified Electronics | |
| MarketCap: 1047.96 Millions | |
| Recent Price: 17.06 Smart Investing & Trading Score: 53 | |
| Day Percent Change: -1.64% Day Change: -0.29 | |
| Week Change: 0.92% Year-to-date Change: -0.5% | |
| SONO Links: Profile News Message Board | |
| Charts:- Daily , Weekly | |
| Add SONO to Watchlist: View: Get Complete SONO Trend Analysis ➞ | |
 | LHX L3Harris Technologies, Inc. |
| Sector: Technology | |
| SubSector: Communication Equipment | |
| MarketCap: 37906.1 Millions | |
| Recent Price: 206.07 Smart Investing & Trading Score: 53 | |
| Day Percent Change: -0.79% Day Change: -1.64 | |
| Week Change: 0.3% Year-to-date Change: -2.2% | |
| LHX Links: Profile News Message Board | |
| Charts:- Daily , Weekly | |
| Add LHX to Watchlist: View: Get Complete LHX Trend Analysis ➞ | |
 | SITM SiTime Corporation |
| Sector: Technology | |
| SubSector: Semiconductor - Specialized | |
| MarketCap: 403.76 Millions | |
| Recent Price: 79.09 Smart Investing & Trading Score: 52 | |
| Day Percent Change: 3.77% Day Change: 2.87 | |
| Week Change: 7.72% Year-to-date Change: -35.2% | |
| SITM Links: Profile News Message Board | |
| Charts:- Daily , Weekly | |
| Add SITM to Watchlist: View: Get Complete SITM Trend Analysis ➞ | |
 | COHU Cohu, Inc. |
| Sector: Technology | |
| SubSector: Semiconductor Equipment & Materials | |
| MarketCap: 519.518 Millions | |
| Recent Price: 30.82 Smart Investing & Trading Score: 52 | |
| Day Percent Change: 1.52% Day Change: 0.46 | |
| Week Change: 7.09% Year-to-date Change: -12.9% | |
| COHU Links: Profile News Message Board | |
| Charts:- Daily , Weekly | |
| Add COHU to Watchlist: View: Get Complete COHU Trend Analysis ➞ | |
| For tabular summary view of above stock list: Summary View ➞ 0 - 25 , 25 - 50 , 50 - 75 , 75 - 100 , 100 - 125 , 125 - 150 , 150 - 175 , 175 - 200 , 200 - 225 , 225 - 250 , 250 - 275 , 275 - 300 , 300 - 325 , 325 - 350 , 350 - 375 , 375 - 400 , 400 - 425 , 425 - 450 , 450 - 475 , 475 - 500 , 500 - 525 , 525 - 550 , 550 - 575 , 575 - 600 , 600 - 625 | ||
| Click To Change The Sort Order: By Market Cap or Company Size Performance: Year-to-date, Week and Day | |
| Select Chart Type: | ||
|
Best Stocks Today 12Stocks.com |
© 2024 12Stocks.com Terms & Conditions Privacy Contact Us
All Information Provided Only For Education And Not To Be Used For Investing or Trading. See Terms & Conditions


One More Thing ... Get Best Stocks Delivered Daily!
Never Ever Miss A Move With Our Top Ten Stocks Lists
Find Best Stocks In Any Market - Bull or Bear Market
Take A Peek At Our Top Ten Stocks Lists: Daily, Weekly, Year-to-Date & Top Trends
Find Best Stocks In Any Market - Bull or Bear Market
Take A Peek At Our Top Ten Stocks Lists: Daily, Weekly, Year-to-Date & Top Trends
Technology Stocks With Best Up Trends [0-bearish to 100-bullish]: HashiCorp [100], Karooooo [100], Ribbon [100], Grab [100], Diodes [100], Sanmina [100], NextNav [100], Allegro MicroSystems[100], Turkcell Iletisim[100], JD.com [100], Vishay Inter[100]
Best Technology Stocks Year-to-Date:
Pagaya [578.1%], MediaCo Holding[390.61%], Uxin [173.89%], Super Micro[170.84%], CXApp [166.41%], CuriosityStream [103.67%], GigaCloud [97.54%], NextNav [97.08%], MicroStrategy [96.5%], SoundHound AI[92.29%], Cheetah Mobile[82.46%] Best Technology Stocks This Week:
Matterport [168.39%], Amesite [58.44%], HashiCorp [37.23%], WiMi Hologram[33.51%], Ribbon [30.81%], Impinj [22.93%], Cheetah Mobile[17.51%], SoundHound AI[15.92%], iQIYI [14.69%], Vacasa [14.32%], IonQ [14.25%] Best Technology Stocks Daily:
Impinj [18.26%], HashiCorp [10.94%], Karooooo [10.29%], Phoenix New[8.81%], Teradyne [6.91%], Xiao-I [6.35%], Tyler [6.24%], MediaCo Holding[5.56%], CACI [5.50%], Vicor [5.49%], Cheetah Mobile[5.05%]