
 Login Sign Up


| |||||
 |  | ||||

| 12Stocks.com Market Intelligence |
Best Tech Stocks
| In a hurry? Tech Stocks Lists: Performance & Trends, Stock Charts, FANG Stocks
Sort Tech stocks: Daily, Weekly, Year-to-Date, Market Cap & Trends. Filter Tech stocks list by size:All Tech Large Mid-Range Small and MicroCap |
| 12Stocks.com Tech Stocks Performances & Trends Daily | |||||||||
|
|  The overall Smart Investing & Trading Score is 32 (0-bearish to 100-bullish) which puts Technology sector in short term bearish to neutral trend. The Smart Investing & Trading Score from previous trading session is 38 and hence a deterioration of trend.
| ||||||||
Here are the Smart Investing & Trading Scores of the most requested Technology stocks at 12Stocks.com (click stock name for detailed review):
|


| 12Stocks.com: Investing in Technology sector with Stocks | |
|
The following table helps investors and traders sort through current performance and trends (as measured by Smart Investing & Trading Score) of various
stocks in the Tech sector. Quick View: Move mouse or cursor over stock symbol (ticker) to view short-term technical chart and over stock name to view long term chart. Click on  to add stock symbol to your watchlist and to add stock symbol to your watchlist and  to view watchlist. Click on any ticker or stock name for detailed market intelligence report for that stock. to view watchlist. Click on any ticker or stock name for detailed market intelligence report for that stock. |
12Stocks.com Performance of Stocks in Tech Sector
| Ticker | Stock Name | Watchlist | Category | Recent Price | Smart Investing & Trading Score | Change % | YTD Change% |
| AEHR | Aehr Test |   | Semiconductor | 11.14 | 27 | 5.49% | -58.01% |
| WATT | Energous | | Instruments | 1.40 | 17 | 2.94% | -23.50% |
| MVIS | MicroVision | | Instruments | 1.43 | 27 | 3.62% | -46.24% |
| WYY | WidePoint | | IT | 2.17 | 42 | -0.46% | -6.47% |
| KTCC | Key Tronic | | Computer | 4.61 | 53 | 2.22% | 6.71% |
| VERB | Verb | | Software | 0.18 | 27 | 9.16% | 1.59% |
| BHAT | Fujian Blue | | Software | 1.12 | 75 | 2.29% | 16.39% |
| NINE | Nine Energy | | Software | 2.30 | 10 | -4.96% | -14.18% |
| INTT | inTEST | | Semiconductor | 11.20 | 28 | 1.36% | -17.65% |
| QUIK | QuickLogic | | Semiconductor | 12.71 | 51 | 1.15% | -8.30% |
| GIGM | GigaMedia | | Software | 1.37 | 64 | 0.00% | -1.45% |
| TACT | TransAct | | Computer | 4.67 | 10 | 2.64% | -33.09% |
| CSPI | CSP | | IT | 13.98 | 18 | -2.44% | -28.27% |
| RIOT | Riot Blockchain | | Software | 11.88 | 100 | 0.25% | -23.21% |
| KOPN | Kopin | | Semiconductor | 0.86 | 0 | -10.93% | -57.73% |
| STRM | Streamline Health | | Healthcare Information | 0.34 | 42 | 2.72% | -20.00% |
| CLPS | CLPS In | | IT | 0.99 | 7 | 2.06% | -6.60% |
| DAIO | Data I/O | | Electronics | 3.53 | 68 | -1.12% | 20.07% |
| LINK | Interlink Electronics | | Electronics | 6.80 | 23 | 0.00% | -46.75% |
| APDN | Applied DNA | | Security Software | 0.24 | 0 | -17.66% | -61.28% |
| GVP | GSE Systems | | Software | 2.81 | 68 | 4.07% | 39.80% |
| INOD | Innodata | | IT | 6.33 | 34 | 10.28% | -22.24% |
| NCTY | The9 | | Software | 6.72 | 95 | 3.23% | -10.28% |
| OCC | Optical Cable | | Communication | 2.72 | 36 | 0.37% | 0.74% |
| OSS | One Stop | | Computer | 2.84 | 36 | 2.16% | 34.60% |
| For chart view version of above stock list: Chart View ➞ 0 - 25 , 25 - 50 , 50 - 75 , 75 - 100 | ||
 | Click To Change The Sort Order: By Market Cap or Company Size Performance: Year-to-date, Week and Day |  |
|
Get the most comprehensive stock market coverage daily at 12Stocks.com ➞ Best Stocks Today ➞ Best Stocks Weekly ➞ Best Stocks Year-to-Date ➞ Best Stocks Trends ➞  Best Stocks Today 12Stocks.com Best Nasdaq Stocks ➞ Best S&P 500 Stocks ➞ Best Tech Stocks ➞ Best Biotech Stocks ➞ |
| Detailed Overview of Tech Stocks |
| Tech Technical Overview, Leaders & Laggards, Top Tech ETF Funds & Detailed Tech Stocks List, Charts, Trends & More |
| Tech Sector: Technical Analysis, Trends & YTD Performance | |
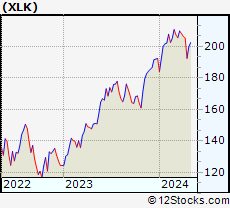
| Technology sector is composed of stocks
from semiconductors, software, web, social media
and services subsectors. Technology sector, as represented by XLK, an exchange-traded fund [ETF] that holds basket of tech stocks (e.g, Intel, Google) is up by 2.88% and is currently underperforming the overall market by -2.78% year-to-date. Below is a quick view of technical charts and trends: |
|
 XLK Weekly Chart |
|
| Long Term Trend: Good | |
| Medium Term Trend: Not Good | |
 XLK Daily Chart |
|
| Short Term Trend: Very Good | |
| Overall Trend Score: 32 | |
| YTD Performance: 2.88% | |
| **Trend Scores & Views Are Only For Educational Purposes And Not For Investing | |
| 12Stocks.com: Top Performing Technology Sector Stocks | ||||||||||||||||||||||||||||||||||||||||||||||||
 The top performing Technology sector stocks year to date are
Now, more recently, over last week, the top performing Technology sector stocks on the move are


|
||||||||||||||||||||||||||||||||||||||||||||||||
| 12Stocks.com: Investing in Tech Sector using Exchange Traded Funds | |
|
The following table shows list of key exchange traded funds (ETF) that
help investors track Tech Index. For detailed view, check out our ETF Funds section of our website. Quick View: Move mouse or cursor over ETF symbol (ticker) to view short-term technical chart and over ETF name to view long term chart. Click on ticker or stock name for detailed view. Click on to add stock symbol to your watchlist and to view watchlist. |
12Stocks.com List of ETFs that track Tech Index
| Ticker | ETF Name | Watchlist | Recent Price | Smart Investing & Trading Score | Change % | Week % | Year-to-date % |
| XLK | Technology | | 198.03 | 32 | 0.46 | 2.86 | 2.88% |
| QQQ | QQQ | | 426.51 | 58 | 0.34 | 2.86 | 4.15% |
| IYW | Technology | | 128.84 | 43 | 0.25 | 3.28 | 4.96% |
| VGT | Information Technology | | 495.24 | 30 | 0.16 | 3.2 | 2.32% |
| IXN | Global Tech | | 70.84 | 43 | 0.47 | 3.08 | 3.9% |
| IGV | Tech-Software | | 80.94 | 17 | 0.10 | 3.07 | -0.23% |
| XSD | Semiconductor | | 215.54 | 30 | 2.30 | 5.89 | -4.11% |
| TQQQ | QQQ | | 53.71 | 58 | 0.98 | 8.55 | 5.94% |
| SQQQ | Short QQQ | | 11.81 | 37 | -0.84 | -8.02 | -12.19% |
| SOXL | Semicondct Bull 3X | | 35.49 | 58 | 4.05 | 15.26 | 13.03% |
| SOXS | Semicondct Bear 3X | | 39.61 | 58 | -3.81 | -14.13 | 580.58% |
| SOXX | PHLX Semiconductor | | 208.54 | 43 | 1.30 | 5.12 | 8.6% |
| QTEC | First -100-Tech | | 181.14 | 30 | 0.69 | 4.14 | 3.23% |
| SMH | Semiconductor | | 208.04 | 58 | 0.12 | 4.43 | 18.97% |
| 12Stocks.com: Charts, Trends, Fundamental Data and Performances of Tech Stocks | |
|
We now take in-depth look at all Tech stocks including charts, multi-period performances and overall trends (as measured by Smart Investing & Trading Score). One can sort Tech stocks (click link to choose) by Daily, Weekly and by Year-to-Date performances. Also, one can sort by size of the company or by market capitalization. |
| Select Your Default Chart Type: | |||||
| |||||
| Click on stock symbol or name for detailed view. Click on to add stock symbol to your watchlist and to view watchlist. Quick View: Move mouse or cursor over "Daily" to quickly view daily technical stock chart and over "Weekly" to view weekly technical stock chart. | |||||


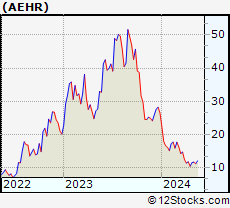 | AEHR Aehr Test Systems |
| Sector: Technology | |
| SubSector: Semiconductor Equipment & Materials | |
| MarketCap: 32.2918 Millions | |
| Recent Price: 11.14 Smart Investing & Trading Score: 27 | |
| Day Percent Change: 5.49% Day Change: 0.58 | |
| Week Change: 7.53% Year-to-date Change: -58.0% | |
| AEHR Links: Profile News Message Board | |
| Charts:- Daily , Weekly | |
| Add AEHR to Watchlist: View: Get Complete AEHR Trend Analysis ➞ | |
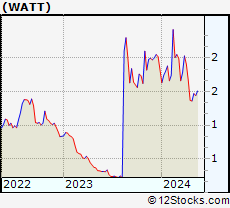 | WATT Energous Corporation |
| Sector: Technology | |
| SubSector: Scientific & Technical Instruments | |
| MarketCap: 32.2553 Millions | |
| Recent Price: 1.40 Smart Investing & Trading Score: 17 | |
| Day Percent Change: 2.94% Day Change: 0.04 | |
| Week Change: 2.19% Year-to-date Change: -23.5% | |
| WATT Links: Profile News Message Board | |
| Charts:- Daily , Weekly | |
| Add WATT to Watchlist: View: Get Complete WATT Trend Analysis ➞ | |
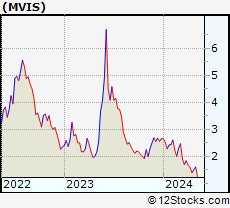 | MVIS MicroVision, Inc. |
| Sector: Technology | |
| SubSector: Scientific & Technical Instruments | |
| MarketCap: 32.1553 Millions | |
| Recent Price: 1.43 Smart Investing & Trading Score: 27 | |
| Day Percent Change: 3.62% Day Change: 0.05 | |
| Week Change: 2.14% Year-to-date Change: -46.2% | |
| MVIS Links: Profile News Message Board | |
| Charts:- Daily , Weekly | |
| Add MVIS to Watchlist: View: Get Complete MVIS Trend Analysis ➞ | |
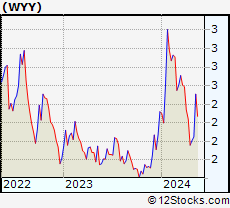 | WYY WidePoint Corporation |
| Sector: Technology | |
| SubSector: Information Technology Services | |
| MarketCap: 32.0468 Millions | |
| Recent Price: 2.17 Smart Investing & Trading Score: 42 | |
| Day Percent Change: -0.46% Day Change: -0.01 | |
| Week Change: 10.71% Year-to-date Change: -6.5% | |
| WYY Links: Profile News Message Board | |
| Charts:- Daily , Weekly | |
| Add WYY to Watchlist: View: Get Complete WYY Trend Analysis ➞ | |
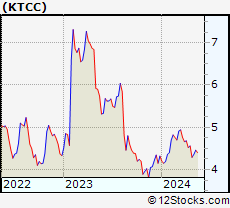 | KTCC Key Tronic Corporation |
| Sector: Technology | |
| SubSector: Computer Peripherals | |
| MarketCap: 31.1989 Millions | |
| Recent Price: 4.61 Smart Investing & Trading Score: 53 | |
| Day Percent Change: 2.22% Day Change: 0.10 | |
| Week Change: 1.1% Year-to-date Change: 6.7% | |
| KTCC Links: Profile News Message Board | |
| Charts:- Daily , Weekly | |
| Add KTCC to Watchlist: View: Get Complete KTCC Trend Analysis ➞ | |
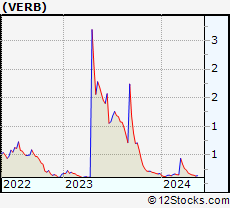 | VERB Verb Technology Company, Inc. |
| Sector: Technology | |
| SubSector: Application Software | |
| MarketCap: 30.6662 Millions | |
| Recent Price: 0.18 Smart Investing & Trading Score: 27 | |
| Day Percent Change: 9.16% Day Change: 0.01 | |
| Week Change: 6.49% Year-to-date Change: 1.6% | |
| VERB Links: Profile News Message Board | |
| Charts:- Daily , Weekly | |
| Add VERB to Watchlist: View: Get Complete VERB Trend Analysis ➞ | |
 | BHAT Fujian Blue Hat Interactive Entertainment Technology Ltd. |
| Sector: Technology | |
| SubSector: Multimedia & Graphics Software | |
| MarketCap: 28.3586 Millions | |
| Recent Price: 1.12 Smart Investing & Trading Score: 75 | |
| Day Percent Change: 2.29% Day Change: 0.02 | |
| Week Change: 5.19% Year-to-date Change: 16.4% | |
| BHAT Links: Profile News Message Board | |
| Charts:- Daily , Weekly | |
| Add BHAT to Watchlist: View: Get Complete BHAT Trend Analysis ➞ | |
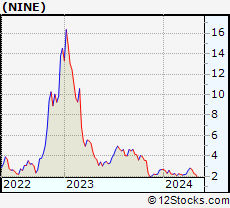 | NINE Nine Energy Service, Inc. |
| Sector: Technology | |
| SubSector: Business Software & Services | |
| MarketCap: 27.5758 Millions | |
| Recent Price: 2.30 Smart Investing & Trading Score: 10 | |
| Day Percent Change: -4.96% Day Change: -0.12 | |
| Week Change: -14.81% Year-to-date Change: -14.2% | |
| NINE Links: Profile News Message Board | |
| Charts:- Daily , Weekly | |
| Add NINE to Watchlist: View: Get Complete NINE Trend Analysis ➞ | |
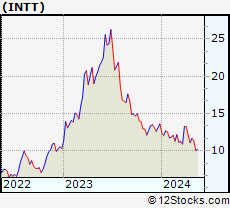 | INTT inTEST Corporation |
| Sector: Technology | |
| SubSector: Semiconductor - Integrated Circuits | |
| MarketCap: 27.251 Millions | |
| Recent Price: 11.20 Smart Investing & Trading Score: 28 | |
| Day Percent Change: 1.36% Day Change: 0.15 | |
| Week Change: 0.99% Year-to-date Change: -17.7% | |
| INTT Links: Profile News Message Board | |
| Charts:- Daily , Weekly | |
| Add INTT to Watchlist: View: Get Complete INTT Trend Analysis ➞ | |
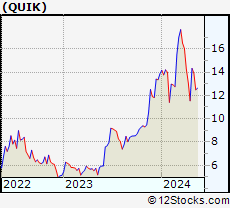 | QUIK QuickLogic Corporation |
| Sector: Technology | |
| SubSector: Semiconductor - Integrated Circuits | |
| MarketCap: 25.751 Millions | |
| Recent Price: 12.71 Smart Investing & Trading Score: 51 | |
| Day Percent Change: 1.15% Day Change: 0.15 | |
| Week Change: 10.14% Year-to-date Change: -8.3% | |
| QUIK Links: Profile News Message Board | |
| Charts:- Daily , Weekly | |
| Add QUIK to Watchlist: View: Get Complete QUIK Trend Analysis ➞ | |
 | GIGM GigaMedia Limited |
| Sector: Technology | |
| SubSector: Multimedia & Graphics Software | |
| MarketCap: 25.6586 Millions | |
| Recent Price: 1.37 Smart Investing & Trading Score: 64 | |
| Day Percent Change: 0.00% Day Change: 0.00 | |
| Week Change: 4.98% Year-to-date Change: -1.5% | |
| GIGM Links: Profile News Message Board | |
| Charts:- Daily , Weekly | |
| Add GIGM to Watchlist: View: Get Complete GIGM Trend Analysis ➞ | |
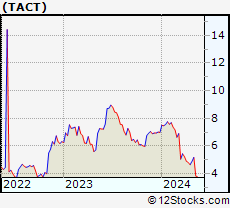 | TACT TransAct Technologies Incorporated |
| Sector: Technology | |
| SubSector: Computer Peripherals | |
| MarketCap: 25.5989 Millions | |
| Recent Price: 4.67 Smart Investing & Trading Score: 10 | |
| Day Percent Change: 2.64% Day Change: 0.12 | |
| Week Change: 0.43% Year-to-date Change: -33.1% | |
| TACT Links: Profile News Message Board | |
| Charts:- Daily , Weekly | |
| Add TACT to Watchlist: View: Get Complete TACT Trend Analysis ➞ | |
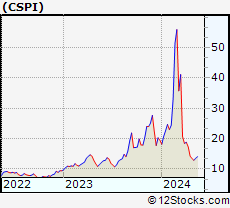 | CSPI CSP Inc. |
| Sector: Technology | |
| SubSector: Information Technology Services | |
| MarketCap: 25.2468 Millions | |
| Recent Price: 13.98 Smart Investing & Trading Score: 18 | |
| Day Percent Change: -2.44% Day Change: -0.35 | |
| Week Change: -1.89% Year-to-date Change: -28.3% | |
| CSPI Links: Profile News Message Board | |
| Charts:- Daily , Weekly | |
| Add CSPI to Watchlist: View: Get Complete CSPI Trend Analysis ➞ | |
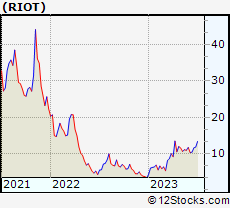 | RIOT Riot Blockchain, Inc. |
| Sector: Technology | |
| SubSector: Application Software | |
| MarketCap: 24.8662 Millions | |
| Recent Price: 11.88 Smart Investing & Trading Score: 100 | |
| Day Percent Change: 0.25% Day Change: 0.03 | |
| Week Change: 30.12% Year-to-date Change: -23.2% | |
| RIOT Links: Profile News Message Board | |
| Charts:- Daily , Weekly | |
| Add RIOT to Watchlist: View: Get Complete RIOT Trend Analysis ➞ | |
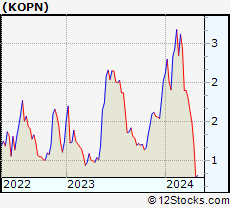 | KOPN Kopin Corporation |
| Sector: Technology | |
| SubSector: Semiconductor - Broad Line | |
| MarketCap: 24.2242 Millions | |
| Recent Price: 0.86 Smart Investing & Trading Score: 0 | |
| Day Percent Change: -10.93% Day Change: -0.11 | |
| Week Change: -29.67% Year-to-date Change: -57.7% | |
| KOPN Links: Profile News Message Board | |
| Charts:- Daily , Weekly | |
| Add KOPN to Watchlist: View: Get Complete KOPN Trend Analysis ➞ | |
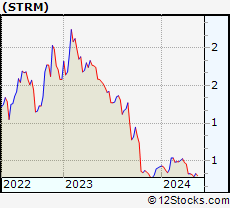 | STRM Streamline Health Solutions, Inc. |
| Sector: Technology | |
| SubSector: Healthcare Information Services | |
| MarketCap: 24.2155 Millions | |
| Recent Price: 0.34 Smart Investing & Trading Score: 42 | |
| Day Percent Change: 2.72% Day Change: 0.01 | |
| Week Change: 2.72% Year-to-date Change: -20.0% | |
| STRM Links: Profile News Message Board | |
| Charts:- Daily , Weekly | |
| Add STRM to Watchlist: View: Get Complete STRM Trend Analysis ➞ | |
 | CLPS CLPS Incorporation |
| Sector: Technology | |
| SubSector: Information Technology Services | |
| MarketCap: 23.7468 Millions | |
| Recent Price: 0.99 Smart Investing & Trading Score: 7 | |
| Day Percent Change: 2.06% Day Change: 0.02 | |
| Week Change: 5.32% Year-to-date Change: -6.6% | |
| CLPS Links: Profile News Message Board | |
| Charts:- Daily , Weekly | |
| Add CLPS to Watchlist: View: Get Complete CLPS Trend Analysis ➞ | |
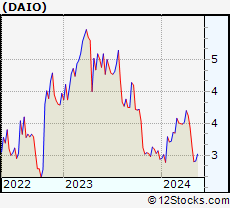 | DAIO Data I/O Corporation |
| Sector: Technology | |
| SubSector: Diversified Electronics | |
| MarketCap: 22.6396 Millions | |
| Recent Price: 3.53 Smart Investing & Trading Score: 68 | |
| Day Percent Change: -1.12% Day Change: -0.04 | |
| Week Change: 2.92% Year-to-date Change: 20.1% | |
| DAIO Links: Profile News Message Board | |
| Charts:- Daily , Weekly | |
| Add DAIO to Watchlist: View: Get Complete DAIO Trend Analysis ➞ | |
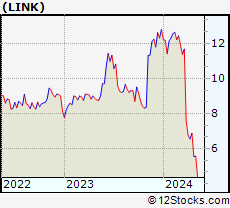 | LINK Interlink Electronics, Inc. |
| Sector: Technology | |
| SubSector: Diversified Electronics | |
| MarketCap: 22.3396 Millions | |
| Recent Price: 6.80 Smart Investing & Trading Score: 23 | |
| Day Percent Change: 0.00% Day Change: 0.00 | |
| Week Change: -1.02% Year-to-date Change: -46.8% | |
| LINK Links: Profile News Message Board | |
| Charts:- Daily , Weekly | |
| Add LINK to Watchlist: View: Get Complete LINK Trend Analysis ➞ | |
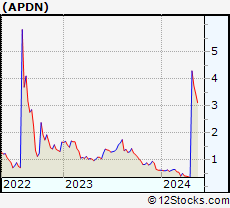 | APDN Applied DNA Sciences, Inc. |
| Sector: Technology | |
| SubSector: Security Software & Services | |
| MarketCap: 21.6317 Millions | |
| Recent Price: 0.24 Smart Investing & Trading Score: 0 | |
| Day Percent Change: -17.66% Day Change: -0.05 | |
| Week Change: -30.4% Year-to-date Change: -61.3% | |
| APDN Links: Profile News Message Board | |
| Charts:- Daily , Weekly | |
| Add APDN to Watchlist: View: Get Complete APDN Trend Analysis ➞ | |
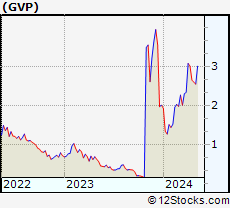 | GVP GSE Systems, Inc. |
| Sector: Technology | |
| SubSector: Business Software & Services | |
| MarketCap: 20.1758 Millions | |
| Recent Price: 2.81 Smart Investing & Trading Score: 68 | |
| Day Percent Change: 4.07% Day Change: 0.11 | |
| Week Change: 6.04% Year-to-date Change: 39.8% | |
| GVP Links: Profile News Message Board | |
| Charts:- Daily , Weekly | |
| Add GVP to Watchlist: View: Get Complete GVP Trend Analysis ➞ | |
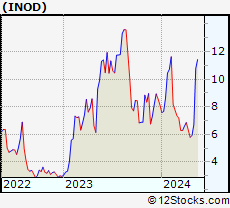 | INOD Innodata Inc. |
| Sector: Technology | |
| SubSector: Information Technology Services | |
| MarketCap: 19.9468 Millions | |
| Recent Price: 6.33 Smart Investing & Trading Score: 34 | |
| Day Percent Change: 10.28% Day Change: 0.59 | |
| Week Change: 9.14% Year-to-date Change: -22.2% | |
| INOD Links: Profile News Message Board | |
| Charts:- Daily , Weekly | |
| Add INOD to Watchlist: View: Get Complete INOD Trend Analysis ➞ | |
 | NCTY The9 Limited |
| Sector: Technology | |
| SubSector: Multimedia & Graphics Software | |
| MarketCap: 19.7586 Millions | |
| Recent Price: 6.72 Smart Investing & Trading Score: 95 | |
| Day Percent Change: 3.23% Day Change: 0.21 | |
| Week Change: 10.53% Year-to-date Change: -10.3% | |
| NCTY Links: Profile News Message Board | |
| Charts:- Daily , Weekly | |
| Add NCTY to Watchlist: View: Get Complete NCTY Trend Analysis ➞ | |
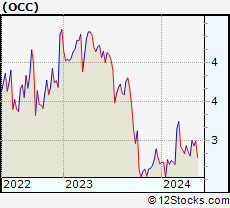 | OCC Optical Cable Corporation |
| Sector: Technology | |
| SubSector: Communication Equipment | |
| MarketCap: 19.5539 Millions | |
| Recent Price: 2.72 Smart Investing & Trading Score: 36 | |
| Day Percent Change: 0.37% Day Change: 0.01 | |
| Week Change: -2.86% Year-to-date Change: 0.7% | |
| OCC Links: Profile News Message Board | |
| Charts:- Daily , Weekly | |
| Add OCC to Watchlist: View: Get Complete OCC Trend Analysis ➞ | |
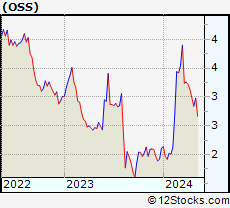 | OSS One Stop Systems, Inc. |
| Sector: Technology | |
| SubSector: Computer Peripherals | |
| MarketCap: 18.8989 Millions | |
| Recent Price: 2.84 Smart Investing & Trading Score: 36 | |
| Day Percent Change: 2.16% Day Change: 0.06 | |
| Week Change: -4.7% Year-to-date Change: 34.6% | |
| OSS Links: Profile News Message Board | |
| Charts:- Daily , Weekly | |
| Add OSS to Watchlist: View: Get Complete OSS Trend Analysis ➞ | |
| For tabular summary view of above stock list: Summary View ➞ 0 - 25 , 25 - 50 , 50 - 75 , 75 - 100 | ||
| Click To Change The Sort Order: By Market Cap or Company Size Performance: Year-to-date, Week and Day | |
| Select Chart Type: | ||
|
Best Stocks Today 12Stocks.com |
© 2024 12Stocks.com Terms & Conditions Privacy Contact Us
All Information Provided Only For Education And Not To Be Used For Investing or Trading. See Terms & Conditions


One More Thing ... Get Best Stocks Delivered Daily!
Never Ever Miss A Move With Our Top Ten Stocks Lists
Find Best Stocks In Any Market - Bull or Bear Market
Take A Peek At Our Top Ten Stocks Lists: Daily, Weekly, Year-to-Date & Top Trends
Find Best Stocks In Any Market - Bull or Bear Market
Take A Peek At Our Top Ten Stocks Lists: Daily, Weekly, Year-to-Date & Top Trends
Technology Stocks With Best Up Trends [0-bearish to 100-bullish]: Amesite [100], Ribbon [100], Allegro MicroSystems[100], Texas [100], Microchip [100], EchoStar [100], Analog Devices[100], Vishay Inter[100], JD.com [100], Sea [100], Jamf Holding[100]
Best Technology Stocks Year-to-Date:
Pagaya [581.02%], MicroCloud Hologram[574.82%], MediaCo Holding[364.79%], Uxin [169.61%], CXApp [167.95%], Super Micro[165.5%], Smith Micro[162.71%], SoundHound AI[103.27%], MicroStrategy [100.38%], GigaCloud [96.01%], NextNav [95.73%] Best Technology Stocks This Week:
Matterport [166.09%], Amesite [69.72%], WiMi Hologram[64.85%], Ribbon [25.97%], HashiCorp [23.7%], SoundHound AI[22.54%], Intchains [20.36%], iQIYI [17.99%], Bilibili [16.87%], FTC Solar[16.56%], BigBear.ai [16.55%] Best Technology Stocks Daily:
Amesite [65.50%], WiMi Hologram[58.53%], Ribbon [26.46%], Intchains [22.28%], Uxin [13.86%], Bilibili [10.97%], Comtech Tele[10.76%], Mitcham Industries[9.88%], Navitas Semiconductor[8.83%], FTC Solar[8.51%], AMTD Digital[8.33%]