
 Login Sign Up


| |||||
 |  | ||||

| 12Stocks.com Market Intelligence |
Best Tech Stocks
| In a hurry? Tech Stocks Lists: Performance & Trends, Stock Charts, FANG Stocks
Sort Tech stocks: Daily, Weekly, Year-to-Date, Market Cap & Trends. Filter Tech stocks list by size:All Tech Large Mid-Range Small and MicroCap |
| 12Stocks.com Tech Stocks Performances & Trends Daily | |||||||||
|
|  The overall Smart Investing & Trading Score is 0 (0-bearish to 100-bullish) which puts Technology sector in short term bearish trend. The Smart Investing & Trading Score from previous trading session is 13 and hence a deterioration of trend.
| ||||||||
Here are the Smart Investing & Trading Scores of the most requested Technology stocks at 12Stocks.com (click stock name for detailed review):
|


| 12Stocks.com: Investing in Technology sector with Stocks | |
|
The following table helps investors and traders sort through current performance and trends (as measured by Smart Investing & Trading Score) of various
stocks in the Tech sector. Quick View: Move mouse or cursor over stock symbol (ticker) to view short-term technical chart and over stock name to view long term chart. Click on  to add stock symbol to your watchlist and to add stock symbol to your watchlist and  to view watchlist. Click on any ticker or stock name for detailed market intelligence report for that stock. to view watchlist. Click on any ticker or stock name for detailed market intelligence report for that stock. |
12Stocks.com Performance of Stocks in Tech Sector
| Ticker | Stock Name | Watchlist | Category | Recent Price | Smart Investing & Trading Score | Change % | YTD Change% |
| RSKD | Riskified |   | Software - | 4.88 | 56 | -2.40% | 4.17% |
| UPWK | Upwork | | Internet | 11.13 | 42 | -0.89% | -25.15% |
| PHR | Phreesia | | Healthcare Information | 21.68 | 10 | -4.13% | -6.33% |
| SNPO | Snap One | | Electronics & Computer Distribution | 10.55 | 81 | -0.09% | 13.56% |
| CINT | CI&T | | Software - Infrastructure | 4.05 | 40 | -1.10% | -23.94% |
| EB | Eventbrite | | Software | 5.17 | 25 | 0.39% | -38.16% |
| UIS | Unisys | | IT | 5.48 | 50 | -0.18% | -2.49% |
| HSTM | HealthStream | | Healthcare Information | 24.84 | 17 | 3.54% | -8.10% |
| BHE | Benchmark Electronics | | Circuit Boards | 29.63 | 68 | -0.77% | 7.20% |
| MXL | MaxLinear | | Semiconductor | 19.62 | 25 | -3.21% | -17.46% |
| WEAV | Weave | | Software - | 10.75 | 0 | -2.97% | -7.49% |
| FORTY | Formula Systems | | IT | 72.21 | 31 | -2.62% | 10.56% |
| SMRT | SmartRent | | Software - | 2.29 | 0 | -2.97% | -28.21% |
| PLUS | ePlus | | Software | 75.32 | 13 | 0.05% | -5.66% |
| KARO | Karooooo | | Software - | 27.09 | 100 | 3.20% | 9.45% |
| BASE | Couchbase | | Software - Infrastructure | 22.57 | 0 | -6.66% | -0.97% |
| FARO | FARO | | Instruments | 18.70 | 15 | 2.07% | -17.00% |
| OPRA | Opera | | Internet | 13.91 | 31 | -6.14% | 5.14% |
| PLAB | Photronics | | Semiconductor | 25.33 | 0 | -2.91% | -19.25% |
| ATEX | Anterix | | Telecom | 31.80 | 44 | 1.56% | -4.56% |
| NRDY | Nerdy | | Software - | 2.54 | 10 | -5.04% | -25.91% |
| VMEO | Vimeo | | Software - | 3.50 | 15 | -4.12% | -10.96% |
| EXFY | Expensify | | Software - | 1.62 | 47 | -6.90% | -35.71% |
| MODN | Model N | | Software | 29.62 | 69 | -0.50% | 9.99% |
| DQ | Daqo New | | Semiconductor | 22.11 | 46 | -2.66% | -16.90% |
| For chart view version of above stock list: Chart View ➞ 0 - 25 , 25 - 50 , 50 - 75 , 75 - 100 , 100 - 125 , 125 - 150 , 150 - 175 , 175 - 200 , 200 - 225 , 225 - 250 , 250 - 275 , 275 - 300 , 300 - 325 , 325 - 350 , 350 - 375 , 375 - 400 , 400 - 425 , 425 - 450 , 450 - 475 , 475 - 500 , 500 - 525 , 525 - 550 , 550 - 575 , 575 - 600 , 600 - 625 , 625 - 650 | ||
 | Click To Change The Sort Order: By Market Cap or Company Size Performance: Year-to-date, Week and Day |  |
|
Get the most comprehensive stock market coverage daily at 12Stocks.com ➞ Best Stocks Today ➞ Best Stocks Weekly ➞ Best Stocks Year-to-Date ➞ Best Stocks Trends ➞  Best Stocks Today 12Stocks.com Best Nasdaq Stocks ➞ Best S&P 500 Stocks ➞ Best Tech Stocks ➞ Best Biotech Stocks ➞ |
| Detailed Overview of Tech Stocks |
| Tech Technical Overview, Leaders & Laggards, Top Tech ETF Funds & Detailed Tech Stocks List, Charts, Trends & More |
| Tech Sector: Technical Analysis, Trends & YTD Performance | |
| Technology sector is composed of stocks
from semiconductors, software, web, social media
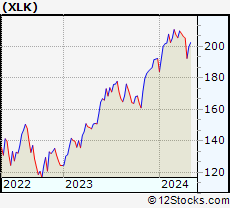
and services subsectors. Technology sector, as represented by XLK, an exchange-traded fund [ETF] that holds basket of tech stocks (e.g, Intel, Google) is up by 0.03% and is currently underperforming the overall market by -3.36% year-to-date. Below is a quick view of technical charts and trends: |
|
 XLK Weekly Chart |
|
| Long Term Trend: Not Good | |
| Medium Term Trend: Not Good | |
 XLK Daily Chart |
|
| Short Term Trend: Not Good | |
| Overall Trend Score: 0 | |
| YTD Performance: 0.03% | |
| **Trend Scores & Views Are Only For Educational Purposes And Not For Investing | |
| 12Stocks.com: Top Performing Technology Sector Stocks | ||||||||||||||||||||||||||||||||||||||||||||||||
 The top performing Technology sector stocks year to date are
Now, more recently, over last week, the top performing Technology sector stocks on the move are


|
||||||||||||||||||||||||||||||||||||||||||||||||
| 12Stocks.com: Investing in Tech Sector using Exchange Traded Funds | |
|
The following table shows list of key exchange traded funds (ETF) that
help investors track Tech Index. For detailed view, check out our ETF Funds section of our website. Quick View: Move mouse or cursor over ETF symbol (ticker) to view short-term technical chart and over ETF name to view long term chart. Click on ticker or stock name for detailed view. Click on to add stock symbol to your watchlist and to view watchlist. |
12Stocks.com List of ETFs that track Tech Index
| Ticker | ETF Name | Watchlist | Recent Price | Smart Investing & Trading Score | Change % | Week % | Year-to-date % |
| XLK | Technology | | 192.53 | 0 | -2.06 | -6.27 | 0.03% |
| QQQ | QQQ | | 414.72 | 13 | -2.05 | -5.37 | 1.27% |
| IYW | Technology | | 124.77 | 36 | -2.83 | -6.85 | 1.65% |
| VGT | Information Technology | | 479.82 | 23 | -2.67 | -6.77 | -0.86% |
| IXN | Global Tech | | 68.72 | 36 | -2.65 | -6.88 | 0.79% |
| IGV | Tech-Software | | 78.55 | 10 | -1.19 | -5.09 | -3.18% |
| XSD | Semiconductor | | 203.30 | 23 | -3.27 | -8.9 | -9.56% |
| TQQQ | QQQ | | 49.47 | 0 | -6.22 | -15.75 | -2.43% |
| SQQQ | Short QQQ | | 12.86 | 95 | 6.55 | 18.09 | -4.39% |
| SOXL | Semicondct Bull 3X | | 30.73 | 0 | -11.97 | -25.97 | -2.13% |
| SOXS | Semicondct Bear 3X | | 46.13 | 90 | 11.78 | 1210.51 | 692.61% |
| SOXX | PHLX Semiconductor | | 198.46 | 36 | -3.95 | -8.99 | 3.35% |
| QTEC | First -100-Tech | | 173.85 | 10 | -2.26 | -6.54 | -0.92% |
| SMH | Semiconductor | | 199.17 | 26 | -4.53 | -9.75 | 13.9% |
| 12Stocks.com: Charts, Trends, Fundamental Data and Performances of Tech Stocks | |
|
We now take in-depth look at all Tech stocks including charts, multi-period performances and overall trends (as measured by Smart Investing & Trading Score). One can sort Tech stocks (click link to choose) by Daily, Weekly and by Year-to-Date performances. Also, one can sort by size of the company or by market capitalization. |
| Select Your Default Chart Type: | |||||
| |||||
| Click on stock symbol or name for detailed view. Click on to add stock symbol to your watchlist and to view watchlist. Quick View: Move mouse or cursor over "Daily" to quickly view daily technical stock chart and over "Weekly" to view weekly technical stock chart. | |||||


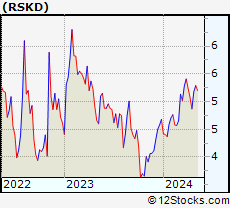 | RSKD Riskified Ltd. |
| Sector: Technology | |
| SubSector: Software - Application | |
| MarketCap: 819 Millions | |
| Recent Price: 4.88 Smart Investing & Trading Score: 56 | |
| Day Percent Change: -2.40% Day Change: -0.12 | |
| Week Change: -4.04% Year-to-date Change: 4.2% | |
| RSKD Links: Profile News Message Board | |
| Charts:- Daily , Weekly | |
| Add RSKD to Watchlist: View: Get Complete RSKD Trend Analysis ➞ | |
 | UPWK Upwork Inc. |
| Sector: Technology | |
| SubSector: Internet Information Providers | |
| MarketCap: 815.98 Millions | |
| Recent Price: 11.13 Smart Investing & Trading Score: 42 | |
| Day Percent Change: -0.89% Day Change: -0.10 | |
| Week Change: -4.3% Year-to-date Change: -25.2% | |
| UPWK Links: Profile News Message Board | |
| Charts:- Daily , Weekly | |
| Add UPWK to Watchlist: View: Get Complete UPWK Trend Analysis ➞ | |
 | PHR Phreesia, Inc. |
| Sector: Technology | |
| SubSector: Healthcare Information Services | |
| MarketCap: 810.255 Millions | |
| Recent Price: 21.68 Smart Investing & Trading Score: 10 | |
| Day Percent Change: -4.13% Day Change: -0.94 | |
| Week Change: -8.04% Year-to-date Change: -6.3% | |
| PHR Links: Profile News Message Board | |
| Charts:- Daily , Weekly | |
| Add PHR to Watchlist: View: Get Complete PHR Trend Analysis ➞ | |
 | SNPO Snap One Holdings Corp. |
| Sector: Technology | |
| SubSector: Electronics & Computer Distribution | |
| MarketCap: 807 Millions | |
| Recent Price: 10.55 Smart Investing & Trading Score: 81 | |
| Day Percent Change: -0.09% Day Change: -0.01 | |
| Week Change: 29.61% Year-to-date Change: 13.6% | |
| SNPO Links: Profile News Message Board | |
| Charts:- Daily , Weekly | |
| Add SNPO to Watchlist: View: Get Complete SNPO Trend Analysis ➞ | |
 | CINT CI&T Inc |
| Sector: Technology | |
| SubSector: Software - Infrastructure | |
| MarketCap: 806 Millions | |
| Recent Price: 4.05 Smart Investing & Trading Score: 40 | |
| Day Percent Change: -1.10% Day Change: -0.04 | |
| Week Change: -13.83% Year-to-date Change: -23.9% | |
| CINT Links: Profile News Message Board | |
| Charts:- Daily , Weekly | |
| Add CINT to Watchlist: View: Get Complete CINT Trend Analysis ➞ | |
 | EB Eventbrite, Inc. |
| Sector: Technology | |
| SubSector: Application Software | |
| MarketCap: 805.262 Millions | |
| Recent Price: 5.17 Smart Investing & Trading Score: 25 | |
| Day Percent Change: 0.39% Day Change: 0.02 | |
| Week Change: -5.14% Year-to-date Change: -38.2% | |
| EB Links: Profile News Message Board | |
| Charts:- Daily , Weekly | |
| Add EB to Watchlist: View: Get Complete EB Trend Analysis ➞ | |
 | UIS Unisys Corporation |
| Sector: Technology | |
| SubSector: Information Technology Services | |
| MarketCap: 803.868 Millions | |
| Recent Price: 5.48 Smart Investing & Trading Score: 50 | |
| Day Percent Change: -0.18% Day Change: -0.01 | |
| Week Change: -2.32% Year-to-date Change: -2.5% | |
| UIS Links: Profile News Message Board | |
| Charts:- Daily , Weekly | |
| Add UIS to Watchlist: View: Get Complete UIS Trend Analysis ➞ | |
 | HSTM HealthStream, Inc. |
| Sector: Technology | |
| SubSector: Healthcare Information Services | |
| MarketCap: 770.255 Millions | |
| Recent Price: 24.84 Smart Investing & Trading Score: 17 | |
| Day Percent Change: 3.54% Day Change: 0.85 | |
| Week Change: 0.32% Year-to-date Change: -8.1% | |
| HSTM Links: Profile News Message Board | |
| Charts:- Daily , Weekly | |
| Add HSTM to Watchlist: View: Get Complete HSTM Trend Analysis ➞ | |
 | BHE Benchmark Electronics, Inc. |
| Sector: Technology | |
| SubSector: Printed Circuit Boards | |
| MarketCap: 766.835 Millions | |
| Recent Price: 29.63 Smart Investing & Trading Score: 68 | |
| Day Percent Change: -0.77% Day Change: -0.23 | |
| Week Change: 0.44% Year-to-date Change: 7.2% | |
| BHE Links: Profile News Message Board | |
| Charts:- Daily , Weekly | |
| Add BHE to Watchlist: View: Get Complete BHE Trend Analysis ➞ | |
 | MXL MaxLinear, Inc. |
| Sector: Technology | |
| SubSector: Semiconductor - Integrated Circuits | |
| MarketCap: 751.31 Millions | |
| Recent Price: 19.62 Smart Investing & Trading Score: 25 | |
| Day Percent Change: -3.21% Day Change: -0.65 | |
| Week Change: -11.02% Year-to-date Change: -17.5% | |
| MXL Links: Profile News Message Board | |
| Charts:- Daily , Weekly | |
| Add MXL to Watchlist: View: Get Complete MXL Trend Analysis ➞ | |
 | WEAV Weave Communications, Inc. |
| Sector: Technology | |
| SubSector: Software - Application | |
| MarketCap: 740 Millions | |
| Recent Price: 10.75 Smart Investing & Trading Score: 0 | |
| Day Percent Change: -2.97% Day Change: -0.33 | |
| Week Change: -7.17% Year-to-date Change: -7.5% | |
| WEAV Links: Profile News Message Board | |
| Charts:- Daily , Weekly | |
| Add WEAV to Watchlist: View: Get Complete WEAV Trend Analysis ➞ | |
 | FORTY Formula Systems (1985) Ltd. |
| Sector: Technology | |
| SubSector: Information Technology Services | |
| MarketCap: 735.768 Millions | |
| Recent Price: 72.21 Smart Investing & Trading Score: 31 | |
| Day Percent Change: -2.62% Day Change: -1.94 | |
| Week Change: -8.68% Year-to-date Change: 10.6% | |
| FORTY Links: Profile News Message Board | |
| Charts:- Daily , Weekly | |
| Add FORTY to Watchlist: View: Get Complete FORTY Trend Analysis ➞ | |
 | SMRT SmartRent, Inc. |
| Sector: Technology | |
| SubSector: Software - Application | |
| MarketCap: 733 Millions | |
| Recent Price: 2.29 Smart Investing & Trading Score: 0 | |
| Day Percent Change: -2.97% Day Change: -0.07 | |
| Week Change: -6.15% Year-to-date Change: -28.2% | |
| SMRT Links: Profile News Message Board | |
| Charts:- Daily , Weekly | |
| Add SMRT to Watchlist: View: Get Complete SMRT Trend Analysis ➞ | |
 | PLUS ePlus inc. |
| Sector: Technology | |
| SubSector: Application Software | |
| MarketCap: 728.262 Millions | |
| Recent Price: 75.32 Smart Investing & Trading Score: 13 | |
| Day Percent Change: 0.05% Day Change: 0.04 | |
| Week Change: -2.27% Year-to-date Change: -5.7% | |
| PLUS Links: Profile News Message Board | |
| Charts:- Daily , Weekly | |
| Add PLUS to Watchlist: View: Get Complete PLUS Trend Analysis ➞ | |
 | KARO Karooooo Ltd. |
| Sector: Technology | |
| SubSector: Software - Application | |
| MarketCap: 728 Millions | |
| Recent Price: 27.09 Smart Investing & Trading Score: 100 | |
| Day Percent Change: 3.20% Day Change: 0.84 | |
| Week Change: 3.79% Year-to-date Change: 9.5% | |
| KARO Links: Profile News Message Board | |
| Charts:- Daily , Weekly | |
| Add KARO to Watchlist: View: Get Complete KARO Trend Analysis ➞ | |
 | BASE Couchbase, Inc. |
| Sector: Technology | |
| SubSector: Software - Infrastructure | |
| MarketCap: 724 Millions | |
| Recent Price: 22.57 Smart Investing & Trading Score: 0 | |
| Day Percent Change: -6.66% Day Change: -1.61 | |
| Week Change: -8.51% Year-to-date Change: -1.0% | |
| BASE Links: Profile News Message Board | |
| Charts:- Daily , Weekly | |
| Add BASE to Watchlist: View: Get Complete BASE Trend Analysis ➞ | |
 | FARO FARO Technologies, Inc. |
| Sector: Technology | |
| SubSector: Scientific & Technical Instruments | |
| MarketCap: 721.953 Millions | |
| Recent Price: 18.70 Smart Investing & Trading Score: 15 | |
| Day Percent Change: 2.07% Day Change: 0.38 | |
| Week Change: -6.41% Year-to-date Change: -17.0% | |
| FARO Links: Profile News Message Board | |
| Charts:- Daily , Weekly | |
| Add FARO to Watchlist: View: Get Complete FARO Trend Analysis ➞ | |
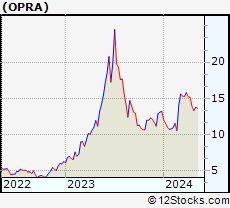 | OPRA Opera Limited |
| Sector: Technology | |
| SubSector: Internet Information Providers | |
| MarketCap: 721.68 Millions | |
| Recent Price: 13.91 Smart Investing & Trading Score: 31 | |
| Day Percent Change: -6.14% Day Change: -0.91 | |
| Week Change: -8.18% Year-to-date Change: 5.1% | |
| OPRA Links: Profile News Message Board | |
| Charts:- Daily , Weekly | |
| Add OPRA to Watchlist: View: Get Complete OPRA Trend Analysis ➞ | |
 | PLAB Photronics, Inc. |
| Sector: Technology | |
| SubSector: Semiconductor Equipment & Materials | |
| MarketCap: 709.018 Millions | |
| Recent Price: 25.33 Smart Investing & Trading Score: 0 | |
| Day Percent Change: -2.91% Day Change: -0.76 | |
| Week Change: -8.32% Year-to-date Change: -19.3% | |
| PLAB Links: Profile News Message Board | |
| Charts:- Daily , Weekly | |
| Add PLAB to Watchlist: View: Get Complete PLAB Trend Analysis ➞ | |
 | ATEX Anterix Inc. |
| Sector: Technology | |
| SubSector: Telecom Services - Domestic | |
| MarketCap: 694.077 Millions | |
| Recent Price: 31.80 Smart Investing & Trading Score: 44 | |
| Day Percent Change: 1.56% Day Change: 0.49 | |
| Week Change: -1.03% Year-to-date Change: -4.6% | |
| ATEX Links: Profile News Message Board | |
| Charts:- Daily , Weekly | |
| Add ATEX to Watchlist: View: Get Complete ATEX Trend Analysis ➞ | |
 | NRDY Nerdy, Inc. |
| Sector: Technology | |
| SubSector: Software - Application | |
| MarketCap: 683 Millions | |
| Recent Price: 2.54 Smart Investing & Trading Score: 10 | |
| Day Percent Change: -5.04% Day Change: -0.14 | |
| Week Change: -5.39% Year-to-date Change: -25.9% | |
| NRDY Links: Profile News Message Board | |
| Charts:- Daily , Weekly | |
| Add NRDY to Watchlist: View: Get Complete NRDY Trend Analysis ➞ | |
 | VMEO Vimeo, Inc. |
| Sector: Technology | |
| SubSector: Software - Application | |
| MarketCap: 678 Millions | |
| Recent Price: 3.50 Smart Investing & Trading Score: 15 | |
| Day Percent Change: -4.12% Day Change: -0.15 | |
| Week Change: -3.19% Year-to-date Change: -11.0% | |
| VMEO Links: Profile News Message Board | |
| Charts:- Daily , Weekly | |
| Add VMEO to Watchlist: View: Get Complete VMEO Trend Analysis ➞ | |
 | EXFY Expensify, Inc. |
| Sector: Technology | |
| SubSector: Software - Application | |
| MarketCap: 678 Millions | |
| Recent Price: 1.62 Smart Investing & Trading Score: 47 | |
| Day Percent Change: -6.90% Day Change: -0.12 | |
| Week Change: 10.2% Year-to-date Change: -35.7% | |
| EXFY Links: Profile News Message Board | |
| Charts:- Daily , Weekly | |
| Add EXFY to Watchlist: View: Get Complete EXFY Trend Analysis ➞ | |
 | MODN Model N, Inc. |
| Sector: Technology | |
| SubSector: Application Software | |
| MarketCap: 670.162 Millions | |
| Recent Price: 29.62 Smart Investing & Trading Score: 69 | |
| Day Percent Change: -0.50% Day Change: -0.15 | |
| Week Change: -0.34% Year-to-date Change: 10.0% | |
| MODN Links: Profile News Message Board | |
| Charts:- Daily , Weekly | |
| Add MODN to Watchlist: View: Get Complete MODN Trend Analysis ➞ | |
 | DQ Daqo New Energy Corp. |
| Sector: Technology | |
| SubSector: Semiconductor Equipment & Materials | |
| MarketCap: 660.918 Millions | |
| Recent Price: 22.11 Smart Investing & Trading Score: 46 | |
| Day Percent Change: -2.66% Day Change: -0.61 | |
| Week Change: -5.29% Year-to-date Change: -16.9% | |
| DQ Links: Profile News Message Board | |
| Charts:- Daily , Weekly | |
| Add DQ to Watchlist: View: Get Complete DQ Trend Analysis ➞ | |
| For tabular summary view of above stock list: Summary View ➞ 0 - 25 , 25 - 50 , 50 - 75 , 75 - 100 , 100 - 125 , 125 - 150 , 150 - 175 , 175 - 200 , 200 - 225 , 225 - 250 , 250 - 275 , 275 - 300 , 300 - 325 , 325 - 350 , 350 - 375 , 375 - 400 , 400 - 425 , 425 - 450 , 450 - 475 , 475 - 500 , 500 - 525 , 525 - 550 , 550 - 575 , 575 - 600 , 600 - 625 , 625 - 650 | ||
| Click To Change The Sort Order: By Market Cap or Company Size Performance: Year-to-date, Week and Day | |
| Select Chart Type: | ||
|
Best Stocks Today 12Stocks.com |
© 2024 12Stocks.com Terms & Conditions Privacy Contact Us
All Information Provided Only For Education And Not To Be Used For Investing or Trading. See Terms & Conditions


One More Thing ... Get Best Stocks Delivered Daily!
Never Ever Miss A Move With Our Top Ten Stocks Lists
Find Best Stocks In Any Market - Bull or Bear Market
Take A Peek At Our Top Ten Stocks Lists: Daily, Weekly, Year-to-Date & Top Trends
Find Best Stocks In Any Market - Bull or Bear Market
Take A Peek At Our Top Ten Stocks Lists: Daily, Weekly, Year-to-Date & Top Trends
Technology Stocks With Best Up Trends [0-bearish to 100-bullish]: Cricut [100], Karooooo [100], Payoneer Global[100], Badger Meter[100], Turkcell Iletisim[93], Full Truck[93], Grab [93], Zuora [93], GDS [88], GigaCloud [88], So-Young [83]
Best Technology Stocks Year-to-Date:
MediaCo Holding[544.37%], CXApp [157.92%], Smith Micro[151.82%], Super Micro[151.19%], Uxin [141.08%], CuriosityStream [107.37%], GigaCloud [95.49%], MicroStrategy [86.05%], NextNav [78.88%], D-Wave Quantum[74.38%], AppLovin [67.63%] Best Technology Stocks This Week:
Snap One[29.61%], Badger Meter[15.61%], Mynaric AG[11.76%], Iridium [11.07%], Expensify [10.2%], SYLA [9.96%], Encore Wire[8.98%], Quhuo [8.87%], Bentley Systems[7.96%], Applied Optoelectronics[7.93%], Zuora [7.67%] Best Technology Stocks Daily:
CuriosityStream [10.89%], Markforged Holding[6.04%], CXApp [5.36%], Iridium [5.14%], Aerohive Networks[4.42%], Cheetah Mobile[4.15%], Applied Optoelectronics[3.95%], Tigo Energy[3.86%], QuinStreet [3.77%], Cricut [3.69%], ATN [3.68%]