
 Login Sign Up


| |||||
 |  | ||||

| 12Stocks.com Market Intelligence |
Best SmallCap Stocks
|
| In a hurry? Small Cap Stock Lists: Performance Trends Table, Stock Charts
Sort Small Cap stocks: Daily, Weekly, Year-to-Date, Market Cap & Trends. Filter Small Cap stocks list by sector: Show all, Tech, Finance, Energy, Staples, Retail, Industrial, Materials, Utilities and HealthCare Filter Small Cap stocks list by size: All Large Medium Small and MicroCap |
| 12Stocks.com Small Cap Stocks Performances & Trends Daily | |||||||||
|
|  The overall Smart Investing & Trading Score is 58 (0-bearish to 100-bullish) which puts Small Cap index in short term neutral trend. The Smart Investing & Trading Score from previous trading session is 63 and hence a deterioration of trend.
| ||||||||
Here are the Smart Investing & Trading Scores of the most requested small cap stocks at 12Stocks.com (click stock name for detailed review):
|


| 12Stocks.com: Investing in Smallcap Index with Stocks | |
|
The following table helps investors and traders sort through current performance and trends (as measured by Smart Investing & Trading Score) of various
stocks in the Smallcap Index. Quick View: Move mouse or cursor over stock symbol (ticker) to view short-term technical chart and over stock name to view long term chart. Click on  to add stock symbol to your watchlist and to add stock symbol to your watchlist and  to view watchlist. Click on any ticker or stock name for detailed market intelligence report for that stock. to view watchlist. Click on any ticker or stock name for detailed market intelligence report for that stock. |
12Stocks.com Performance of Stocks in Smallcap Index
| Ticker | Stock Name | Watchlist | Category | Recent Price | Smart Investing & Trading Score | Change % | YTD Change% |
| RNST | Renasant |   | Financials | 29.45 | 67 | -3.95% | -12.56% |
| WSBC | WesBanco | | Financials | 27.43 | 47 | -3.01% | -12.56% |
| SBSI | Southside Bancshares | | Financials | 27.37 | 52 | -3.56% | -12.61% |
| BHB | Bar Harbor | | Financials | 25.66 | 60 | -0.37% | -12.62% |
| AMBC | Ambac Financial | | Financials | 14.40 | 25 | -0.96% | -12.62% |
| VBTX | Veritex | | Financials | 20.33 | 69 | -2.21% | -12.63% |
| ASIX | AdvanSix | | Materials | 26.16 | 36 | -1.80% | -12.68% |
| ANAB | AnaptysBio | | Health Care | 18.70 | 0 | -2.96% | -12.70% |
| PRO | PROS | | Technology | 33.86 | 32 | -2.20% | -12.71% |
| DEA | Easterly Government | | Financials | 11.73 | 67 | -1.22% | -12.76% |
| FTDR | frontdoor | | Services & Goods | 30.72 | 37 | -0.65% | -12.78% |
| THS | TreeHouse Foods | | Consumer Staples | 36.13 | 37 | -1.67% | -12.82% |
| DCPH | Deciphera | | Health Care | 14.06 | 48 | -3.83% | -12.83% |
| SPSC | SPS Commerce | | Technology | 168.94 | 49 | -1.28% | -12.85% |
| ALKS | Alkermes | | Health Care | 24.16 | 49 | -1.99% | -12.91% |
| BOOM | DMC Global | | Industrials | 16.39 | 30 | -1.80% | -12.91% |
| IPAR | Inter Parfums | | Consumer Staples | 125.34 | 42 | -3.97% | -12.96% |
| SFNC | Simmons First | | Financials | 17.25 | 17 | -5.35% | -13.03% |
| UCBI | United Community | | Financials | 25.44 | 74 | -3.38% | -13.06% |
| XNCR | Xencor | | Health Care | 18.44 | 17 | -3.05% | -13.14% |
| NMRK | Newmark Group | | Financials | 9.52 | 10 | -2.36% | -13.14% |
| AWR | American States | | Utilities | 69.84 | 74 | -1.30% | -13.16% |
| PLAB | Photronics | | Technology | 27.24 | 42 | -0.98% | -13.17% |
| SEMR | Semrush | | Technology | 12.06 | 73 | -1.71% | -13.17% |
| ROIC | Retail Opportunity | | Financials | 12.18 | 74 | -1.77% | -13.19% |
| For chart view version of above stock list: Chart View ➞ 0 - 25 , 25 - 50 , 50 - 75 , 75 - 100 , 100 - 125 , 125 - 150 , 150 - 175 , 175 - 200 , 200 - 225 , 225 - 250 , 250 - 275 , 275 - 300 , 300 - 325 , 325 - 350 , 350 - 375 , 375 - 400 , 400 - 425 , 425 - 450 , 450 - 475 , 475 - 500 , 500 - 525 , 525 - 550 , 550 - 575 , 575 - 600 , 600 - 625 , 625 - 650 , 650 - 675 , 675 - 700 , 700 - 725 , 725 - 750 , 750 - 775 , 775 - 800 , 800 - 825 , 825 - 850 , 850 - 875 , 875 - 900 , 900 - 925 , 925 - 950 , 950 - 975 , 975 - 1000 , 1000 - 1025 , 1025 - 1050 , 1050 - 1075 , 1075 - 1100 , 1100 - 1125 , 1125 - 1150 , 1150 - 1175 , 1175 - 1200 , 1200 - 1225 , 1225 - 1250 , 1250 - 1275 , 1275 - 1300 , 1300 - 1325 , 1325 - 1350 , 1350 - 1375 , 1375 - 1400 , 1400 - 1425 , 1425 - 1450 , 1450 - 1475 , 1475 - 1500 , 1500 - 1525 , 1525 - 1550 , 1550 - 1575 , 1575 - 1600 | ||
 | Click To Change The Sort Order: By Market Cap or Company Size Performance: Year-to-date, Week and Day |  |
| Too many stocks? View smallcap stocks filtered by marketcap & sector |
| Marketcap: All SmallCap Stocks (default-no microcap), Large, Mid-Range, Small |
| Smallcap Sector: Tech, Finance, Energy, Staples, Retail, Industrial, Materials, & Medical |
|
Get the most comprehensive stock market coverage daily at 12Stocks.com ➞ Best Stocks Today ➞ Best Stocks Weekly ➞ Best Stocks Year-to-Date ➞ Best Stocks Trends ➞  Best Stocks Today 12Stocks.com Best Nasdaq Stocks ➞ Best S&P 500 Stocks ➞ Best Tech Stocks ➞ Best Biotech Stocks ➞ |
| Detailed Overview of SmallCap Stocks |
| SmallCap Technical Overview, Leaders & Laggards, Top SmallCap ETF Funds & Detailed SmallCap Stocks List, Charts, Trends & More |
| Smallcap: Technical Analysis, Trends & YTD Performance | |
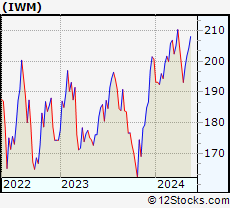
| SmallCap segment as represented by
IWM, an exchange-traded fund [ETF], holds basket of thousands of smallcap stocks from across all major sectors of the US stock market. The smallcap index (contains stocks like Riverbed & Sotheby's) is down by -3.39% and is currently underperforming the overall market by -7.31% year-to-date. Below is a quick view of technical charts and trends: | |
 IWM Weekly Chart |
|
| Long Term Trend: Good | |
| Medium Term Trend: Not Good | |
 IWM Daily Chart |
|
| Short Term Trend: Very Good | |
| Overall Trend Score: 58 | |
| YTD Performance: -3.39% | |
| **Trend Scores & Views Are Only For Educational Purposes And Not For Investing | |
| 12Stocks.com: Top Performing Small Cap Index Stocks | ||||||||||||||||||||||||||||||||||||||||||||||||
 The top performing Small Cap Index stocks year to date are
Now, more recently, over last week, the top performing Small Cap Index stocks on the move are


|
||||||||||||||||||||||||||||||||||||||||||||||||
| 12Stocks.com: Investing in Smallcap Index using Exchange Traded Funds | |
|
The following table shows list of key exchange traded funds (ETF) that
help investors track Smallcap index. The following list also includes leveraged ETF funds that track twice or thrice the daily returns of Smallcap indices. Short or inverse ETF funds move in the opposite direction to the index they track and are useful during market pullbacks or during bear markets. Quick View: Move mouse or cursor over ETF symbol (ticker) to view short-term technical chart and over ETF name to view long term chart. Click on ticker or stock name for detailed view. Click on to add stock symbol to your watchlist and to view watchlist. |
12Stocks.com List of ETFs that track Smallcap Index
| Ticker | ETF Name | Watchlist | Recent Price | Smart Investing & Trading Score | Change % | Week % | Year-to-date % |
| IWM | iShares Russell 2000 | | 193.91 | 58 | -1.91 | 0.4 | -3.39% |
| SBB | ProShares Short SmallCap600 | | 16.60 | 33 | 1.41 | -1.43 | 4.21% |
| SDD | ProShares UltraShort SmallCap600 | | 19.79 | 42 | 1.51 | -2.73 | 7.37% |
| SMLV | SPDR SSGA US Small Cap Low Volatil ETF | | 107.56 | 73 | -0.80 | 1.39 | -4.41% |
| SAA | ProShares Ultra SmallCap600 | | 23.01 | 58 | 0.00 | 5.55 | -7.78% |
| 12Stocks.com: Charts, Trends, Fundamental Data and Performances of SmallCap Stocks | |
|
We now take in-depth look at all SmallCap stocks including charts, multi-period performances and overall trends (as measured by Smart Investing & Trading Score). One can sort SmallCap stocks (click link to choose) by Daily, Weekly and by Year-to-Date performances. Also, one can sort by size of the company or by market capitalization. |
| Select Your Default Chart Type: | |||||
| |||||
| Click on stock symbol or name for detailed view. Click on to add stock symbol to your watchlist and to view watchlist. Quick View: Move mouse or cursor over "Daily" to quickly view daily technical stock chart and over "Weekly" to view weekly technical stock chart. | |||||

 | RNST Renasant Corporation |
| Sector: Financials | |
| SubSector: Money Center Banks | |
| MarketCap: 1279.39 Millions | |
| Recent Price: 29.45 Smart Investing & Trading Score: 67 | |
| Day Percent Change: -3.95% Day Change: -1.21 | |
| Week Change: -1.17% Year-to-date Change: -12.6% | |
| RNST Links: Profile News Message Board | |
| Charts:- Daily , Weekly | |
| Add RNST to Watchlist: View: Get Complete RNST Trend Analysis ➞ | |
 | WSBC WesBanco, Inc. |
| Sector: Financials | |
| SubSector: Regional - Mid-Atlantic Banks | |
| MarketCap: 1575.79 Millions | |
| Recent Price: 27.43 Smart Investing & Trading Score: 47 | |
| Day Percent Change: -3.01% Day Change: -0.85 | |
| Week Change: -3.21% Year-to-date Change: -12.6% | |
| WSBC Links: Profile News Message Board | |
| Charts:- Daily , Weekly | |
| Add WSBC to Watchlist: View: Get Complete WSBC Trend Analysis ➞ | |
 | SBSI Southside Bancshares, Inc. |
| Sector: Financials | |
| SubSector: Regional - Mid-Atlantic Banks | |
| MarketCap: 971.259 Millions | |
| Recent Price: 27.37 Smart Investing & Trading Score: 52 | |
| Day Percent Change: -3.56% Day Change: -1.01 | |
| Week Change: -2.87% Year-to-date Change: -12.6% | |
| SBSI Links: Profile News Message Board | |
| Charts:- Daily , Weekly | |
| Add SBSI to Watchlist: View: Get Complete SBSI Trend Analysis ➞ | |
 | BHB Bar Harbor Bankshares |
| Sector: Financials | |
| SubSector: Regional - Northeast Banks | |
| MarketCap: 298.099 Millions | |
| Recent Price: 25.66 Smart Investing & Trading Score: 60 | |
| Day Percent Change: -0.37% Day Change: -0.09 | |
| Week Change: 0.69% Year-to-date Change: -12.6% | |
| BHB Links: Profile News Message Board | |
| Charts:- Daily , Weekly | |
| Add BHB to Watchlist: View: Get Complete BHB Trend Analysis ➞ | |
 | AMBC Ambac Financial Group, Inc. |
| Sector: Financials | |
| SubSector: Surety & Title Insurance | |
| MarketCap: 587.818 Millions | |
| Recent Price: 14.40 Smart Investing & Trading Score: 25 | |
| Day Percent Change: -0.96% Day Change: -0.14 | |
| Week Change: 0% Year-to-date Change: -12.6% | |
| AMBC Links: Profile News Message Board | |
| Charts:- Daily , Weekly | |
| Add AMBC to Watchlist: View: Get Complete AMBC Trend Analysis ➞ | |
 | VBTX Veritex Holdings, Inc. |
| Sector: Financials | |
| SubSector: Regional - Southwest Banks | |
| MarketCap: 625.165 Millions | |
| Recent Price: 20.33 Smart Investing & Trading Score: 69 | |
| Day Percent Change: -2.21% Day Change: -0.46 | |
| Week Change: 1.55% Year-to-date Change: -12.6% | |
| VBTX Links: Profile News Message Board | |
| Charts:- Daily , Weekly | |
| Add VBTX to Watchlist: View: Get Complete VBTX Trend Analysis ➞ | |
 | ASIX AdvanSix Inc. |
| Sector: Materials | |
| SubSector: Chemicals - Major Diversified | |
| MarketCap: 394.136 Millions | |
| Recent Price: 26.16 Smart Investing & Trading Score: 36 | |
| Day Percent Change: -1.80% Day Change: -0.48 | |
| Week Change: -3.54% Year-to-date Change: -12.7% | |
| ASIX Links: Profile News Message Board | |
| Charts:- Daily , Weekly | |
| Add ASIX to Watchlist: View: Get Complete ASIX Trend Analysis ➞ | |
 | ANAB AnaptysBio, Inc. |
| Sector: Health Care | |
| SubSector: Biotechnology | |
| MarketCap: 405.985 Millions | |
| Recent Price: 18.70 Smart Investing & Trading Score: 0 | |
| Day Percent Change: -2.96% Day Change: -0.57 | |
| Week Change: -5.89% Year-to-date Change: -12.7% | |
| ANAB Links: Profile News Message Board | |
| Charts:- Daily , Weekly | |
| Add ANAB to Watchlist: View: Get Complete ANAB Trend Analysis ➞ | |
 | PRO PROS Holdings, Inc. |
| Sector: Technology | |
| SubSector: Application Software | |
| MarketCap: 1357.42 Millions | |
| Recent Price: 33.86 Smart Investing & Trading Score: 32 | |
| Day Percent Change: -2.20% Day Change: -0.76 | |
| Week Change: 1.74% Year-to-date Change: -12.7% | |
| PRO Links: Profile News Message Board | |
| Charts:- Daily , Weekly | |
| Add PRO to Watchlist: View: Get Complete PRO Trend Analysis ➞ | |
 | DEA Easterly Government Properties, Inc. |
| Sector: Financials | |
| SubSector: REIT - Office | |
| MarketCap: 1832.56 Millions | |
| Recent Price: 11.73 Smart Investing & Trading Score: 67 | |
| Day Percent Change: -1.22% Day Change: -0.14 | |
| Week Change: 1.16% Year-to-date Change: -12.8% | |
| DEA Links: Profile News Message Board | |
| Charts:- Daily , Weekly | |
| Add DEA to Watchlist: View: Get Complete DEA Trend Analysis ➞ | |
 | FTDR frontdoor, inc. |
| Sector: Services & Goods | |
| SubSector: Business Services | |
| MarketCap: 2974.22 Millions | |
| Recent Price: 30.72 Smart Investing & Trading Score: 37 | |
| Day Percent Change: -0.65% Day Change: -0.20 | |
| Week Change: 0.74% Year-to-date Change: -12.8% | |
| FTDR Links: Profile News Message Board | |
| Charts:- Daily , Weekly | |
| Add FTDR to Watchlist: View: Get Complete FTDR Trend Analysis ➞ | |
 | THS TreeHouse Foods, Inc. |
| Sector: Consumer Staples | |
| SubSector: Processed & Packaged Goods | |
| MarketCap: 2392.08 Millions | |
| Recent Price: 36.13 Smart Investing & Trading Score: 37 | |
| Day Percent Change: -1.67% Day Change: -0.62 | |
| Week Change: -1.65% Year-to-date Change: -12.8% | |
| THS Links: Profile News Message Board | |
| Charts:- Daily , Weekly | |
| Add THS to Watchlist: View: Get Complete THS Trend Analysis ➞ | |
 | DCPH Deciphera Pharmaceuticals, Inc. |
| Sector: Health Care | |
| SubSector: Biotechnology | |
| MarketCap: 2329.95 Millions | |
| Recent Price: 14.06 Smart Investing & Trading Score: 48 | |
| Day Percent Change: -3.83% Day Change: -0.56 | |
| Week Change: -4.29% Year-to-date Change: -12.8% | |
| DCPH Links: Profile News Message Board | |
| Charts:- Daily , Weekly | |
| Add DCPH to Watchlist: View: Get Complete DCPH Trend Analysis ➞ | |
 | SPSC SPS Commerce, Inc. |
| Sector: Technology | |
| SubSector: Application Software | |
| MarketCap: 1398.02 Millions | |
| Recent Price: 168.94 Smart Investing & Trading Score: 49 | |
| Day Percent Change: -1.28% Day Change: -2.19 | |
| Week Change: 2.08% Year-to-date Change: -12.9% | |
| SPSC Links: Profile News Message Board | |
| Charts:- Daily , Weekly | |
| Add SPSC to Watchlist: View: Get Complete SPSC Trend Analysis ➞ | |
 | ALKS Alkermes plc |
| Sector: Health Care | |
| SubSector: Biotechnology | |
| MarketCap: 2311.95 Millions | |
| Recent Price: 24.16 Smart Investing & Trading Score: 49 | |
| Day Percent Change: -1.99% Day Change: -0.49 | |
| Week Change: 1.3% Year-to-date Change: -12.9% | |
| ALKS Links: Profile News Message Board | |
| Charts:- Daily , Weekly | |
| Add ALKS to Watchlist: View: Get Complete ALKS Trend Analysis ➞ | |
 | BOOM DMC Global Inc. |
| Sector: Industrials | |
| SubSector: Metal Fabrication | |
| MarketCap: 359.15 Millions | |
| Recent Price: 16.39 Smart Investing & Trading Score: 30 | |
| Day Percent Change: -1.80% Day Change: -0.30 | |
| Week Change: -3.7% Year-to-date Change: -12.9% | |
| BOOM Links: Profile News Message Board | |
| Charts:- Daily , Weekly | |
| Add BOOM to Watchlist: View: Get Complete BOOM Trend Analysis ➞ | |
 | IPAR Inter Parfums, Inc. |
| Sector: Consumer Staples | |
| SubSector: Personal Products | |
| MarketCap: 1302.55 Millions | |
| Recent Price: 125.34 Smart Investing & Trading Score: 42 | |
| Day Percent Change: -3.97% Day Change: -5.18 | |
| Week Change: -1.99% Year-to-date Change: -13.0% | |
| IPAR Links: Profile News Message Board | |
| Charts:- Daily , Weekly | |
| Add IPAR to Watchlist: View: Get Complete IPAR Trend Analysis ➞ | |
 | SFNC Simmons First National Corporation |
| Sector: Financials | |
| SubSector: Money Center Banks | |
| MarketCap: 2125.49 Millions | |
| Recent Price: 17.25 Smart Investing & Trading Score: 17 | |
| Day Percent Change: -5.35% Day Change: -0.98 | |
| Week Change: -6.22% Year-to-date Change: -13.0% | |
| SFNC Links: Profile News Message Board | |
| Charts:- Daily , Weekly | |
| Add SFNC to Watchlist: View: Get Complete SFNC Trend Analysis ➞ | |
 | UCBI United Community Banks, Inc. |
| Sector: Financials | |
| SubSector: Regional - Mid-Atlantic Banks | |
| MarketCap: 1593.99 Millions | |
| Recent Price: 25.44 Smart Investing & Trading Score: 74 | |
| Day Percent Change: -3.38% Day Change: -0.89 | |
| Week Change: 0.75% Year-to-date Change: -13.1% | |
| UCBI Links: Profile News Message Board | |
| Charts:- Daily , Weekly | |
| Add UCBI to Watchlist: View: Get Complete UCBI Trend Analysis ➞ | |
 | XNCR Xencor, Inc. |
| Sector: Health Care | |
| SubSector: Biotechnology | |
| MarketCap: 1744.35 Millions | |
| Recent Price: 18.44 Smart Investing & Trading Score: 17 | |
| Day Percent Change: -3.05% Day Change: -0.58 | |
| Week Change: 0.33% Year-to-date Change: -13.1% | |
| XNCR Links: Profile News Message Board | |
| Charts:- Daily , Weekly | |
| Add XNCR to Watchlist: View: Get Complete XNCR Trend Analysis ➞ | |
 | NMRK Newmark Group, Inc. |
| Sector: Financials | |
| SubSector: Property Management | |
| MarketCap: 767.542 Millions | |
| Recent Price: 9.52 Smart Investing & Trading Score: 10 | |
| Day Percent Change: -2.36% Day Change: -0.23 | |
| Week Change: -0.73% Year-to-date Change: -13.1% | |
| NMRK Links: Profile News Message Board | |
| Charts:- Daily , Weekly | |
| Add NMRK to Watchlist: View: Get Complete NMRK Trend Analysis ➞ | |
 | AWR American States Water Company |
| Sector: Utilities | |
| SubSector: Water Utilities | |
| MarketCap: 3519.12 Millions | |
| Recent Price: 69.84 Smart Investing & Trading Score: 74 | |
| Day Percent Change: -1.30% Day Change: -0.92 | |
| Week Change: 0.85% Year-to-date Change: -13.2% | |
| AWR Links: Profile News Message Board | |
| Charts:- Daily , Weekly | |
| Add AWR to Watchlist: View: Get Complete AWR Trend Analysis ➞ | |
 | PLAB Photronics, Inc. |
| Sector: Technology | |
| SubSector: Semiconductor Equipment & Materials | |
| MarketCap: 709.018 Millions | |
| Recent Price: 27.24 Smart Investing & Trading Score: 42 | |
| Day Percent Change: -0.98% Day Change: -0.27 | |
| Week Change: 7.58% Year-to-date Change: -13.2% | |
| PLAB Links: Profile News Message Board | |
| Charts:- Daily , Weekly | |
| Add PLAB to Watchlist: View: Get Complete PLAB Trend Analysis ➞ | |
 | SEMR Semrush Holdings, Inc. |
| Sector: Technology | |
| SubSector: Software - Application | |
| MarketCap: 1330 Millions | |
| Recent Price: 12.06 Smart Investing & Trading Score: 73 | |
| Day Percent Change: -1.71% Day Change: -0.21 | |
| Week Change: 4.87% Year-to-date Change: -13.2% | |
| SEMR Links: Profile News Message Board | |
| Charts:- Daily , Weekly | |
| Add SEMR to Watchlist: View: Get Complete SEMR Trend Analysis ➞ | |
 | ROIC Retail Opportunity Investments Corp. |
| Sector: Financials | |
| SubSector: REIT - Retail | |
| MarketCap: 943.414 Millions | |
| Recent Price: 12.18 Smart Investing & Trading Score: 74 | |
| Day Percent Change: -1.77% Day Change: -0.22 | |
| Week Change: -0.81% Year-to-date Change: -13.2% | |
| ROIC Links: Profile News Message Board | |
| Charts:- Daily , Weekly | |
| Add ROIC to Watchlist: View: Get Complete ROIC Trend Analysis ➞ | |
| For tabular summary view of above stock list: Summary View ➞ 0 - 25 , 25 - 50 , 50 - 75 , 75 - 100 , 100 - 125 , 125 - 150 , 150 - 175 , 175 - 200 , 200 - 225 , 225 - 250 , 250 - 275 , 275 - 300 , 300 - 325 , 325 - 350 , 350 - 375 , 375 - 400 , 400 - 425 , 425 - 450 , 450 - 475 , 475 - 500 , 500 - 525 , 525 - 550 , 550 - 575 , 575 - 600 , 600 - 625 , 625 - 650 , 650 - 675 , 675 - 700 , 700 - 725 , 725 - 750 , 750 - 775 , 775 - 800 , 800 - 825 , 825 - 850 , 850 - 875 , 875 - 900 , 900 - 925 , 925 - 950 , 950 - 975 , 975 - 1000 , 1000 - 1025 , 1025 - 1050 , 1050 - 1075 , 1075 - 1100 , 1100 - 1125 , 1125 - 1150 , 1150 - 1175 , 1175 - 1200 , 1200 - 1225 , 1225 - 1250 , 1250 - 1275 , 1275 - 1300 , 1300 - 1325 , 1325 - 1350 , 1350 - 1375 , 1375 - 1400 , 1400 - 1425 , 1425 - 1450 , 1450 - 1475 , 1475 - 1500 , 1500 - 1525 , 1525 - 1550 , 1550 - 1575 , 1575 - 1600 | ||
| Click To Change The Sort Order: By Market Cap or Company Size Performance: Year-to-date, Week and Day | |
| Select Chart Type: | ||
| Too many stocks? View smallcap stocks filtered by marketcap & sector |
| Marketcap: All SmallCap Stocks (default-no microcap), Large, Mid-Range, Small & MicroCap |
| Sector: Tech, Finance, Energy, Staples, Retail, Industrial, Materials, Utilities & Medical |
|
Best Stocks Today 12Stocks.com |
© 2024 12Stocks.com Terms & Conditions Privacy Contact Us
All Information Provided Only For Education And Not To Be Used For Investing or Trading. See Terms & Conditions


One More Thing ... Get Best Stocks Delivered Daily!
Never Ever Miss A Move With Our Top Ten Stocks Lists
Find Best Stocks In Any Market - Bull or Bear Market
Take A Peek At Our Top Ten Stocks Lists: Daily, Weekly, Year-to-Date & Top Trends
Find Best Stocks In Any Market - Bull or Bear Market
Take A Peek At Our Top Ten Stocks Lists: Daily, Weekly, Year-to-Date & Top Trends
Smallcap Stocks With Best Up Trends [0-bearish to 100-bullish]: Ribbon [100], Trustmark [100], Diodes [100], NextNav [100], LCNB [100], Matterport [100], Reservoir Media[100], Vishay Inter[100], Northwest Natural[100], Mueller Industries[100], Hibbett Sports[100]
Best Smallcap Stocks Year-to-Date:
CareMax [572.16%], Janux [332.95%], Alpine Immune[239.08%], Longboard [210.15%], Super Micro[163.77%], Arcutis Bio[163.47%], Avidity Biosciences[161.17%], Vera [147.64%], Hippo [121.73%], Y-mAbs [119.35%], Stoke [111.69%] Best Smallcap Stocks This Week:
Matterport [166.09%], B. Riley[42.62%], OptiNose [36.3%], Seres [34.31%], Ribbon [32.95%], CareMax [26.85%], ProKidney [24.02%], Riot Blockchain[23.22%], Hibbett Sports[20.96%], Impinj [19.61%], Cullinan Oncology[16.54%] Best Smallcap Stocks Daily:
OptiNose [31.85%], Impinj [15.06%], Strategic Education[10.26%], Sleep Number[8.77%], Zura Bio[8.59%], Core [8.17%], Community Health[7.10%], Sonic Automotive[6.73%], Direxion Daily[5.82%], Red Robin[5.54%], Ribbon [5.54%]