
 Login Sign Up


| |||||
 |  | ||||

| 12Stocks.com Market Intelligence |
Best SmallCap Stocks
|
| In a hurry? Small Cap Stock Lists: Performance Trends Table, Stock Charts
Sort Small Cap stocks: Daily, Weekly, Year-to-Date, Market Cap & Trends. Filter Small Cap stocks list by sector: Show all, Tech, Finance, Energy, Staples, Retail, Industrial, Materials, Utilities and HealthCare Filter Small Cap stocks list by size: All Large Medium Small and MicroCap |
| 12Stocks.com Small Cap Stocks Performances & Trends Daily | |||||||||
|
|  The overall Smart Investing & Trading Score is 13 (0-bearish to 100-bullish) which puts Small Cap index in short term bearish trend. The Smart Investing & Trading Score from previous trading session is 26 and hence a deterioration of trend.
| ||||||||
Here are the Smart Investing & Trading Scores of the most requested small cap stocks at 12Stocks.com (click stock name for detailed review):
|


| 12Stocks.com: Investing in Smallcap Index with Stocks | |
|
The following table helps investors and traders sort through current performance and trends (as measured by Smart Investing & Trading Score) of various
stocks in the Smallcap Index. Quick View: Move mouse or cursor over stock symbol (ticker) to view short-term technical chart and over stock name to view long term chart. Click on  to add stock symbol to your watchlist and to add stock symbol to your watchlist and  to view watchlist. Click on any ticker or stock name for detailed market intelligence report for that stock. to view watchlist. Click on any ticker or stock name for detailed market intelligence report for that stock. |
12Stocks.com Performance of Stocks in Smallcap Index
| Ticker | Stock Name | Watchlist | Category | Recent Price | Smart Investing & Trading Score | Change % | YTD Change% |
| NSSC | Napco Security |   | Services & Goods | 39.01 | 51 | 0.41% | 13.90% |
| STRL | Sterling Construction | | Industrials | 100.11 | 43 | 0.42% | 13.85% |
| SNPO | Snap One | | Technology | 10.57 | 93 | 0.28% | 13.78% |
| TREE | LendingTree | | Financials | 34.47 | 38 | -1.09% | 13.69% |
| IMAX | IMAX | | Services & Goods | 17.07 | 100 | 1.19% | 13.65% |
| SANM | Sanmina | | Technology | 58.35 | 35 | 0.76% | 13.59% |
| ICHR | Ichor | | Technology | 38.20 | 31 | -2.77% | 13.59% |
| ULH | Universal Logistics | | Transports | 31.78 | 31 | -3.35% | 13.42% |
| ANIK | Anika | | Health Care | 25.69 | 83 | 0.71% | 13.37% |
| SEM | Select Medical | | Health Care | 26.63 | 36 | -2.42% | 13.32% |
| NODK | NI | | Financials | 14.70 | 68 | 0.00% | 13.16% |
| ALDX | Aldeyra | | Health Care | 3.97 | 63 | 2.58% | 13.11% |
| AVO | Mission Produce | | Consumer Staples | 11.43 | 68 | -0.26% | 12.94% |
| CAL | Caleres | | Consumer Staples | 34.70 | 43 | -1.20% | 12.92% |
| OSG | Overseas Shipholding | | Transports | 5.95 | 17 | -0.34% | 12.90% |
| IDYA | IDEAYA Biosciences | | Health Care | 40.17 | 0 | -2.43% | 12.90% |
| NX | Quanex Building | | Industrials | 34.50 | 26 | -2.73% | 12.86% |
| HP | Helmerich & Payne | | Energy | 40.85 | 43 | -0.85% | 12.78% |
| CMPR | Cimpress | | Services & Goods | 90.23 | 48 | 0.82% | 12.72% |
| MNKD | MannKind | | Health Care | 4.10 | 36 | 1.23% | 12.64% |
| ASC | Ardmore Shipping | | Transports | 15.86 | 25 | -0.31% | 12.56% |
| PSFE | Paysafe | | Technology | 14.52 | 10 | -0.95% | 12.56% |
| TROX | Tronox | | Materials | 15.92 | 36 | -1.00% | 12.43% |
| HEES | H&E Equipment | | Transports | 58.78 | 31 | -2.76% | 12.35% |
| ASTE | Astec Industries | | Industrials | 41.73 | 43 | -1.11% | 12.18% |


| Too many stocks? View smallcap stocks filtered by marketcap & sector |
| Marketcap: All SmallCap Stocks (default-no microcap), Large, Mid-Range, Small |
| Smallcap Sector: Tech, Finance, Energy, Staples, Retail, Industrial, Materials, & Medical |
|
Get the most comprehensive stock market coverage daily at 12Stocks.com ➞ Best Stocks Today ➞ Best Stocks Weekly ➞ Best Stocks Year-to-Date ➞ Best Stocks Trends ➞  Best Stocks Today 12Stocks.com Best Nasdaq Stocks ➞ Best S&P 500 Stocks ➞ Best Tech Stocks ➞ Best Biotech Stocks ➞ |
| Detailed Overview of SmallCap Stocks |
| SmallCap Technical Overview, Leaders & Laggards, Top SmallCap ETF Funds & Detailed SmallCap Stocks List, Charts, Trends & More |
| Smallcap: Technical Analysis, Trends & YTD Performance | |
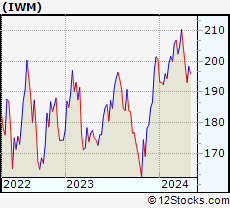
| SmallCap segment as represented by
IWM, an exchange-traded fund [ETF], holds basket of thousands of smallcap stocks from across all major sectors of the US stock market. The smallcap index (contains stocks like Riverbed & Sotheby's) is down by -3.84% and is currently underperforming the overall market by -8.25% year-to-date. Below is a quick view of technical charts and trends: | |
 IWM Weekly Chart |
|
| Long Term Trend: Good | |
| Medium Term Trend: Not Good | |
 IWM Daily Chart |
|
| Short Term Trend: Not Good | |
| Overall Trend Score: 13 | |
| YTD Performance: -3.84% | |
| **Trend Scores & Views Are Only For Educational Purposes And Not For Investing | |
| 12Stocks.com: Top Performing Small Cap Index Stocks | ||||||||||||||||||||||||||||||||||||||||||||||||
 The top performing Small Cap Index stocks year to date are
Now, more recently, over last week, the top performing Small Cap Index stocks on the move are


|
||||||||||||||||||||||||||||||||||||||||||||||||
| 12Stocks.com: Investing in Smallcap Index using Exchange Traded Funds | |
|
The following table shows list of key exchange traded funds (ETF) that
help investors track Smallcap index. The following list also includes leveraged ETF funds that track twice or thrice the daily returns of Smallcap indices. Short or inverse ETF funds move in the opposite direction to the index they track and are useful during market pullbacks or during bear markets. Quick View: Move mouse or cursor over ETF symbol (ticker) to view short-term technical chart and over ETF name to view long term chart. Click on ticker or stock name for detailed view. Click on to add stock symbol to your watchlist and to view watchlist. |
12Stocks.com List of ETFs that track Smallcap Index
| Ticker | ETF Name | Watchlist | Recent Price | Smart Investing & Trading Score | Change % | Week % | Year-to-date % |
| IWM | iShares Russell 2000 | | 193.00 | 13 | -1.06 | -2.86 | -3.84% |
| IJR | iShares Core S&P Small-Cap | | 102.13 | 17 | -0.58 | -2.28 | -5.65% |
| VTWO | Vanguard Russell 2000 ETF | | 78.05 | 36 | -1.04 | -2.83 | -3.76% |
| IWN | iShares Russell 2000 Value | | 146.03 | 23 | -0.77 | -2.89 | -5.99% |
| IWO | iShares Russell 2000 Growth | | 248.02 | 36 | -0.90 | -2.87 | -1.67% |
| IJS | iShares S&P Small-Cap 600 Value | | 94.12 | 17 | -0.57 | -2.13 | -8.68% |
| IJT | iShares S&P Small-Cap 600 Growth | | 121.84 | 41 | -1.02 | -2.36 | -2.64% |
| XSLV | PowerShares S&P SmallCap Low Volatil ETF | | 41.42 | 10 | -0.38 | -1.59 | -6.18% |
| SAA | ProShares Ultra SmallCap600 | | 21.66 | 0 | -1.19 | -3.99 | -13.19% |
| SMLV | SPDR SSGA US Small Cap Low Volatil ETF | | 103.66 | 10 | -0.17 | -1.29 | -7.87% |
| SBB | ProShares Short SmallCap600 | | 16.85 | 93 | 0.42 | 1.83 | 5.78% |
| SDD | ProShares UltraShort SmallCap600 | | 20.60 | 93 | 1.23 | 3.88 | 11.8% |
| 12Stocks.com: Charts, Trends, Fundamental Data and Performances of SmallCap Stocks | |
|
We now take in-depth look at all SmallCap stocks including charts, multi-period performances and overall trends (as measured by Smart Investing & Trading Score). One can sort SmallCap stocks (click link to choose) by Daily, Weekly and by Year-to-Date performances. Also, one can sort by size of the company or by market capitalization. |
| Select Your Default Chart Type: | |||||
| |||||
| Click on stock symbol or name for detailed view. Click on to add stock symbol to your watchlist and to view watchlist. Quick View: Move mouse or cursor over "Daily" to quickly view daily technical stock chart and over "Weekly" to view weekly technical stock chart. | |||||

 | NSSC Napco Security Technologies, Inc. |
| Sector: Services & Goods | |
| SubSector: Security & Protection Services | |
| MarketCap: 339.103 Millions | |
| Recent Price: 39.01 Smart Investing & Trading Score: 51 | |
| Day Percent Change: 0.41% Day Change: 0.16 | |
| Week Change: 0.62% Year-to-date Change: 13.9% | |
| NSSC Links: Profile News Message Board | |
| Charts:- Daily , Weekly | |
| Add NSSC to Watchlist: View: Get Complete NSSC Trend Analysis ➞ | |
 | STRL Sterling Construction Company, Inc. |
| Sector: Industrials | |
| SubSector: Heavy Construction | |
| MarketCap: 237.395 Millions | |
| Recent Price: 100.11 Smart Investing & Trading Score: 43 | |
| Day Percent Change: 0.42% Day Change: 0.42 | |
| Week Change: -4.56% Year-to-date Change: 13.9% | |
| STRL Links: Profile News Message Board | |
| Charts:- Daily , Weekly | |
| Add STRL to Watchlist: View: Get Complete STRL Trend Analysis ➞ | |
 | SNPO Snap One Holdings Corp. |
| Sector: Technology | |
| SubSector: Electronics & Computer Distribution | |
| MarketCap: 807 Millions | |
| Recent Price: 10.57 Smart Investing & Trading Score: 93 | |
| Day Percent Change: 0.28% Day Change: 0.03 | |
| Week Change: 29.85% Year-to-date Change: 13.8% | |
| SNPO Links: Profile News Message Board | |
| Charts:- Daily , Weekly | |
| Add SNPO to Watchlist: View: Get Complete SNPO Trend Analysis ➞ | |
 | TREE LendingTree, Inc. |
| Sector: Financials | |
| SubSector: Mortgage Investment | |
| MarketCap: 2745.99 Millions | |
| Recent Price: 34.47 Smart Investing & Trading Score: 38 | |
| Day Percent Change: -1.09% Day Change: -0.38 | |
| Week Change: -8.4% Year-to-date Change: 13.7% | |
| TREE Links: Profile News Message Board | |
| Charts:- Daily , Weekly | |
| Add TREE to Watchlist: View: Get Complete TREE Trend Analysis ➞ | |
 | IMAX IMAX Corporation |
| Sector: Services & Goods | |
| SubSector: Entertainment - Diversified | |
| MarketCap: 874.237 Millions | |
| Recent Price: 17.07 Smart Investing & Trading Score: 100 | |
| Day Percent Change: 1.19% Day Change: 0.20 | |
| Week Change: 3.9% Year-to-date Change: 13.7% | |
| IMAX Links: Profile News Message Board | |
| Charts:- Daily , Weekly | |
| Add IMAX to Watchlist: View: Get Complete IMAX Trend Analysis ➞ | |
 | SANM Sanmina Corporation |
| Sector: Technology | |
| SubSector: Diversified Electronics | |
| MarketCap: 1790.36 Millions | |
| Recent Price: 58.35 Smart Investing & Trading Score: 35 | |
| Day Percent Change: 0.76% Day Change: 0.44 | |
| Week Change: 0.29% Year-to-date Change: 13.6% | |
| SANM Links: Profile News Message Board | |
| Charts:- Daily , Weekly | |
| Add SANM to Watchlist: View: Get Complete SANM Trend Analysis ➞ | |
 | ICHR Ichor Holdings, Ltd. |
| Sector: Technology | |
| SubSector: Semiconductor Equipment & Materials | |
| MarketCap: 409.018 Millions | |
| Recent Price: 38.20 Smart Investing & Trading Score: 31 | |
| Day Percent Change: -2.77% Day Change: -1.09 | |
| Week Change: -1.8% Year-to-date Change: 13.6% | |
| ICHR Links: Profile News Message Board | |
| Charts:- Daily , Weekly | |
| Add ICHR to Watchlist: View: Get Complete ICHR Trend Analysis ➞ | |
 | ULH Universal Logistics Holdings, Inc. |
| Sector: Transports | |
| SubSector: Trucking | |
| MarketCap: 354.915 Millions | |
| Recent Price: 31.78 Smart Investing & Trading Score: 31 | |
| Day Percent Change: -3.35% Day Change: -1.10 | |
| Week Change: -3.99% Year-to-date Change: 13.4% | |
| ULH Links: Profile News Message Board | |
| Charts:- Daily , Weekly | |
| Add ULH to Watchlist: View: Get Complete ULH Trend Analysis ➞ | |
 | ANIK Anika Therapeutics, Inc. |
| Sector: Health Care | |
| SubSector: Biotechnology | |
| MarketCap: 438.385 Millions | |
| Recent Price: 25.69 Smart Investing & Trading Score: 83 | |
| Day Percent Change: 0.71% Day Change: 0.18 | |
| Week Change: 2.76% Year-to-date Change: 13.4% | |
| ANIK Links: Profile News Message Board | |
| Charts:- Daily , Weekly | |
| Add ANIK to Watchlist: View: Get Complete ANIK Trend Analysis ➞ | |
 | SEM Select Medical Holdings Corporation |
| Sector: Health Care | |
| SubSector: Hospitals | |
| MarketCap: 1765.96 Millions | |
| Recent Price: 26.63 Smart Investing & Trading Score: 36 | |
| Day Percent Change: -2.42% Day Change: -0.66 | |
| Week Change: -5.1% Year-to-date Change: 13.3% | |
| SEM Links: Profile News Message Board | |
| Charts:- Daily , Weekly | |
| Add SEM to Watchlist: View: Get Complete SEM Trend Analysis ➞ | |
 | NODK NI Holdings, Inc. |
| Sector: Financials | |
| SubSector: Property & Casualty Insurance | |
| MarketCap: 238.112 Millions | |
| Recent Price: 14.70 Smart Investing & Trading Score: 68 | |
| Day Percent Change: 0.00% Day Change: 0.00 | |
| Week Change: -0.41% Year-to-date Change: 13.2% | |
| NODK Links: Profile News Message Board | |
| Charts:- Daily , Weekly | |
| Add NODK to Watchlist: View: Get Complete NODK Trend Analysis ➞ | |
 | ALDX Aldeyra Therapeutics, Inc. |
| Sector: Health Care | |
| SubSector: Biotechnology | |
| MarketCap: 61.2785 Millions | |
| Recent Price: 3.97 Smart Investing & Trading Score: 63 | |
| Day Percent Change: 2.58% Day Change: 0.10 | |
| Week Change: -6.59% Year-to-date Change: 13.1% | |
| ALDX Links: Profile News Message Board | |
| Charts:- Daily , Weekly | |
| Add ALDX to Watchlist: View: Get Complete ALDX Trend Analysis ➞ | |
 | AVO Mission Produce, Inc. |
| Sector: Consumer Staples | |
| SubSector: Farm Products | |
| MarketCap: 91347 Millions | |
| Recent Price: 11.43 Smart Investing & Trading Score: 68 | |
| Day Percent Change: -0.26% Day Change: -0.03 | |
| Week Change: 0.88% Year-to-date Change: 12.9% | |
| AVO Links: Profile News Message Board | |
| Charts:- Daily , Weekly | |
| Add AVO to Watchlist: View: Get Complete AVO Trend Analysis ➞ | |
 | CAL Caleres, Inc. |
| Sector: Consumer Staples | |
| SubSector: Textile - Apparel Footwear & Accessories | |
| MarketCap: 224.07 Millions | |
| Recent Price: 34.70 Smart Investing & Trading Score: 43 | |
| Day Percent Change: -1.20% Day Change: -0.42 | |
| Week Change: -2.06% Year-to-date Change: 12.9% | |
| CAL Links: Profile News Message Board | |
| Charts:- Daily , Weekly | |
| Add CAL to Watchlist: View: Get Complete CAL Trend Analysis ➞ | |
 | OSG Overseas Shipholding Group, Inc. |
| Sector: Transports | |
| SubSector: Shipping | |
| MarketCap: 184.814 Millions | |
| Recent Price: 5.95 Smart Investing & Trading Score: 17 | |
| Day Percent Change: -0.34% Day Change: -0.02 | |
| Week Change: -0.34% Year-to-date Change: 12.9% | |
| OSG Links: Profile News Message Board | |
| Charts:- Daily , Weekly | |
| Add OSG to Watchlist: View: Get Complete OSG Trend Analysis ➞ | |
 | IDYA IDEAYA Biosciences, Inc. |
| Sector: Health Care | |
| SubSector: Biotechnology | |
| MarketCap: 89.1785 Millions | |
| Recent Price: 40.17 Smart Investing & Trading Score: 0 | |
| Day Percent Change: -2.43% Day Change: -1.00 | |
| Week Change: -4.29% Year-to-date Change: 12.9% | |
| IDYA Links: Profile News Message Board | |
| Charts:- Daily , Weekly | |
| Add IDYA to Watchlist: View: Get Complete IDYA Trend Analysis ➞ | |
 | NX Quanex Building Products Corporation |
| Sector: Industrials | |
| SubSector: General Building Materials | |
| MarketCap: 315.453 Millions | |
| Recent Price: 34.50 Smart Investing & Trading Score: 26 | |
| Day Percent Change: -2.73% Day Change: -0.97 | |
| Week Change: -3.82% Year-to-date Change: 12.9% | |
| NX Links: Profile News Message Board | |
| Charts:- Daily , Weekly | |
| Add NX to Watchlist: View: Get Complete NX Trend Analysis ➞ | |
 | HP Helmerich & Payne, Inc. |
| Sector: Energy | |
| SubSector: Oil & Gas Drilling & Exploration | |
| MarketCap: 1796.39 Millions | |
| Recent Price: 40.85 Smart Investing & Trading Score: 43 | |
| Day Percent Change: -0.85% Day Change: -0.35 | |
| Week Change: -2.25% Year-to-date Change: 12.8% | |
| HP Links: Profile News Message Board | |
| Charts:- Daily , Weekly | |
| Add HP to Watchlist: View: Get Complete HP Trend Analysis ➞ | |
 | CMPR Cimpress plc |
| Sector: Services & Goods | |
| SubSector: Business Services | |
| MarketCap: 1675.02 Millions | |
| Recent Price: 90.23 Smart Investing & Trading Score: 48 | |
| Day Percent Change: 0.82% Day Change: 0.73 | |
| Week Change: -3.18% Year-to-date Change: 12.7% | |
| CMPR Links: Profile News Message Board | |
| Charts:- Daily , Weekly | |
| Add CMPR to Watchlist: View: Get Complete CMPR Trend Analysis ➞ | |
 | MNKD MannKind Corporation |
| Sector: Health Care | |
| SubSector: Biotechnology | |
| MarketCap: 250.885 Millions | |
| Recent Price: 4.10 Smart Investing & Trading Score: 36 | |
| Day Percent Change: 1.23% Day Change: 0.05 | |
| Week Change: -1.2% Year-to-date Change: 12.6% | |
| MNKD Links: Profile News Message Board | |
| Charts:- Daily , Weekly | |
| Add MNKD to Watchlist: View: Get Complete MNKD Trend Analysis ➞ | |
 | ASC Ardmore Shipping Corporation |
| Sector: Transports | |
| SubSector: Shipping | |
| MarketCap: 147.014 Millions | |
| Recent Price: 15.86 Smart Investing & Trading Score: 25 | |
| Day Percent Change: -0.31% Day Change: -0.05 | |
| Week Change: -0.13% Year-to-date Change: 12.6% | |
| ASC Links: Profile News Message Board | |
| Charts:- Daily , Weekly | |
| Add ASC to Watchlist: View: Get Complete ASC Trend Analysis ➞ | |
 | PSFE Paysafe Limited |
| Sector: Technology | |
| SubSector: Software - Infrastructure | |
| MarketCap: 605 Millions | |
| Recent Price: 14.52 Smart Investing & Trading Score: 10 | |
| Day Percent Change: -0.95% Day Change: -0.14 | |
| Week Change: -6.08% Year-to-date Change: 12.6% | |
| PSFE Links: Profile News Message Board | |
| Charts:- Daily , Weekly | |
| Add PSFE to Watchlist: View: Get Complete PSFE Trend Analysis ➞ | |
 | TROX Tronox Holdings plc |
| Sector: Materials | |
| SubSector: Chemicals - Major Diversified | |
| MarketCap: 807 Millions | |
| Recent Price: 15.92 Smart Investing & Trading Score: 36 | |
| Day Percent Change: -1.00% Day Change: -0.16 | |
| Week Change: -2.33% Year-to-date Change: 12.4% | |
| TROX Links: Profile News Message Board | |
| Charts:- Daily , Weekly | |
| Add TROX to Watchlist: View: Get Complete TROX Trend Analysis ➞ | |
 | HEES H&E Equipment Services, Inc. |
| Sector: Transports | |
| SubSector: Rental & Leasing Services | |
| MarketCap: 451.944 Millions | |
| Recent Price: 58.78 Smart Investing & Trading Score: 31 | |
| Day Percent Change: -2.76% Day Change: -1.67 | |
| Week Change: -5.18% Year-to-date Change: 12.4% | |
| HEES Links: Profile News Message Board | |
| Charts:- Daily , Weekly | |
| Add HEES to Watchlist: View: Get Complete HEES Trend Analysis ➞ | |
 | ASTE Astec Industries, Inc. |
| Sector: Industrials | |
| SubSector: Farm & Construction Machinery | |
| MarketCap: 731.607 Millions | |
| Recent Price: 41.73 Smart Investing & Trading Score: 43 | |
| Day Percent Change: -1.11% Day Change: -0.47 | |
| Week Change: -1.79% Year-to-date Change: 12.2% | |
| ASTE Links: Profile News Message Board | |
| Charts:- Daily , Weekly | |
| Add ASTE to Watchlist: View: Get Complete ASTE Trend Analysis ➞ | |
| Too many stocks? View smallcap stocks filtered by marketcap & sector |
| Marketcap: All SmallCap Stocks (default-no microcap), Large, Mid-Range, Small & MicroCap |
| Sector: Tech, Finance, Energy, Staples, Retail, Industrial, Materials, Utilities & Medical |
|
Best Stocks Today 12Stocks.com |
© 2024 12Stocks.com Terms & Conditions Privacy Contact Us
All Information Provided Only For Education And Not To Be Used For Investing or Trading. See Terms & Conditions


One More Thing ... Get Best Stocks Delivered Daily!
Never Ever Miss A Move With Our Top Ten Stocks Lists
Find Best Stocks In Any Market - Bull or Bear Market
Take A Peek At Our Top Ten Stocks Lists: Daily, Weekly, Year-to-Date & Top Trends
Find Best Stocks In Any Market - Bull or Bear Market
Take A Peek At Our Top Ten Stocks Lists: Daily, Weekly, Year-to-Date & Top Trends
Smallcap Stocks With Best Up Trends [0-bearish to 100-bullish]: Vanda [100], Zuora [100], ALX Oncology[100], ProKidney [100], IMAX [100], Envestnet [100], Intra-Cellular Therapies[100], Dorian LPG[95], Victory Capital[95], Oscar Health[95], Reneo [93]
Best Smallcap Stocks Year-to-Date:
Agenus [552.25%], CareMax [416.49%], Janux [346.07%], Viking [257.17%], Alpine Immune[238.55%], Super Micro[237.75%], Arcutis Bio[217.34%], Longboard [177.91%], Avidity Biosciences[160.56%], Vera [158.46%], Stoke [122.81%] Best Smallcap Stocks This Week:
ProKidney [61.71%], Macatawa Bank[42.75%], Snap One[29.85%], Vanda [27.18%], ALX Oncology[23.41%], Intra-Cellular Therapies[16.41%], Escalade [13.71%], Karyopharm [13.11%], Encore Wire[10.06%], Zuora [10%], Direxion Daily[8.81%] Best Smallcap Stocks Daily:
Vanda [29.38%], Karyopharm [25.45%], Cutera [18.41%], Children s[16.46%], WW [14.10%], Lineage Cell[12.17%], Zuora [11.69%], ALX Oncology[10.97%], Marinus [10.77%], Acrivon [9.19%], Cue Biopharma[9.03%]