
 Login Sign Up


| |||||
 |  | ||||

| 12Stocks.com Market Intelligence |
Best SmallCap Stocks
|
| In a hurry? Small Cap Stock Lists: Performance Trends Table, Stock Charts
Sort Small Cap stocks: Daily, Weekly, Year-to-Date, Market Cap & Trends. Filter Small Cap stocks list by sector: Show all, Tech, Finance, Energy, Staples, Retail, Industrial, Materials, Utilities and HealthCare Filter Small Cap stocks list by size: All Large Medium Small and MicroCap |
| 12Stocks.com Small Cap Stocks Performances & Trends Daily | |||||||||
|
|  The overall Smart Investing & Trading Score is 23 (0-bearish to 100-bullish) which puts Small Cap index in short term bearish to neutral trend. The Smart Investing & Trading Score from previous trading session is 13 and an improvement of trend continues.
| ||||||||
Here are the Smart Investing & Trading Scores of the most requested small cap stocks at 12Stocks.com (click stock name for detailed review):
|


| 12Stocks.com: Investing in Smallcap Index with Stocks | |
|
The following table helps investors and traders sort through current performance and trends (as measured by Smart Investing & Trading Score) of various
stocks in the Smallcap Index. Quick View: Move mouse or cursor over stock symbol (ticker) to view short-term technical chart and over stock name to view long term chart. Click on  to add stock symbol to your watchlist and to add stock symbol to your watchlist and  to view watchlist. Click on any ticker or stock name for detailed market intelligence report for that stock. to view watchlist. Click on any ticker or stock name for detailed market intelligence report for that stock. |
12Stocks.com Performance of Stocks in Smallcap Index
| Ticker | Stock Name | Watchlist | Category | Recent Price | Smart Investing & Trading Score | Change % | YTD Change% |
| VSTO | Vista Outdoor |   | Consumer Staples | 32.36 | 61 | 0.59 | 9.44% |
| ASUR | Asure | | Technology | 6.99 | 10 | 0.58 | -26.58% |
| HCKT | Hackett Group | | Technology | 22.60 | 18 | 0.58 | -0.75% |
| ALLO | Allogene | | Health Care | 3.48 | 28 | 0.58 | 8.41% |
| OSUR | OraSure | | Health Care | 5.28 | 32 | 0.57 | -35.61% |
| HL | Hecla Mining | | Materials | 5.31 | 78 | 0.57 | 10.40% |
| DRH | DiamondRock Hospitality | | Financials | 8.83 | 10 | 0.57 | -5.96% |
| PCRX | Pacira BioSciences | | Health Care | 26.25 | 20 | 0.57 | -22.20% |
| OOMA | Ooma | | Technology | 7.06 | 17 | 0.57 | -34.20% |
| CAKE | Cheesecake Factory | | Services & Goods | 34.00 | 35 | 0.56 | -2.88% |
| PJT | PJT Partners | | Financials | 91.76 | 18 | 0.56 | -9.92% |
| DORM | Dorman Products | | Consumer Staples | 88.40 | 54 | 0.56 | 5.98% |
| CNK | Cinemark | | Services & Goods | 18.22 | 69 | 0.55 | 29.31% |
| AVIR | Atea | | Health Care | 3.72 | 40 | 0.54 | 21.97% |
| AESI | Atlas Energy | | Energy | 22.29 | 61 | 0.54 | 30.20% |
| NOVA | Sunnova Energy | | Services & Goods | 3.80 | 20 | 0.53 | -75.08% |
| CHUY | Chuy s | | Services & Goods | 30.59 | 10 | 0.53 | -19.98% |
| CSTM | Constellium SE | | Materials | 20.72 | 41 | 0.53 | 3.81% |
| MLP | Maui Land | | Financials | 19.37 | 25 | 0.52 | 21.90% |
| WLDN | Willdan Group | | Services & Goods | 26.85 | 61 | 0.52 | 24.88% |
| GES | Guess | | Services & Goods | 25.69 | 58 | 0.51 | 11.41% |
| ITCI | Intra-Cellular Therapies | | Health Care | 72.37 | 68 | 0.51 | 1.05% |
| IRT | Independence Realty | | Financials | 15.62 | 61 | 0.51 | 2.09% |
| MSGE | Madison Square | | Technology | 37.80 | 53 | 0.51 | 18.83% |
| KIND | Nextdoor | | Services & Goods | 1.98 | 63 | 0.51 | 7.03% |


| Too many stocks? View smallcap stocks filtered by marketcap & sector |
| Marketcap: All SmallCap Stocks (default-no microcap), Large, Mid-Range, Small |
| Smallcap Sector: Tech, Finance, Energy, Staples, Retail, Industrial, Materials, & Medical |
|
Get the most comprehensive stock market coverage daily at 12Stocks.com ➞ Best Stocks Today ➞ Best Stocks Weekly ➞ Best Stocks Year-to-Date ➞ Best Stocks Trends ➞  Best Stocks Today 12Stocks.com Best Nasdaq Stocks ➞ Best S&P 500 Stocks ➞ Best Tech Stocks ➞ Best Biotech Stocks ➞ |
| Detailed Overview of SmallCap Stocks |
| SmallCap Technical Overview, Leaders & Laggards, Top SmallCap ETF Funds & Detailed SmallCap Stocks List, Charts, Trends & More |
| Smallcap: Technical Analysis, Trends & YTD Performance | |
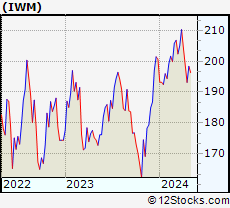
| SmallCap segment as represented by
IWM, an exchange-traded fund [ETF], holds basket of thousands of smallcap stocks from across all major sectors of the US stock market. The smallcap index (contains stocks like Riverbed & Sotheby's) is down by -3.77% and is currently underperforming the overall market by -7.15% year-to-date. Below is a quick view of technical charts and trends: | |
 IWM Weekly Chart |
|
| Long Term Trend: Good | |
| Medium Term Trend: Not Good | |
 IWM Daily Chart |
|
| Short Term Trend: Deteriorating | |
| Overall Trend Score: 23 | |
| YTD Performance: -3.77% | |
| **Trend Scores & Views Are Only For Educational Purposes And Not For Investing | |
| 12Stocks.com: Top Performing Small Cap Index Stocks | ||||||||||||||||||||||||||||||||||||||||||||||||
 The top performing Small Cap Index stocks year to date are
Now, more recently, over last week, the top performing Small Cap Index stocks on the move are


|
||||||||||||||||||||||||||||||||||||||||||||||||
| 12Stocks.com: Investing in Smallcap Index using Exchange Traded Funds | |
|
The following table shows list of key exchange traded funds (ETF) that
help investors track Smallcap index. The following list also includes leveraged ETF funds that track twice or thrice the daily returns of Smallcap indices. Short or inverse ETF funds move in the opposite direction to the index they track and are useful during market pullbacks or during bear markets. Quick View: Move mouse or cursor over ETF symbol (ticker) to view short-term technical chart and over ETF name to view long term chart. Click on ticker or stock name for detailed view. Click on to add stock symbol to your watchlist and to view watchlist. |
12Stocks.com List of ETFs that track Smallcap Index
| Ticker | ETF Name | Watchlist | Recent Price | Smart Investing & Trading Score | Change % | Week % | Year-to-date % |
| IWM | iShares Russell 2000 | | 193.14 | 23 | 0.16 | -2.79 | -3.77% |
| IJR | iShares Core S&P Small-Cap | | 103.22 | 31 | 0.86 | -1.23 | -4.65% |
| IWN | iShares Russell 2000 Value | | 147.78 | 31 | 0.99 | -1.73 | -4.86% |
| VTWO | Vanguard Russell 2000 ETF | | 78.08 | 23 | 0.17 | -2.79 | -3.72% |
| IWO | iShares Russell 2000 Growth | | 245.29 | 23 | -0.67 | -3.94 | -2.75% |
| IJS | iShares S&P Small-Cap 600 Value | | 95.61 | 32 | 1.16 | -0.58 | -7.24% |
| IJT | iShares S&P Small-Cap 600 Growth | | 122.21 | 31 | 0.53 | -2.06 | -2.34% |
| XSLV | PowerShares S&P SmallCap Low Volatil ETF | | 42.18 | 42 | 1.27 | 0.21 | -4.46% |
| SAA | ProShares Ultra SmallCap600 | | 21.80 | 18 | 0.83 | -3.37 | -12.63% |
| SMLV | SPDR SSGA US Small Cap Low Volatil ETF | | 106.09 | 37 | 2.18 | 1.03 | -5.71% |
| SDD | ProShares UltraShort SmallCap600 | | 20.34 | 76 | -1.69 | 2.57 | 10.38% |
| SBB | ProShares Short SmallCap600 | | 16.84 | 76 | -0.82 | 1.77 | 5.71% |
| 12Stocks.com: Charts, Trends, Fundamental Data and Performances of SmallCap Stocks | |
|
We now take in-depth look at all SmallCap stocks including charts, multi-period performances and overall trends (as measured by Smart Investing & Trading Score). One can sort SmallCap stocks (click link to choose) by Daily, Weekly and by Year-to-Date performances. Also, one can sort by size of the company or by market capitalization. |
| Select Your Default Chart Type: | |||||
| |||||
| Click on stock symbol or name for detailed view. Click on to add stock symbol to your watchlist and to view watchlist. Quick View: Move mouse or cursor over "Daily" to quickly view daily technical stock chart and over "Weekly" to view weekly technical stock chart. | |||||

 | VSTO Vista Outdoor Inc. |
| Sector: Consumer Staples | |
| SubSector: Sporting Goods | |
| MarketCap: 405.144 Millions | |
| Recent Price: 32.36 Smart Investing & Trading Score: 61 | |
| Day Percent Change: 0.59% Day Change: 0.19 | |
| Week Change: -1.58% Year-to-date Change: 9.4% | |
| VSTO Links: Profile News Message Board | |
| Charts:- Daily , Weekly | |
| Add VSTO to Watchlist: View: Get Complete VSTO Trend Analysis ➞ | |
 | ASUR Asure Software, Inc. |
| Sector: Technology | |
| SubSector: Business Software & Services | |
| MarketCap: 103.758 Millions | |
| Recent Price: 6.99 Smart Investing & Trading Score: 10 | |
| Day Percent Change: 0.58% Day Change: 0.04 | |
| Week Change: -4.25% Year-to-date Change: -26.6% | |
| ASUR Links: Profile News Message Board | |
| Charts:- Daily , Weekly | |
| Add ASUR to Watchlist: View: Get Complete ASUR Trend Analysis ➞ | |
 | HCKT The Hackett Group, Inc. |
| Sector: Technology | |
| SubSector: Information Technology Services | |
| MarketCap: 334.468 Millions | |
| Recent Price: 22.60 Smart Investing & Trading Score: 18 | |
| Day Percent Change: 0.58% Day Change: 0.13 | |
| Week Change: -0.48% Year-to-date Change: -0.8% | |
| HCKT Links: Profile News Message Board | |
| Charts:- Daily , Weekly | |
| Add HCKT to Watchlist: View: Get Complete HCKT Trend Analysis ➞ | |
 | ALLO Allogene Therapeutics, Inc. |
| Sector: Health Care | |
| SubSector: Biotechnology | |
| MarketCap: 2858.65 Millions | |
| Recent Price: 3.48 Smart Investing & Trading Score: 28 | |
| Day Percent Change: 0.58% Day Change: 0.02 | |
| Week Change: -8.42% Year-to-date Change: 8.4% | |
| ALLO Links: Profile News Message Board | |
| Charts:- Daily , Weekly | |
| Add ALLO to Watchlist: View: Get Complete ALLO Trend Analysis ➞ | |
 | OSUR OraSure Technologies, Inc. |
| Sector: Health Care | |
| SubSector: Medical Instruments & Supplies | |
| MarketCap: 468.26 Millions | |
| Recent Price: 5.28 Smart Investing & Trading Score: 32 | |
| Day Percent Change: 0.57% Day Change: 0.03 | |
| Week Change: -4.35% Year-to-date Change: -35.6% | |
| OSUR Links: Profile News Message Board | |
| Charts:- Daily , Weekly | |
| Add OSUR to Watchlist: View: Get Complete OSUR Trend Analysis ➞ | |
 | HL Hecla Mining Company |
| Sector: Materials | |
| SubSector: Gold | |
| MarketCap: 1048.49 Millions | |
| Recent Price: 5.31 Smart Investing & Trading Score: 78 | |
| Day Percent Change: 0.57% Day Change: 0.03 | |
| Week Change: -2.03% Year-to-date Change: 10.4% | |
| HL Links: Profile News Message Board | |
| Charts:- Daily , Weekly | |
| Add HL to Watchlist: View: Get Complete HL Trend Analysis ➞ | |
 | DRH DiamondRock Hospitality Company |
| Sector: Financials | |
| SubSector: REIT - Hotel/Motel | |
| MarketCap: 964 Millions | |
| Recent Price: 8.83 Smart Investing & Trading Score: 10 | |
| Day Percent Change: 0.57% Day Change: 0.05 | |
| Week Change: -4.85% Year-to-date Change: -6.0% | |
| DRH Links: Profile News Message Board | |
| Charts:- Daily , Weekly | |
| Add DRH to Watchlist: View: Get Complete DRH Trend Analysis ➞ | |
 | PCRX Pacira BioSciences, Inc. |
| Sector: Health Care | |
| SubSector: Drugs - Generic | |
| MarketCap: 1403.95 Millions | |
| Recent Price: 26.25 Smart Investing & Trading Score: 20 | |
| Day Percent Change: 0.57% Day Change: 0.15 | |
| Week Change: -2.16% Year-to-date Change: -22.2% | |
| PCRX Links: Profile News Message Board | |
| Charts:- Daily , Weekly | |
| Add PCRX to Watchlist: View: Get Complete PCRX Trend Analysis ➞ | |
 | OOMA Ooma, Inc. |
| Sector: Technology | |
| SubSector: Diversified Communication Services | |
| MarketCap: 222.064 Millions | |
| Recent Price: 7.06 Smart Investing & Trading Score: 17 | |
| Day Percent Change: 0.57% Day Change: 0.04 | |
| Week Change: -4.59% Year-to-date Change: -34.2% | |
| OOMA Links: Profile News Message Board | |
| Charts:- Daily , Weekly | |
| Add OOMA to Watchlist: View: Get Complete OOMA Trend Analysis ➞ | |
 | CAKE The Cheesecake Factory Incorporated |
| Sector: Services & Goods | |
| SubSector: Restaurants | |
| MarketCap: 829 Millions | |
| Recent Price: 34.00 Smart Investing & Trading Score: 35 | |
| Day Percent Change: 0.56% Day Change: 0.19 | |
| Week Change: 1.64% Year-to-date Change: -2.9% | |
| CAKE Links: Profile News Message Board | |
| Charts:- Daily , Weekly | |
| Add CAKE to Watchlist: View: Get Complete CAKE Trend Analysis ➞ | |
 | PJT PJT Partners Inc. |
| Sector: Financials | |
| SubSector: Asset Management | |
| MarketCap: 1100.93 Millions | |
| Recent Price: 91.76 Smart Investing & Trading Score: 18 | |
| Day Percent Change: 0.56% Day Change: 0.51 | |
| Week Change: -1.35% Year-to-date Change: -9.9% | |
| PJT Links: Profile News Message Board | |
| Charts:- Daily , Weekly | |
| Add PJT to Watchlist: View: Get Complete PJT Trend Analysis ➞ | |
 | DORM Dorman Products, Inc. |
| Sector: Consumer Staples | |
| SubSector: Auto Parts | |
| MarketCap: 2028.79 Millions | |
| Recent Price: 88.40 Smart Investing & Trading Score: 54 | |
| Day Percent Change: 0.56% Day Change: 0.49 | |
| Week Change: -1.83% Year-to-date Change: 6.0% | |
| DORM Links: Profile News Message Board | |
| Charts:- Daily , Weekly | |
| Add DORM to Watchlist: View: Get Complete DORM Trend Analysis ➞ | |
 | CNK Cinemark Holdings, Inc. |
| Sector: Services & Goods | |
| SubSector: Movie Production, Theaters | |
| MarketCap: 1776.29 Millions | |
| Recent Price: 18.22 Smart Investing & Trading Score: 69 | |
| Day Percent Change: 0.55% Day Change: 0.10 | |
| Week Change: 2.42% Year-to-date Change: 29.3% | |
| CNK Links: Profile News Message Board | |
| Charts:- Daily , Weekly | |
| Add CNK to Watchlist: View: Get Complete CNK Trend Analysis ➞ | |
 | AVIR Atea Pharmaceuticals, Inc. |
| Sector: Health Care | |
| SubSector: Biotechnology | |
| MarketCap: 22587 Millions | |
| Recent Price: 3.72 Smart Investing & Trading Score: 40 | |
| Day Percent Change: 0.54% Day Change: 0.02 | |
| Week Change: -1.06% Year-to-date Change: 22.0% | |
| AVIR Links: Profile News Message Board | |
| Charts:- Daily , Weekly | |
| Add AVIR to Watchlist: View: Get Complete AVIR Trend Analysis ➞ | |
 | AESI Atlas Energy Solutions Inc. |
| Sector: Energy | |
| SubSector: Oil & Gas Equipment & Services | |
| MarketCap: 947 Millions | |
| Recent Price: 22.29 Smart Investing & Trading Score: 61 | |
| Day Percent Change: 0.54% Day Change: 0.12 | |
| Week Change: -4.91% Year-to-date Change: 30.2% | |
| AESI Links: Profile News Message Board | |
| Charts:- Daily , Weekly | |
| Add AESI to Watchlist: View: Get Complete AESI Trend Analysis ➞ | |
 | NOVA Sunnova Energy International Inc. |
| Sector: Services & Goods | |
| SubSector: Management Services | |
| MarketCap: 1180.45 Millions | |
| Recent Price: 3.80 Smart Investing & Trading Score: 20 | |
| Day Percent Change: 0.53% Day Change: 0.02 | |
| Week Change: -9.74% Year-to-date Change: -75.1% | |
| NOVA Links: Profile News Message Board | |
| Charts:- Daily , Weekly | |
| Add NOVA to Watchlist: View: Get Complete NOVA Trend Analysis ➞ | |
 | CHUY Chuy s Holdings, Inc. |
| Sector: Services & Goods | |
| SubSector: Restaurants | |
| MarketCap: 159.17 Millions | |
| Recent Price: 30.59 Smart Investing & Trading Score: 10 | |
| Day Percent Change: 0.53% Day Change: 0.16 | |
| Week Change: -3.04% Year-to-date Change: -20.0% | |
| CHUY Links: Profile News Message Board | |
| Charts:- Daily , Weekly | |
| Add CHUY to Watchlist: View: Get Complete CHUY Trend Analysis ➞ | |
 | CSTM Constellium SE |
| Sector: Materials | |
| SubSector: Aluminum | |
| MarketCap: 646.608 Millions | |
| Recent Price: 20.72 Smart Investing & Trading Score: 41 | |
| Day Percent Change: 0.53% Day Change: 0.11 | |
| Week Change: -2.03% Year-to-date Change: 3.8% | |
| CSTM Links: Profile News Message Board | |
| Charts:- Daily , Weekly | |
| Add CSTM to Watchlist: View: Get Complete CSTM Trend Analysis ➞ | |
 | MLP Maui Land & Pineapple Company, Inc. |
| Sector: Financials | |
| SubSector: Real Estate Development | |
| MarketCap: 186.619 Millions | |
| Recent Price: 19.37 Smart Investing & Trading Score: 25 | |
| Day Percent Change: 0.52% Day Change: 0.10 | |
| Week Change: -1.27% Year-to-date Change: 21.9% | |
| MLP Links: Profile News Message Board | |
| Charts:- Daily , Weekly | |
| Add MLP to Watchlist: View: Get Complete MLP Trend Analysis ➞ | |
 | WLDN Willdan Group, Inc. |
| Sector: Services & Goods | |
| SubSector: Technical Services | |
| MarketCap: 235.61 Millions | |
| Recent Price: 26.85 Smart Investing & Trading Score: 61 | |
| Day Percent Change: 0.52% Day Change: 0.14 | |
| Week Change: -1.36% Year-to-date Change: 24.9% | |
| WLDN Links: Profile News Message Board | |
| Charts:- Daily , Weekly | |
| Add WLDN to Watchlist: View: Get Complete WLDN Trend Analysis ➞ | |
 | GES Guess , Inc. |
| Sector: Services & Goods | |
| SubSector: Apparel Stores | |
| MarketCap: 591.908 Millions | |
| Recent Price: 25.69 Smart Investing & Trading Score: 58 | |
| Day Percent Change: 0.51% Day Change: 0.13 | |
| Week Change: -6.89% Year-to-date Change: 11.4% | |
| GES Links: Profile News Message Board | |
| Charts:- Daily , Weekly | |
| Add GES to Watchlist: View: Get Complete GES Trend Analysis ➞ | |
 | ITCI Intra-Cellular Therapies, Inc. |
| Sector: Health Care | |
| SubSector: Biotechnology | |
| MarketCap: 991.885 Millions | |
| Recent Price: 72.37 Smart Investing & Trading Score: 68 | |
| Day Percent Change: 0.51% Day Change: 0.37 | |
| Week Change: 9.85% Year-to-date Change: 1.1% | |
| ITCI Links: Profile News Message Board | |
| Charts:- Daily , Weekly | |
| Add ITCI to Watchlist: View: Get Complete ITCI Trend Analysis ➞ | |
 | IRT Independence Realty Trust, Inc. |
| Sector: Financials | |
| SubSector: REIT - Residential | |
| MarketCap: 980.161 Millions | |
| Recent Price: 15.62 Smart Investing & Trading Score: 61 | |
| Day Percent Change: 0.51% Day Change: 0.08 | |
| Week Change: -2.38% Year-to-date Change: 2.1% | |
| IRT Links: Profile News Message Board | |
| Charts:- Daily , Weekly | |
| Add IRT to Watchlist: View: Get Complete IRT Trend Analysis ➞ | |
 | MSGE Madison Square Garden Entertainment Corp. |
| Sector: Technology | |
| SubSector: Entertainment | |
| MarketCap: 18837 Millions | |
| Recent Price: 37.80 Smart Investing & Trading Score: 53 | |
| Day Percent Change: 0.51% Day Change: 0.19 | |
| Week Change: -3.47% Year-to-date Change: 18.8% | |
| MSGE Links: Profile News Message Board | |
| Charts:- Daily , Weekly | |
| Add MSGE to Watchlist: View: Get Complete MSGE Trend Analysis ➞ | |
 | KIND Nextdoor Holdings, Inc. |
| Sector: Services & Goods | |
| SubSector: Internet Content & Information | |
| MarketCap: 1170 Millions | |
| Recent Price: 1.98 Smart Investing & Trading Score: 63 | |
| Day Percent Change: 0.51% Day Change: 0.01 | |
| Week Change: -2.94% Year-to-date Change: 7.0% | |
| KIND Links: Profile News Message Board | |
| Charts:- Daily , Weekly | |
| Add KIND to Watchlist: View: Get Complete KIND Trend Analysis ➞ | |
| Too many stocks? View smallcap stocks filtered by marketcap & sector |
| Marketcap: All SmallCap Stocks (default-no microcap), Large, Mid-Range, Small & MicroCap |
| Sector: Tech, Finance, Energy, Staples, Retail, Industrial, Materials, Utilities & Medical |
|
Best Stocks Today 12Stocks.com |
© 2024 12Stocks.com Terms & Conditions Privacy Contact Us
All Information Provided Only For Education And Not To Be Used For Investing or Trading. See Terms & Conditions


One More Thing ... Get Best Stocks Delivered Daily!
Never Ever Miss A Move With Our Top Ten Stocks Lists
Find Best Stocks In Any Market - Bull or Bear Market
Take A Peek At Our Top Ten Stocks Lists: Daily, Weekly, Year-to-Date & Top Trends
Find Best Stocks In Any Market - Bull or Bear Market
Take A Peek At Our Top Ten Stocks Lists: Daily, Weekly, Year-to-Date & Top Trends
Smallcap Stocks With Best Up Trends [0-bearish to 100-bullish]: Vertex Energy[100], BancFirst [100], Calavo Growers[100], Old Second[100], Excelerate Energy[100], Gannett Co[100], Core Molding[100], Angel Oak[100], Tejon Ranch[100], United Fire[100], Victory Capital[100]
Best Smallcap Stocks Year-to-Date:
Agenus [541.38%], CareMax [429.9%], Janux [353.14%], Viking [240.78%], Alpine Immune[238.94%], Longboard [185.43%], Arcutis Bio[181.42%], Avidity Biosciences[153.65%], Super Micro[151.06%], Vera [145.48%], Stoke [129.66%] Best Smallcap Stocks This Week:
Macatawa Bank[47.34%], Vertex Energy[43.27%], Snap One[29.73%], Humacyte [28.47%], Vanda [24.03%], ALX Oncology[22.49%], ContextLogic [16.8%], ProKidney [16.57%], Calavo Growers[16.24%], Badger Meter[15.61%], Accolade [13.45%] Best Smallcap Stocks Daily:
Tellurian [28.11%], Origin Materials[19.59%], Metropolitan Bank[18.01%], Genelux [14.25%], Humacyte [14.02%], Vertex Energy[13.74%], Chemung Financial[10.29%], Gevo [10.14%], Riot Blockchain[10.13%], Marathon Patent[9.78%], Emergent BioSolutions[9.68%]