
 Login Sign Up


| |||||
 |  | ||||

| 12Stocks.com Market Intelligence |
Best SmallCap Stocks
|
| In a hurry? Small Cap Stock Lists: Performance Trends Table, Stock Charts
Sort Small Cap stocks: Daily, Weekly, Year-to-Date, Market Cap & Trends. Filter Small Cap stocks list by sector: Show all, Tech, Finance, Energy, Staples, Retail, Industrial, Materials, Utilities and HealthCare Filter Small Cap stocks list by size: All Large Medium Small and MicroCap |
| 12Stocks.com Small Cap Stocks Performances & Trends Daily | |||||||||
|
|  The overall Smart Investing & Trading Score is 63 (0-bearish to 100-bullish) which puts Small Cap index in short term neutral to bullish trend. The Smart Investing & Trading Score from previous trading session is 58 and hence an improvement of trend.
| ||||||||
Here are the Smart Investing & Trading Scores of the most requested small cap stocks at 12Stocks.com (click stock name for detailed review):
|


| 12Stocks.com: Investing in Smallcap Index with Stocks | |
|
The following table helps investors and traders sort through current performance and trends (as measured by Smart Investing & Trading Score) of various
stocks in the Smallcap Index. Quick View: Move mouse or cursor over stock symbol (ticker) to view short-term technical chart and over stock name to view long term chart. Click on  to add stock symbol to your watchlist and to add stock symbol to your watchlist and  to view watchlist. Click on any ticker or stock name for detailed market intelligence report for that stock. to view watchlist. Click on any ticker or stock name for detailed market intelligence report for that stock. |
12Stocks.com Performance of Stocks in Smallcap Index
| Ticker | Stock Name | Watchlist | Category | Recent Price | Smart Investing & Trading Score | Change % | YTD Change% |
| EFC | Ellington Financial |   | Financials | 11.60 | 74 | 1.13 | -8.73% |
| VIAV | Viavi Solutions | | Technology | 8.04 | 18 | 1.13 | -20.16% |
| WERN | Werner Enterprises | | Transports | 35.73 | 32 | 1.12 | -15.66% |
| CCOI | Cogent | | Technology | 65.23 | 64 | 1.12 | -14.24% |
| DIN | Dine Brands | | Services & Goods | 44.72 | 74 | 1.12 | -9.94% |
| STER | Sterling Check | | Technology | 15.30 | 63 | 1.12 | 9.83% |
| ASTE | Astec Industries | | Industrials | 43.41 | 75 | 1.11 | 16.71% |
| GRC | Gorman-Rupp | | Industrials | 36.39 | 51 | 1.11 | 2.42% |
| ZIP | ZipRecruiter | | Industrials | 10.48 | 28 | 1.11 | -25.26% |
| IRT | Independence Realty | | Financials | 16.00 | 83 | 1.11 | 4.61% |
| NBR | Nabors Industries | | Energy | 76.83 | 35 | 1.10 | -5.87% |
| UBSI | United Bankshares | | Financials | 34.81 | 74 | 1.10 | -7.30% |
| KMT | Kennametal | | Industrials | 24.43 | 80 | 1.10 | -5.25% |
| DAKT | Daktronics | | Technology | 9.21 | 51 | 1.10 | 8.61% |
| HGV | Hilton Grand | | Services & Goods | 44.30 | 68 | 1.10 | 10.25% |
| ALHC | Alignment Healthcare | | Health Care | 5.07 | 37 | 1.10 | -42.77% |
| ATMU | Atmus Filtration | | Industrials | 31.13 | 46 | 1.10 | 33.20% |
| SMRT | SmartRent | | Technology | 2.31 | 27 | 1.09 | -27.43% |
| SSB | South State | | Financials | 80.11 | 54 | 1.09 | -5.14% |
| APPF | AppFolio | | Technology | 217.13 | 32 | 1.09 | 25.33% |
| LNZA | LanzaTech Global | | Industrials | 2.77 | 10 | 1.09 | -43.98% |
| MPX | Marine Products | | Consumer Staples | 11.25 | 75 | 1.08 | -1.32% |
| ORRF | Orrstown Financial | | Financials | 26.31 | 69 | 1.08 | -10.81% |
| EIG | Employers | | Financials | 44.82 | 90 | 1.08 | 13.76% |
| NAPA | Duckhorn Portfolio | | Consumer Staples | 8.45 | 42 | 1.08 | -14.13% |
| For chart view version of above stock list: Chart View ➞ 0 - 25 , 25 - 50 , 50 - 75 , 75 - 100 , 100 - 125 , 125 - 150 , 150 - 175 , 175 - 200 , 200 - 225 , 225 - 250 , 250 - 275 , 275 - 300 , 300 - 325 , 325 - 350 , 350 - 375 , 375 - 400 , 400 - 425 , 425 - 450 , 450 - 475 , 475 - 500 , 500 - 525 , 525 - 550 , 550 - 575 , 575 - 600 , 600 - 625 , 625 - 650 , 650 - 675 , 675 - 700 , 700 - 725 , 725 - 750 , 750 - 775 , 775 - 800 , 800 - 825 , 825 - 850 , 850 - 875 , 875 - 900 , 900 - 925 , 925 - 950 , 950 - 975 , 975 - 1000 , 1000 - 1025 , 1025 - 1050 , 1050 - 1075 , 1075 - 1100 , 1100 - 1125 , 1125 - 1150 , 1150 - 1175 , 1175 - 1200 , 1200 - 1225 , 1225 - 1250 , 1250 - 1275 , 1275 - 1300 , 1300 - 1325 , 1325 - 1350 , 1350 - 1375 | ||
 | Click To Change The Sort Order: By Market Cap or Company Size Performance: Year-to-date, Week and Day |  |
| Too many stocks? View smallcap stocks filtered by marketcap & sector |
| Marketcap: All SmallCap Stocks (default-no microcap), Large, Mid-Range, Small |
| Smallcap Sector: Tech, Finance, Energy, Staples, Retail, Industrial, Materials, & Medical |
|
Get the most comprehensive stock market coverage daily at 12Stocks.com ➞ Best Stocks Today ➞ Best Stocks Weekly ➞ Best Stocks Year-to-Date ➞ Best Stocks Trends ➞  Best Stocks Today 12Stocks.com Best Nasdaq Stocks ➞ Best S&P 500 Stocks ➞ Best Tech Stocks ➞ Best Biotech Stocks ➞ |
| Detailed Overview of SmallCap Stocks |
| SmallCap Technical Overview, Leaders & Laggards, Top SmallCap ETF Funds & Detailed SmallCap Stocks List, Charts, Trends & More |
| Smallcap: Technical Analysis, Trends & YTD Performance | |
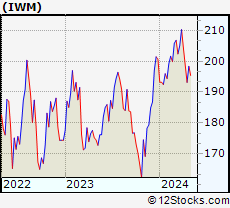
| SmallCap segment as represented by
IWM, an exchange-traded fund [ETF], holds basket of thousands of smallcap stocks from across all major sectors of the US stock market. The smallcap index (contains stocks like Riverbed & Sotheby's) is down by -1.27% and is currently underperforming the overall market by -6.76% year-to-date. Below is a quick view of technical charts and trends: | |
 IWM Weekly Chart |
|
| Long Term Trend: Good | |
| Medium Term Trend: Not Good | |
 IWM Daily Chart |
|
| Short Term Trend: Very Good | |
| Overall Trend Score: 63 | |
| YTD Performance: -1.27% | |
| **Trend Scores & Views Are Only For Educational Purposes And Not For Investing | |
| 12Stocks.com: Top Performing Small Cap Index Stocks | ||||||||||||||||||||||||||||||||||||||||||||||||
 The top performing Small Cap Index stocks year to date are
Now, more recently, over last week, the top performing Small Cap Index stocks on the move are


|
||||||||||||||||||||||||||||||||||||||||||||||||
| 12Stocks.com: Investing in Smallcap Index using Exchange Traded Funds | |
|
The following table shows list of key exchange traded funds (ETF) that
help investors track Smallcap index. The following list also includes leveraged ETF funds that track twice or thrice the daily returns of Smallcap indices. Short or inverse ETF funds move in the opposite direction to the index they track and are useful during market pullbacks or during bear markets. Quick View: Move mouse or cursor over ETF symbol (ticker) to view short-term technical chart and over ETF name to view long term chart. Click on ticker or stock name for detailed view. Click on to add stock symbol to your watchlist and to view watchlist. |
12Stocks.com List of ETFs that track Smallcap Index
| Ticker | ETF Name | Watchlist | Recent Price | Smart Investing & Trading Score | Change % | Week % | Year-to-date % |
| IWM | iShares Russell 2000 | | 198.16 | 63 | 1.46 | 2.6 | -1.27% |
| VTWO | Vanguard Russell 2000 ETF | | 80.14 | 70 | 1.54 | 2.63 | -1.19% |
| IJR | iShares Core S&P Small-Cap | | 105.44 | 75 | 1.91 | 2.16 | -2.59% |
| IWN | iShares Russell 2000 Value | | 151.50 | 68 | 1.33 | 2.52 | -2.47% |
| IWO | iShares Russell 2000 Growth | | 252.16 | 58 | 1.71 | 2.8 | -0.02% |
| IJS | iShares S&P Small-Cap 600 Value | | 97.77 | 67 | 1.39 | 2.26 | -5.14% |
| IJT | iShares S&P Small-Cap 600 Growth | | 123.36 | 70 | 0.00 | 0.94 | -1.42% |
| XSLV | PowerShares S&P SmallCap Low Volatil ETF | | 42.95 | 80 | 1.21 | 1.84 | -2.71% |
| SMLV | SPDR SSGA US Small Cap Low Volatil ETF | | 107.10 | 65 | -0.35 | 0.95 | -4.82% |
| 12Stocks.com: Charts, Trends, Fundamental Data and Performances of SmallCap Stocks | |
|
We now take in-depth look at all SmallCap stocks including charts, multi-period performances and overall trends (as measured by Smart Investing & Trading Score). One can sort SmallCap stocks (click link to choose) by Daily, Weekly and by Year-to-Date performances. Also, one can sort by size of the company or by market capitalization. |
| Select Your Default Chart Type: | |||||
| |||||
| Click on stock symbol or name for detailed view. Click on to add stock symbol to your watchlist and to view watchlist. Quick View: Move mouse or cursor over "Daily" to quickly view daily technical stock chart and over "Weekly" to view weekly technical stock chart. | |||||

 | EFC Ellington Financial Inc. |
| Sector: Financials | |
| SubSector: Mortgage Investment | |
| MarketCap: 380.239 Millions | |
| Recent Price: 11.60 Smart Investing & Trading Score: 74 | |
| Day Percent Change: 1.13% Day Change: 0.13 | |
| Week Change: 1.58% Year-to-date Change: -8.7% | |
| EFC Links: Profile News Message Board | |
| Charts:- Daily , Weekly | |
| Add EFC to Watchlist: View: Get Complete EFC Trend Analysis ➞ | |
 | VIAV Viavi Solutions Inc. |
| Sector: Technology | |
| SubSector: Communication Equipment | |
| MarketCap: 2653.29 Millions | |
| Recent Price: 8.04 Smart Investing & Trading Score: 18 | |
| Day Percent Change: 1.13% Day Change: 0.09 | |
| Week Change: -0.37% Year-to-date Change: -20.2% | |
| VIAV Links: Profile News Message Board | |
| Charts:- Daily , Weekly | |
| Add VIAV to Watchlist: View: Get Complete VIAV Trend Analysis ➞ | |
 | WERN Werner Enterprises, Inc. |
| Sector: Transports | |
| SubSector: Trucking | |
| MarketCap: 2409.65 Millions | |
| Recent Price: 35.73 Smart Investing & Trading Score: 32 | |
| Day Percent Change: 1.12% Day Change: 0.39 | |
| Week Change: -0.35% Year-to-date Change: -15.7% | |
| WERN Links: Profile News Message Board | |
| Charts:- Daily , Weekly | |
| Add WERN to Watchlist: View: Get Complete WERN Trend Analysis ➞ | |
 | CCOI Cogent Communications Holdings, Inc. |
| Sector: Technology | |
| SubSector: Diversified Communication Services | |
| MarketCap: 3868.14 Millions | |
| Recent Price: 65.23 Smart Investing & Trading Score: 64 | |
| Day Percent Change: 1.12% Day Change: 0.72 | |
| Week Change: 3.07% Year-to-date Change: -14.2% | |
| CCOI Links: Profile News Message Board | |
| Charts:- Daily , Weekly | |
| Add CCOI to Watchlist: View: Get Complete CCOI Trend Analysis ➞ | |
 | DIN Dine Brands Global, Inc. |
| Sector: Services & Goods | |
| SubSector: Restaurants | |
| MarketCap: 421.17 Millions | |
| Recent Price: 44.72 Smart Investing & Trading Score: 74 | |
| Day Percent Change: 1.12% Day Change: 0.50 | |
| Week Change: 3.15% Year-to-date Change: -9.9% | |
| DIN Links: Profile News Message Board | |
| Charts:- Daily , Weekly | |
| Add DIN to Watchlist: View: Get Complete DIN Trend Analysis ➞ | |
 | STER Sterling Check Corp. |
| Sector: Technology | |
| SubSector: Software - Infrastructure | |
| MarketCap: 1180 Millions | |
| Recent Price: 15.30 Smart Investing & Trading Score: 63 | |
| Day Percent Change: 1.12% Day Change: 0.17 | |
| Week Change: 2.14% Year-to-date Change: 9.8% | |
| STER Links: Profile News Message Board | |
| Charts:- Daily , Weekly | |
| Add STER to Watchlist: View: Get Complete STER Trend Analysis ➞ | |
 | ASTE Astec Industries, Inc. |
| Sector: Industrials | |
| SubSector: Farm & Construction Machinery | |
| MarketCap: 731.607 Millions | |
| Recent Price: 43.41 Smart Investing & Trading Score: 75 | |
| Day Percent Change: 1.11% Day Change: 0.48 | |
| Week Change: 1.51% Year-to-date Change: 16.7% | |
| ASTE Links: Profile News Message Board | |
| Charts:- Daily , Weekly | |
| Add ASTE to Watchlist: View: Get Complete ASTE Trend Analysis ➞ | |
 | GRC The Gorman-Rupp Company |
| Sector: Industrials | |
| SubSector: Diversified Machinery | |
| MarketCap: 729.616 Millions | |
| Recent Price: 36.39 Smart Investing & Trading Score: 51 | |
| Day Percent Change: 1.11% Day Change: 0.40 | |
| Week Change: 1.03% Year-to-date Change: 2.4% | |
| GRC Links: Profile News Message Board | |
| Charts:- Daily , Weekly | |
| Add GRC to Watchlist: View: Get Complete GRC Trend Analysis ➞ | |
 | ZIP ZipRecruiter, Inc. |
| Sector: Industrials | |
| SubSector: Staffing & Employment Services | |
| MarketCap: 1730 Millions | |
| Recent Price: 10.48 Smart Investing & Trading Score: 28 | |
| Day Percent Change: 1.11% Day Change: 0.12 | |
| Week Change: -0.43% Year-to-date Change: -25.3% | |
| ZIP Links: Profile News Message Board | |
| Charts:- Daily , Weekly | |
| Add ZIP to Watchlist: View: Get Complete ZIP Trend Analysis ➞ | |
 | IRT Independence Realty Trust, Inc. |
| Sector: Financials | |
| SubSector: REIT - Residential | |
| MarketCap: 980.161 Millions | |
| Recent Price: 16.00 Smart Investing & Trading Score: 83 | |
| Day Percent Change: 1.11% Day Change: 0.17 | |
| Week Change: 2.46% Year-to-date Change: 4.6% | |
| IRT Links: Profile News Message Board | |
| Charts:- Daily , Weekly | |
| Add IRT to Watchlist: View: Get Complete IRT Trend Analysis ➞ | |
 | NBR Nabors Industries Ltd. |
| Sector: Energy | |
| SubSector: Oil & Gas Drilling & Exploration | |
| MarketCap: 240.539 Millions | |
| Recent Price: 76.83 Smart Investing & Trading Score: 35 | |
| Day Percent Change: 1.10% Day Change: 0.83 | |
| Week Change: 0.4% Year-to-date Change: -5.9% | |
| NBR Links: Profile News Message Board | |
| Charts:- Daily , Weekly | |
| Add NBR to Watchlist: View: Get Complete NBR Trend Analysis ➞ | |
 | UBSI United Bankshares, Inc. |
| Sector: Financials | |
| SubSector: Regional - Mid-Atlantic Banks | |
| MarketCap: 2286.79 Millions | |
| Recent Price: 34.81 Smart Investing & Trading Score: 74 | |
| Day Percent Change: 1.10% Day Change: 0.38 | |
| Week Change: 1.87% Year-to-date Change: -7.3% | |
| UBSI Links: Profile News Message Board | |
| Charts:- Daily , Weekly | |
| Add UBSI to Watchlist: View: Get Complete UBSI Trend Analysis ➞ | |
 | KMT Kennametal Inc. |
| Sector: Industrials | |
| SubSector: Machine Tools & Accessories | |
| MarketCap: 1486.48 Millions | |
| Recent Price: 24.43 Smart Investing & Trading Score: 80 | |
| Day Percent Change: 1.10% Day Change: 0.26 | |
| Week Change: -0.31% Year-to-date Change: -5.3% | |
| KMT Links: Profile News Message Board | |
| Charts:- Daily , Weekly | |
| Add KMT to Watchlist: View: Get Complete KMT Trend Analysis ➞ | |
 | DAKT Daktronics, Inc. |
| Sector: Technology | |
| SubSector: Computer Based Systems | |
| MarketCap: 223.539 Millions | |
| Recent Price: 9.21 Smart Investing & Trading Score: 51 | |
| Day Percent Change: 1.10% Day Change: 0.10 | |
| Week Change: 0.77% Year-to-date Change: 8.6% | |
| DAKT Links: Profile News Message Board | |
| Charts:- Daily , Weekly | |
| Add DAKT to Watchlist: View: Get Complete DAKT Trend Analysis ➞ | |
 | HGV Hilton Grand Vacations Inc. |
| Sector: Services & Goods | |
| SubSector: Resorts & Casinos | |
| MarketCap: 1333.04 Millions | |
| Recent Price: 44.30 Smart Investing & Trading Score: 68 | |
| Day Percent Change: 1.10% Day Change: 0.48 | |
| Week Change: 2.52% Year-to-date Change: 10.3% | |
| HGV Links: Profile News Message Board | |
| Charts:- Daily , Weekly | |
| Add HGV to Watchlist: View: Get Complete HGV Trend Analysis ➞ | |
 | ALHC Alignment Healthcare, Inc. |
| Sector: Health Care | |
| SubSector: Healthcare Plans | |
| MarketCap: 1100 Millions | |
| Recent Price: 5.07 Smart Investing & Trading Score: 37 | |
| Day Percent Change: 1.10% Day Change: 0.06 | |
| Week Change: -2.6% Year-to-date Change: -42.8% | |
| ALHC Links: Profile News Message Board | |
| Charts:- Daily , Weekly | |
| Add ALHC to Watchlist: View: Get Complete ALHC Trend Analysis ➞ | |
 | ATMU Atmus Filtration Technologies Inc. |
| Sector: Industrials | |
| SubSector: Pollution & Treatment Controls | |
| MarketCap: 1830 Millions | |
| Recent Price: 31.13 Smart Investing & Trading Score: 46 | |
| Day Percent Change: 1.10% Day Change: 0.34 | |
| Week Change: 0.84% Year-to-date Change: 33.2% | |
| ATMU Links: Profile News Message Board | |
| Charts:- Daily , Weekly | |
| Add ATMU to Watchlist: View: Get Complete ATMU Trend Analysis ➞ | |
 | SMRT SmartRent, Inc. |
| Sector: Technology | |
| SubSector: Software - Application | |
| MarketCap: 733 Millions | |
| Recent Price: 2.31 Smart Investing & Trading Score: 27 | |
| Day Percent Change: 1.09% Day Change: 0.02 | |
| Week Change: 1.09% Year-to-date Change: -27.4% | |
| SMRT Links: Profile News Message Board | |
| Charts:- Daily , Weekly | |
| Add SMRT to Watchlist: View: Get Complete SMRT Trend Analysis ➞ | |
 | SSB South State Corporation |
| Sector: Financials | |
| SubSector: Regional - Mid-Atlantic Banks | |
| MarketCap: 2113.49 Millions | |
| Recent Price: 80.11 Smart Investing & Trading Score: 54 | |
| Day Percent Change: 1.09% Day Change: 0.86 | |
| Week Change: 2.27% Year-to-date Change: -5.1% | |
| SSB Links: Profile News Message Board | |
| Charts:- Daily , Weekly | |
| Add SSB to Watchlist: View: Get Complete SSB Trend Analysis ➞ | |
 | APPF AppFolio, Inc. |
| Sector: Technology | |
| SubSector: Application Software | |
| MarketCap: 3412.02 Millions | |
| Recent Price: 217.13 Smart Investing & Trading Score: 32 | |
| Day Percent Change: 1.09% Day Change: 2.34 | |
| Week Change: 4.14% Year-to-date Change: 25.3% | |
| APPF Links: Profile News Message Board | |
| Charts:- Daily , Weekly | |
| Add APPF to Watchlist: View: Get Complete APPF Trend Analysis ➞ | |
 | LNZA LanzaTech Global, Inc. |
| Sector: Industrials | |
| SubSector: Waste Management | |
| MarketCap: 1340 Millions | |
| Recent Price: 2.77 Smart Investing & Trading Score: 10 | |
| Day Percent Change: 1.09% Day Change: 0.03 | |
| Week Change: -3.15% Year-to-date Change: -44.0% | |
| LNZA Links: Profile News Message Board | |
| Charts:- Daily , Weekly | |
| Add LNZA to Watchlist: View: Get Complete LNZA Trend Analysis ➞ | |
 | MPX Marine Products Corporation |
| Sector: Consumer Staples | |
| SubSector: Recreational Vehicles | |
| MarketCap: 316.059 Millions | |
| Recent Price: 11.25 Smart Investing & Trading Score: 75 | |
| Day Percent Change: 1.08% Day Change: 0.12 | |
| Week Change: -0.71% Year-to-date Change: -1.3% | |
| MPX Links: Profile News Message Board | |
| Charts:- Daily , Weekly | |
| Add MPX to Watchlist: View: Get Complete MPX Trend Analysis ➞ | |
 | ORRF Orrstown Financial Services, Inc. |
| Sector: Financials | |
| SubSector: Regional - Northeast Banks | |
| MarketCap: 159.999 Millions | |
| Recent Price: 26.31 Smart Investing & Trading Score: 69 | |
| Day Percent Change: 1.08% Day Change: 0.28 | |
| Week Change: 1.35% Year-to-date Change: -10.8% | |
| ORRF Links: Profile News Message Board | |
| Charts:- Daily , Weekly | |
| Add ORRF to Watchlist: View: Get Complete ORRF Trend Analysis ➞ | |
 | EIG Employers Holdings, Inc. |
| Sector: Financials | |
| SubSector: Accident & Health Insurance | |
| MarketCap: 1202.6 Millions | |
| Recent Price: 44.82 Smart Investing & Trading Score: 90 | |
| Day Percent Change: 1.08% Day Change: 0.48 | |
| Week Change: 1.04% Year-to-date Change: 13.8% | |
| EIG Links: Profile News Message Board | |
| Charts:- Daily , Weekly | |
| Add EIG to Watchlist: View: Get Complete EIG Trend Analysis ➞ | |
 | NAPA The Duckhorn Portfolio, Inc. |
| Sector: Consumer Staples | |
| SubSector: Beverages - Wineries & Distilleries | |
| MarketCap: 1500 Millions | |
| Recent Price: 8.45 Smart Investing & Trading Score: 42 | |
| Day Percent Change: 1.08% Day Change: 0.09 | |
| Week Change: 2.42% Year-to-date Change: -14.1% | |
| NAPA Links: Profile News Message Board | |
| Charts:- Daily , Weekly | |
| Add NAPA to Watchlist: View: Get Complete NAPA Trend Analysis ➞ | |
| For tabular summary view of above stock list: Summary View ➞ 0 - 25 , 25 - 50 , 50 - 75 , 75 - 100 , 100 - 125 , 125 - 150 , 150 - 175 , 175 - 200 , 200 - 225 , 225 - 250 , 250 - 275 , 275 - 300 , 300 - 325 , 325 - 350 , 350 - 375 , 375 - 400 , 400 - 425 , 425 - 450 , 450 - 475 , 475 - 500 , 500 - 525 , 525 - 550 , 550 - 575 , 575 - 600 , 600 - 625 , 625 - 650 , 650 - 675 , 675 - 700 , 700 - 725 , 725 - 750 , 750 - 775 , 775 - 800 , 800 - 825 , 825 - 850 , 850 - 875 , 875 - 900 , 900 - 925 , 925 - 950 , 950 - 975 , 975 - 1000 , 1000 - 1025 , 1025 - 1050 , 1050 - 1075 , 1075 - 1100 , 1100 - 1125 , 1125 - 1150 , 1150 - 1175 , 1175 - 1200 , 1200 - 1225 , 1225 - 1250 , 1250 - 1275 , 1275 - 1300 , 1300 - 1325 , 1325 - 1350 , 1350 - 1375 | ||
| Click To Change The Sort Order: By Market Cap or Company Size Performance: Year-to-date, Week and Day | |
| Select Chart Type: | ||
| Too many stocks? View smallcap stocks filtered by marketcap & sector |
| Marketcap: All SmallCap Stocks (default-no microcap), Large, Mid-Range, Small & MicroCap |
| Sector: Tech, Finance, Energy, Staples, Retail, Industrial, Materials, Utilities & Medical |
|
Best Stocks Today 12Stocks.com |
© 2024 12Stocks.com Terms & Conditions Privacy Contact Us
All Information Provided Only For Education And Not To Be Used For Investing or Trading. See Terms & Conditions


One More Thing ... Get Best Stocks Delivered Daily!
Never Ever Miss A Move With Our Top Ten Stocks Lists
Find Best Stocks In Any Market - Bull or Bear Market
Take A Peek At Our Top Ten Stocks Lists: Daily, Weekly, Year-to-Date & Top Trends
Find Best Stocks In Any Market - Bull or Bear Market
Take A Peek At Our Top Ten Stocks Lists: Daily, Weekly, Year-to-Date & Top Trends
Smallcap Stocks With Best Up Trends [0-bearish to 100-bullish]: Hibbett Sports[100], BioLife Solutions[100], AZZ [100], Mueller Industries[100], Oscar Health[100], Boot Barn[100], Calavo Growers[100], NBT Bancorp[100], Peoples Bancorp[100], Riot Blockchain[100], Piedmont Office[100]
Best Smallcap Stocks Year-to-Date:
Janux [365.24%], Viking [258.89%], Longboard [219.64%], Super Micro[175.13%], Vera [163.02%], Hippo [129.8%], MicroStrategy [115.12%], Sana [99.88%], SoundHound AI[97.2%], Verde Clean[97%], Dyne [96.24%] Best Smallcap Stocks This Week:
Matterport [164.08%], Riot Blockchain[28.59%], ProKidney [25.74%], Cipher Mining[23.83%], Seres [21.4%], Hibbett Sports[21.34%], SoundHound AI[18.87%], BigBear.ai [18.62%], Marathon Patent[15.94%], MicroStrategy [15.73%], Heron [15.72%] Best Smallcap Stocks Daily:
Hibbett Sports[19.08%], Marathon Patent[18.12%], Heron [17.95%], SES AI[16.52%], SoundHound AI[11.64%], FuelCell Energy[10.86%], BigBear.ai [10.26%], Summit [9.31%], HealthStream [9.25%], Super Micro[9.07%], Seres [8.82%]