
 Login Sign Up


| |||||
 |  | ||||

| 12Stocks.com Market Intelligence |
Best SmallCap Stocks
|
| In a hurry? Small Cap Stock Lists: Performance Trends Table, Stock Charts
Sort Small Cap stocks: Daily, Weekly, Year-to-Date, Market Cap & Trends. Filter Small Cap stocks list by sector: Show all, Tech, Finance, Energy, Staples, Retail, Industrial, Materials, Utilities and HealthCare Filter Small Cap stocks list by size: All Large Medium Small and MicroCap |
| 12Stocks.com Small Cap Stocks Performances & Trends Daily | |||||||||
|
|  The overall Smart Investing & Trading Score is 23 (0-bearish to 100-bullish) which puts Small Cap index in short term bearish to neutral trend. The Smart Investing & Trading Score from previous trading session is 13 and hence an improvement of trend.
| ||||||||
Here are the Smart Investing & Trading Scores of the most requested small cap stocks at 12Stocks.com (click stock name for detailed review):
|


| 12Stocks.com: Investing in Smallcap Index with Stocks | |
|
The following table helps investors and traders sort through current performance and trends (as measured by Smart Investing & Trading Score) of various
stocks in the Smallcap Index. Quick View: Move mouse or cursor over stock symbol (ticker) to view short-term technical chart and over stock name to view long term chart. Click on  to add stock symbol to your watchlist and to add stock symbol to your watchlist and  to view watchlist. Click on any ticker or stock name for detailed market intelligence report for that stock. to view watchlist. Click on any ticker or stock name for detailed market intelligence report for that stock. |
12Stocks.com Performance of Stocks in Smallcap Index
| Ticker | Stock Name | Watchlist | Category | Recent Price | Smart Investing & Trading Score | Change % | YTD Change% |
| OPFI | OppFi |   | Financials | 2.88 | 25 | -1.37 | -43.64% |
| RMBS | Rambus | | Technology | 56.46 | 0 | -1.38 | -17.27% |
| BELFB | Bel Fuse | | Technology | 56.03 | 0 | -1.39 | -16.09% |
| TRUE | TrueCar | | Technology | 2.83 | 10 | -1.39 | -18.21% |
| TRNO | Terreno Realty | | Financials | 54.75 | 0 | -1.39 | -12.64% |
| CMRE | Costamare | | Transports | 10.68 | 13 | -1.39 | 2.59% |
| MTDR | Matador Resources | | Energy | 64.74 | 36 | -1.39 | 13.86% |
| TRUP | Trupanion | | Financials | 21.36 | 20 | -1.39 | -29.99% |
| TRDA | Entrada | | Health Care | 12.05 | 0 | -1.39 | -26.57% |
| DDS | Dillard s | | Services & Goods | 401.81 | 44 | -1.40 | -0.46% |
| HZO | MarineMax | | Services & Goods | 26.68 | 10 | -1.40 | -31.41% |
| BL | BlackLine | | Technology | 57.85 | 10 | -1.40 | -7.35% |
| CIVI | Civitas Solutions | | Health Care | 71.89 | 15 | -1.40 | 5.13% |
| HQI | HireQuest | | Services & Goods | 11.94 | 10 | -1.40 | -22.21% |
| AMWD | American Woodmark | | Consumer Staples | 90.10 | 0 | -1.41 | -2.96% |
| ICFI | ICF | | Services & Goods | 138.09 | 13 | -1.41 | 2.98% |
| MXL | MaxLinear | | Technology | 20.27 | 25 | -1.41 | -14.72% |
| HSHP | Himalaya Shipping | | Industrials | 7.70 | 36 | -1.41 | 14.07% |
| TDW | Tidewater | | Energy | 88.78 | 36 | -1.42 | 23.12% |
| ACA | Arcosa | | Industrials | 75.78 | 0 | -1.42 | -8.30% |
| ALLO | Allogene | | Health Care | 3.46 | 15 | -1.42 | 7.79% |
| SUM | Summit Materials | | Industrials | 38.47 | 26 | -1.43 | 0.03% |
| GNE | Genie Energy | | Energy | 15.37 | 45 | -1.44 | -45.36% |
| YEXT | Yext | | Technology | 5.49 | 10 | -1.44 | -6.79% |
| SKY | Skyline Champion | | Industrials | 73.36 | 26 | -1.45 | -1.21% |


| Too many stocks? View smallcap stocks filtered by marketcap & sector |
| Marketcap: All SmallCap Stocks (default-no microcap), Large, Mid-Range, Small |
| Smallcap Sector: Tech, Finance, Energy, Staples, Retail, Industrial, Materials, & Medical |
|
Get the most comprehensive stock market coverage daily at 12Stocks.com ➞ Best Stocks Today ➞ Best Stocks Weekly ➞ Best Stocks Year-to-Date ➞ Best Stocks Trends ➞  Best Stocks Today 12Stocks.com Best Nasdaq Stocks ➞ Best S&P 500 Stocks ➞ Best Tech Stocks ➞ Best Biotech Stocks ➞ |
| Detailed Overview of SmallCap Stocks |
| SmallCap Technical Overview, Leaders & Laggards, Top SmallCap ETF Funds & Detailed SmallCap Stocks List, Charts, Trends & More |
| Smallcap: Technical Analysis, Trends & YTD Performance | |
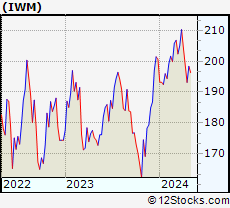
| SmallCap segment as represented by
IWM, an exchange-traded fund [ETF], holds basket of thousands of smallcap stocks from across all major sectors of the US stock market. The smallcap index (contains stocks like Riverbed & Sotheby's) is down by -3.92% and is currently underperforming the overall market by -8.11% year-to-date. Below is a quick view of technical charts and trends: | |
 IWM Weekly Chart |
|
| Long Term Trend: Not Good | |
| Medium Term Trend: Not Good | |
 IWM Daily Chart |
|
| Short Term Trend: Not Good | |
| Overall Trend Score: 23 | |
| YTD Performance: -3.92% | |
| **Trend Scores & Views Are Only For Educational Purposes And Not For Investing | |
| 12Stocks.com: Top Performing Small Cap Index Stocks | ||||||||||||||||||||||||||||||||||||||||||||||||
 The top performing Small Cap Index stocks year to date are
Now, more recently, over last week, the top performing Small Cap Index stocks on the move are


|
||||||||||||||||||||||||||||||||||||||||||||||||
| 12Stocks.com: Investing in Smallcap Index using Exchange Traded Funds | |
|
The following table shows list of key exchange traded funds (ETF) that
help investors track Smallcap index. The following list also includes leveraged ETF funds that track twice or thrice the daily returns of Smallcap indices. Short or inverse ETF funds move in the opposite direction to the index they track and are useful during market pullbacks or during bear markets. Quick View: Move mouse or cursor over ETF symbol (ticker) to view short-term technical chart and over ETF name to view long term chart. Click on ticker or stock name for detailed view. Click on to add stock symbol to your watchlist and to view watchlist. |
12Stocks.com List of ETFs that track Smallcap Index
| Ticker | ETF Name | Watchlist | Recent Price | Smart Investing & Trading Score | Change % | Week % | Year-to-date % |
| IWM | iShares Russell 2000 | | 192.84 | 23 | -0.08 | -2.94 | -3.92% |
| IJR | iShares Core S&P Small-Cap | | 102.34 | 10 | 0.21 | -2.08 | -5.46% |
| VTWO | Vanguard Russell 2000 ETF | | 77.95 | 23 | -0.13 | -2.95 | -3.88% |
| IWN | iShares Russell 2000 Value | | 146.33 | 10 | 0.21 | -2.69 | -5.79% |
| IJS | iShares S&P Small-Cap 600 Value | | 94.51 | 18 | 0.41 | -1.73 | -8.31% |
| IWO | iShares Russell 2000 Growth | | 246.94 | 36 | -0.44 | -3.3 | -2.09% |
| IJT | iShares S&P Small-Cap 600 Growth | | 121.57 | 13 | -0.22 | -2.57 | -2.85% |
| XSLV | PowerShares S&P SmallCap Low Volatil ETF | | 41.65 | 25 | 0.56 | -1.05 | -5.66% |
| SAA | ProShares Ultra SmallCap600 | | 21.62 | 10 | -0.18 | -4.17 | -13.35% |
| SMLV | SPDR SSGA US Small Cap Low Volatil ETF | | 103.83 | 10 | 0.16 | -1.13 | -7.72% |
| SBB | ProShares Short SmallCap600 | | 16.98 | 100 | 0.77 | 2.62 | 6.59% |
| SDD | ProShares UltraShort SmallCap600 | | 20.69 | 95 | 0.44 | 4.33 | 12.28% |
| 12Stocks.com: Charts, Trends, Fundamental Data and Performances of SmallCap Stocks | |
|
We now take in-depth look at all SmallCap stocks including charts, multi-period performances and overall trends (as measured by Smart Investing & Trading Score). One can sort SmallCap stocks (click link to choose) by Daily, Weekly and by Year-to-Date performances. Also, one can sort by size of the company or by market capitalization. |
| Select Your Default Chart Type: | |||||
| |||||
| Click on stock symbol or name for detailed view. Click on to add stock symbol to your watchlist and to view watchlist. Quick View: Move mouse or cursor over "Daily" to quickly view daily technical stock chart and over "Weekly" to view weekly technical stock chart. | |||||

 | OPFI OppFi Inc. |
| Sector: Financials | |
| SubSector: Credit Services | |
| MarketCap: 226 Millions | |
| Recent Price: 2.88 Smart Investing & Trading Score: 25 | |
| Day Percent Change: -1.37% Day Change: -0.04 | |
| Week Change: -10% Year-to-date Change: -43.6% | |
| OPFI Links: Profile News Message Board | |
| Charts:- Daily , Weekly | |
| Add OPFI to Watchlist: View: Get Complete OPFI Trend Analysis ➞ | |
 | RMBS Rambus Inc. |
| Sector: Technology | |
| SubSector: Semiconductor- Memory Chips | |
| MarketCap: 1296 Millions | |
| Recent Price: 56.46 Smart Investing & Trading Score: 0 | |
| Day Percent Change: -1.38% Day Change: -0.79 | |
| Week Change: -6.12% Year-to-date Change: -17.3% | |
| RMBS Links: Profile News Message Board | |
| Charts:- Daily , Weekly | |
| Add RMBS to Watchlist: View: Get Complete RMBS Trend Analysis ➞ | |
 | BELFB Bel Fuse Inc. |
| Sector: Technology | |
| SubSector: Diversified Electronics | |
| MarketCap: 77.0396 Millions | |
| Recent Price: 56.03 Smart Investing & Trading Score: 0 | |
| Day Percent Change: -1.39% Day Change: -0.79 | |
| Week Change: -4.29% Year-to-date Change: -16.1% | |
| BELFB Links: Profile News Message Board | |
| Charts:- Daily , Weekly | |
| Add BELFB to Watchlist: View: Get Complete BELFB Trend Analysis ➞ | |
 | TRUE TrueCar, Inc. |
| Sector: Technology | |
| SubSector: Internet Service Providers | |
| MarketCap: 244.18 Millions | |
| Recent Price: 2.83 Smart Investing & Trading Score: 10 | |
| Day Percent Change: -1.39% Day Change: -0.04 | |
| Week Change: -3.41% Year-to-date Change: -18.2% | |
| TRUE Links: Profile News Message Board | |
| Charts:- Daily , Weekly | |
| Add TRUE to Watchlist: View: Get Complete TRUE Trend Analysis ➞ | |
 | TRNO Terreno Realty Corporation |
| Sector: Financials | |
| SubSector: REIT - Industrial | |
| MarketCap: 3359.69 Millions | |
| Recent Price: 54.75 Smart Investing & Trading Score: 0 | |
| Day Percent Change: -1.39% Day Change: -0.77 | |
| Week Change: -9.92% Year-to-date Change: -12.6% | |
| TRNO Links: Profile News Message Board | |
| Charts:- Daily , Weekly | |
| Add TRNO to Watchlist: View: Get Complete TRNO Trend Analysis ➞ | |
 | CMRE Costamare Inc. |
| Sector: Transports | |
| SubSector: Shipping | |
| MarketCap: 492.214 Millions | |
| Recent Price: 10.68 Smart Investing & Trading Score: 13 | |
| Day Percent Change: -1.39% Day Change: -0.15 | |
| Week Change: -3% Year-to-date Change: 2.6% | |
| CMRE Links: Profile News Message Board | |
| Charts:- Daily , Weekly | |
| Add CMRE to Watchlist: View: Get Complete CMRE Trend Analysis ➞ | |
 | MTDR Matador Resources Company |
| Sector: Energy | |
| SubSector: Independent Oil & Gas | |
| MarketCap: 196.593 Millions | |
| Recent Price: 64.74 Smart Investing & Trading Score: 36 | |
| Day Percent Change: -1.39% Day Change: -0.91 | |
| Week Change: -5.53% Year-to-date Change: 13.9% | |
| MTDR Links: Profile News Message Board | |
| Charts:- Daily , Weekly | |
| Add MTDR to Watchlist: View: Get Complete MTDR Trend Analysis ➞ | |
 | TRUP Trupanion, Inc. |
| Sector: Financials | |
| SubSector: Accident & Health Insurance | |
| MarketCap: 852.06 Millions | |
| Recent Price: 21.36 Smart Investing & Trading Score: 20 | |
| Day Percent Change: -1.39% Day Change: -0.30 | |
| Week Change: -8.64% Year-to-date Change: -30.0% | |
| TRUP Links: Profile News Message Board | |
| Charts:- Daily , Weekly | |
| Add TRUP to Watchlist: View: Get Complete TRUP Trend Analysis ➞ | |
 | TRDA Entrada Therapeutics, Inc. |
| Sector: Health Care | |
| SubSector: Biotechnology | |
| MarketCap: 481 Millions | |
| Recent Price: 12.05 Smart Investing & Trading Score: 0 | |
| Day Percent Change: -1.39% Day Change: -0.17 | |
| Week Change: -6.95% Year-to-date Change: -26.6% | |
| TRDA Links: Profile News Message Board | |
| Charts:- Daily , Weekly | |
| Add TRDA to Watchlist: View: Get Complete TRDA Trend Analysis ➞ | |
 | DDS Dillard s, Inc. |
| Sector: Services & Goods | |
| SubSector: Department Stores | |
| MarketCap: 1170.82 Millions | |
| Recent Price: 401.81 Smart Investing & Trading Score: 44 | |
| Day Percent Change: -1.40% Day Change: -5.71 | |
| Week Change: -2.14% Year-to-date Change: -0.5% | |
| DDS Links: Profile News Message Board | |
| Charts:- Daily , Weekly | |
| Add DDS to Watchlist: View: Get Complete DDS Trend Analysis ➞ | |
 | HZO MarineMax, Inc. |
| Sector: Services & Goods | |
| SubSector: Specialty Retail, Other | |
| MarketCap: 234.744 Millions | |
| Recent Price: 26.68 Smart Investing & Trading Score: 10 | |
| Day Percent Change: -1.40% Day Change: -0.38 | |
| Week Change: -2.81% Year-to-date Change: -31.4% | |
| HZO Links: Profile News Message Board | |
| Charts:- Daily , Weekly | |
| Add HZO to Watchlist: View: Get Complete HZO Trend Analysis ➞ | |
 | BL BlackLine, Inc. |
| Sector: Technology | |
| SubSector: Application Software | |
| MarketCap: 2972.62 Millions | |
| Recent Price: 57.85 Smart Investing & Trading Score: 10 | |
| Day Percent Change: -1.40% Day Change: -0.82 | |
| Week Change: -8.95% Year-to-date Change: -7.4% | |
| BL Links: Profile News Message Board | |
| Charts:- Daily , Weekly | |
| Add BL to Watchlist: View: Get Complete BL Trend Analysis ➞ | |
 | CIVI Civitas Solutions, Inc. |
| Sector: Health Care | |
| SubSector: Long-Term Care Facilities | |
| MarketCap: 625.74 Millions | |
| Recent Price: 71.89 Smart Investing & Trading Score: 15 | |
| Day Percent Change: -1.40% Day Change: -1.02 | |
| Week Change: -3.19% Year-to-date Change: 5.1% | |
| CIVI Links: Profile News Message Board | |
| Charts:- Daily , Weekly | |
| Add CIVI to Watchlist: View: Get Complete CIVI Trend Analysis ➞ | |
 | HQI HireQuest, Inc. |
| Sector: Services & Goods | |
| SubSector: Staffing & Outsourcing Services | |
| MarketCap: 77 Millions | |
| Recent Price: 11.94 Smart Investing & Trading Score: 10 | |
| Day Percent Change: -1.40% Day Change: -0.17 | |
| Week Change: -7.59% Year-to-date Change: -22.2% | |
| HQI Links: Profile News Message Board | |
| Charts:- Daily , Weekly | |
| Add HQI to Watchlist: View: Get Complete HQI Trend Analysis ➞ | |
 | AMWD American Woodmark Corporation |
| Sector: Consumer Staples | |
| SubSector: Home Furnishings & Fixtures | |
| MarketCap: 958.435 Millions | |
| Recent Price: 90.10 Smart Investing & Trading Score: 0 | |
| Day Percent Change: -1.41% Day Change: -1.29 | |
| Week Change: -6.17% Year-to-date Change: -3.0% | |
| AMWD Links: Profile News Message Board | |
| Charts:- Daily , Weekly | |
| Add AMWD to Watchlist: View: Get Complete AMWD Trend Analysis ➞ | |
 | ICFI ICF International, Inc. |
| Sector: Services & Goods | |
| SubSector: Management Services | |
| MarketCap: 1218.75 Millions | |
| Recent Price: 138.09 Smart Investing & Trading Score: 13 | |
| Day Percent Change: -1.41% Day Change: -1.98 | |
| Week Change: -3.87% Year-to-date Change: 3.0% | |
| ICFI Links: Profile News Message Board | |
| Charts:- Daily , Weekly | |
| Add ICFI to Watchlist: View: Get Complete ICFI Trend Analysis ➞ | |
 | MXL MaxLinear, Inc. |
| Sector: Technology | |
| SubSector: Semiconductor - Integrated Circuits | |
| MarketCap: 751.31 Millions | |
| Recent Price: 20.27 Smart Investing & Trading Score: 25 | |
| Day Percent Change: -1.41% Day Change: -0.29 | |
| Week Change: -8.07% Year-to-date Change: -14.7% | |
| MXL Links: Profile News Message Board | |
| Charts:- Daily , Weekly | |
| Add MXL to Watchlist: View: Get Complete MXL Trend Analysis ➞ | |
 | HSHP Himalaya Shipping Ltd. |
| Sector: Industrials | |
| SubSector: Marine Shipping | |
| MarketCap: 179 Millions | |
| Recent Price: 7.70 Smart Investing & Trading Score: 36 | |
| Day Percent Change: -1.41% Day Change: -0.11 | |
| Week Change: -0.65% Year-to-date Change: 14.1% | |
| HSHP Links: Profile News Message Board | |
| Charts:- Daily , Weekly | |
| Add HSHP to Watchlist: View: Get Complete HSHP Trend Analysis ➞ | |
 | TDW Tidewater Inc. |
| Sector: Energy | |
| SubSector: Oil & Gas Equipment & Services | |
| MarketCap: 295.061 Millions | |
| Recent Price: 88.78 Smart Investing & Trading Score: 36 | |
| Day Percent Change: -1.42% Day Change: -1.28 | |
| Week Change: -8.37% Year-to-date Change: 23.1% | |
| TDW Links: Profile News Message Board | |
| Charts:- Daily , Weekly | |
| Add TDW to Watchlist: View: Get Complete TDW Trend Analysis ➞ | |
 | ACA Arcosa, Inc. |
| Sector: Industrials | |
| SubSector: Farm & Construction Machinery | |
| MarketCap: 1692.57 Millions | |
| Recent Price: 75.78 Smart Investing & Trading Score: 0 | |
| Day Percent Change: -1.42% Day Change: -1.09 | |
| Week Change: -5.96% Year-to-date Change: -8.3% | |
| ACA Links: Profile News Message Board | |
| Charts:- Daily , Weekly | |
| Add ACA to Watchlist: View: Get Complete ACA Trend Analysis ➞ | |
 | ALLO Allogene Therapeutics, Inc. |
| Sector: Health Care | |
| SubSector: Biotechnology | |
| MarketCap: 2858.65 Millions | |
| Recent Price: 3.46 Smart Investing & Trading Score: 15 | |
| Day Percent Change: -1.42% Day Change: -0.05 | |
| Week Change: -8.95% Year-to-date Change: 7.8% | |
| ALLO Links: Profile News Message Board | |
| Charts:- Daily , Weekly | |
| Add ALLO to Watchlist: View: Get Complete ALLO Trend Analysis ➞ | |
 | SUM Summit Materials, Inc. |
| Sector: Industrials | |
| SubSector: General Building Materials | |
| MarketCap: 1138.23 Millions | |
| Recent Price: 38.47 Smart Investing & Trading Score: 26 | |
| Day Percent Change: -1.43% Day Change: -0.56 | |
| Week Change: -6.24% Year-to-date Change: 0.0% | |
| SUM Links: Profile News Message Board | |
| Charts:- Daily , Weekly | |
| Add SUM to Watchlist: View: Get Complete SUM Trend Analysis ➞ | |
 | GNE Genie Energy Ltd. |
| Sector: Energy | |
| SubSector: Independent Oil & Gas | |
| MarketCap: 177.293 Millions | |
| Recent Price: 15.37 Smart Investing & Trading Score: 45 | |
| Day Percent Change: -1.44% Day Change: -0.23 | |
| Week Change: 0.2% Year-to-date Change: -45.4% | |
| GNE Links: Profile News Message Board | |
| Charts:- Daily , Weekly | |
| Add GNE to Watchlist: View: Get Complete GNE Trend Analysis ➞ | |
 | YEXT Yext, Inc. |
| Sector: Technology | |
| SubSector: Internet Software & Services | |
| MarketCap: 1414.91 Millions | |
| Recent Price: 5.49 Smart Investing & Trading Score: 10 | |
| Day Percent Change: -1.44% Day Change: -0.08 | |
| Week Change: -3.68% Year-to-date Change: -6.8% | |
| YEXT Links: Profile News Message Board | |
| Charts:- Daily , Weekly | |
| Add YEXT to Watchlist: View: Get Complete YEXT Trend Analysis ➞ | |
 | SKY Skyline Champion Corporation |
| Sector: Industrials | |
| SubSector: Manufactured Housing | |
| MarketCap: 915.145 Millions | |
| Recent Price: 73.36 Smart Investing & Trading Score: 26 | |
| Day Percent Change: -1.45% Day Change: -1.08 | |
| Week Change: -7.36% Year-to-date Change: -1.2% | |
| SKY Links: Profile News Message Board | |
| Charts:- Daily , Weekly | |
| Add SKY to Watchlist: View: Get Complete SKY Trend Analysis ➞ | |
| Too many stocks? View smallcap stocks filtered by marketcap & sector |
| Marketcap: All SmallCap Stocks (default-no microcap), Large, Mid-Range, Small & MicroCap |
| Sector: Tech, Finance, Energy, Staples, Retail, Industrial, Materials, Utilities & Medical |
|
Best Stocks Today 12Stocks.com |
© 2024 12Stocks.com Terms & Conditions Privacy Contact Us
All Information Provided Only For Education And Not To Be Used For Investing or Trading. See Terms & Conditions


One More Thing ... Get Best Stocks Delivered Daily!
Never Ever Miss A Move With Our Top Ten Stocks Lists
Find Best Stocks In Any Market - Bull or Bear Market
Take A Peek At Our Top Ten Stocks Lists: Daily, Weekly, Year-to-Date & Top Trends
Find Best Stocks In Any Market - Bull or Bear Market
Take A Peek At Our Top Ten Stocks Lists: Daily, Weekly, Year-to-Date & Top Trends
Smallcap Stocks With Best Up Trends [0-bearish to 100-bullish]: Badger Meter[100], Cullinan Oncology[100], Oscar Health[100], NextNav [100], EchoStar [100], Victory Capital[100], Macatawa Bank[100], IMAX [100], Envestnet [100], ALX Oncology[100], Argan [95]
Best Smallcap Stocks Year-to-Date:
Agenus [500.31%], CareMax [417.53%], Janux [348.12%], Viking [247.5%], Alpine Immune[238.5%], Super Micro[226.63%], Longboard [194.76%], Arcutis Bio[192.57%], Vera [161.3%], Avidity Biosciences[154.87%], Hippo [128.32%] Best Smallcap Stocks This Week:
Macatawa Bank[44.42%], 23andMe Holding[33.3%], ProKidney [32%], Snap One[29.73%], Vertex Energy[25.96%], ALX Oncology[20.64%], Vanda [20.63%], Expensify [18.37%], Badger Meter[16.72%], ContextLogic [15%], Cullinan Oncology[13.89%] Best Smallcap Stocks Daily:
23andMe Holding[65.91%], Vertex Energy[33.78%], Zura Bio[17.20%], Badger Meter[16.65%], ContextLogic [15.81%], Expensify [15.23%], Montrose Environmental[12.84%], Vaxxinity [10.05%], Cipher Mining[8.65%], FiscalNote [8.61%], Vuzix [8.15%]