
 Login Sign Up


| |||||
 |  | ||||

| 12Stocks.com Market Intelligence |
Best SmallCap Stocks
|
| In a hurry? Small Cap Stock Lists: Performance Trends Table, Stock Charts
Sort Small Cap stocks: Daily, Weekly, Year-to-Date, Market Cap & Trends. Filter Small Cap stocks list by sector: Show all, Tech, Finance, Energy, Staples, Retail, Industrial, Materials, Utilities and HealthCare Filter Small Cap stocks list by size: All Large Medium Small and MicroCap |
| 12Stocks.com Small Cap Stocks Performances & Trends Daily | |||||||||
|
|  The overall Smart Investing & Trading Score is 58 (0-bearish to 100-bullish) which puts Small Cap index in short term neutral trend. The Smart Investing & Trading Score from previous trading session is 23 and hence an improvement of trend.
| ||||||||
Here are the Smart Investing & Trading Scores of the most requested small cap stocks at 12Stocks.com (click stock name for detailed review):
|


| 12Stocks.com: Investing in Smallcap Index with Stocks | |
|
The following table helps investors and traders sort through current performance and trends (as measured by Smart Investing & Trading Score) of various
stocks in the Smallcap Index. Quick View: Move mouse or cursor over stock symbol (ticker) to view short-term technical chart and over stock name to view long term chart. Click on  to add stock symbol to your watchlist and to add stock symbol to your watchlist and  to view watchlist. Click on any ticker or stock name for detailed market intelligence report for that stock. to view watchlist. Click on any ticker or stock name for detailed market intelligence report for that stock. |
12Stocks.com Performance of Stocks in Smallcap Index
| Ticker | Stock Name | Watchlist | Category | Recent Price | Smart Investing & Trading Score | Change % | YTD Change% |
| VRNT | Verint Systems |   | Technology | 29.16 | 28 | 0.07 | 7.88% |
| YMAB | Y-mAbs | | Health Care | 15.16 | 78 | 0.07 | 122.29% |
| DNLI | Denali | | Health Care | 15.99 | 17 | 0.06 | -25.49% |
| DOCN | DigitalOcean | | Technology | 32.45 | 10 | 0.06 | -12.25% |
| REX | REX American | | Industrials | 56.27 | 46 | 0.05 | 18.96% |
| REZI | Resideo | | Services & Goods | 19.28 | 51 | 0.05 | 2.44% |
| MSEX | Middlesex Water | | Utilities | 48.02 | 67 | 0.04 | -26.82% |
| OTTR | Otter Tail | | Utilities | 84.28 | 49 | 0.04 | -0.81% |
| HQI | HireQuest | | Services & Goods | 12.20 | 35 | 0.04 | -20.52% |
| FLNG | Flex LNG | | Energy | 25.80 | 67 | 0.04 | -11.22% |
| ITGR | Integer | | Health Care | 116.65 | 51 | 0.03 | 17.73% |
| EVBG | Everbridge | | Technology | 34.89 | 68 | 0.03 | 43.52% |
| BOH | Bank of Hawaii | | Financials | 58.41 | 35 | 0.02 | -19.39% |
| TARO | Taro Pharmaceutical | | Health Care | 42.26 | 42 | 0.02 | 1.15% |
| VTS | Vitesse Energy | | Energy | 23.00 | 51 | 0.00 | 3.88% |
| TTI | TETRA | | Energy | 4.42 | 68 | 0.00 | -2.21% |
| SMRT | SmartRent | | Technology | 2.29 | 10 | 0.00 | -28.21% |
| HAFC | Hanmi Financial | | Financials | 15.21 | 67 | 0.00 | -21.60% |
| RGR | Sturm Ruger | | Industrials | 46.75 | 88 | 0.00 | 2.86% |
| DMRC | Digimarc | | Technology | 22.59 | 28 | 0.00 | -37.46% |
| ANGO | AngioDynamics | | Health Care | 6.26 | 48 | 0.00 | -20.15% |
| CDZI | Cadiz | | Utilities | 2.25 | 32 | 0.00 | -19.64% |
| FF | FutureFuel | | Materials | 5.63 | 10 | 0.00 | -7.40% |
| LXU | LSB Industries | | Materials | 8.05 | 61 | 0.00 | -13.53% |
| CIM | Chimera | | Financials | 4.11 | 49 | 0.00 | -17.64% |


| Too many stocks? View smallcap stocks filtered by marketcap & sector |
| Marketcap: All SmallCap Stocks (default-no microcap), Large, Mid-Range, Small |
| Smallcap Sector: Tech, Finance, Energy, Staples, Retail, Industrial, Materials, & Medical |
|
Get the most comprehensive stock market coverage daily at 12Stocks.com ➞ Best Stocks Today ➞ Best Stocks Weekly ➞ Best Stocks Year-to-Date ➞ Best Stocks Trends ➞  Best Stocks Today 12Stocks.com Best Nasdaq Stocks ➞ Best S&P 500 Stocks ➞ Best Tech Stocks ➞ Best Biotech Stocks ➞ |
| Detailed Overview of SmallCap Stocks |
| SmallCap Technical Overview, Leaders & Laggards, Top SmallCap ETF Funds & Detailed SmallCap Stocks List, Charts, Trends & More |
| Smallcap: Technical Analysis, Trends & YTD Performance | |
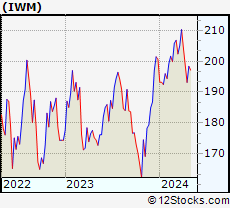
| SmallCap segment as represented by
IWM, an exchange-traded fund [ETF], holds basket of thousands of smallcap stocks from across all major sectors of the US stock market. The smallcap index (contains stocks like Riverbed & Sotheby's) is down by -2.7% and is currently underperforming the overall market by -7.09% year-to-date. Below is a quick view of technical charts and trends: | |
 IWM Weekly Chart |
|
| Long Term Trend: Good | |
| Medium Term Trend: Not Good | |
 IWM Daily Chart |
|
| Short Term Trend: Very Good | |
| Overall Trend Score: 58 | |
| YTD Performance: -2.7% | |
| **Trend Scores & Views Are Only For Educational Purposes And Not For Investing | |
| 12Stocks.com: Top Performing Small Cap Index Stocks | ||||||||||||||||||||||||||||||||||||||||||||||||
 The top performing Small Cap Index stocks year to date are
Now, more recently, over last week, the top performing Small Cap Index stocks on the move are


|
||||||||||||||||||||||||||||||||||||||||||||||||
| 12Stocks.com: Investing in Smallcap Index using Exchange Traded Funds | |
|
The following table shows list of key exchange traded funds (ETF) that
help investors track Smallcap index. The following list also includes leveraged ETF funds that track twice or thrice the daily returns of Smallcap indices. Short or inverse ETF funds move in the opposite direction to the index they track and are useful during market pullbacks or during bear markets. Quick View: Move mouse or cursor over ETF symbol (ticker) to view short-term technical chart and over ETF name to view long term chart. Click on ticker or stock name for detailed view. Click on to add stock symbol to your watchlist and to view watchlist. |
12Stocks.com List of ETFs that track Smallcap Index
| Ticker | ETF Name | Watchlist | Recent Price | Smart Investing & Trading Score | Change % | Week % | Year-to-date % |
| IWM | iShares Russell 2000 | | 195.30 | 58 | 1.12 | 1.12 | -2.7% |
| VTWO | Vanguard Russell 2000 ETF | | 78.92 | 58 | 1.08 | 1.08 | -2.69% |
| IWN | iShares Russell 2000 Value | | 149.51 | 63 | 1.17 | 1.17 | -3.75% |
| IJR | iShares Core S&P Small-Cap | | 103.47 | 45 | 0.24 | 0.24 | -4.42% |
| IWO | iShares Russell 2000 Growth | | 247.92 | 51 | 1.07 | 1.07 | -1.7% |
| IJS | iShares S&P Small-Cap 600 Value | | 96.43 | 32 | 0.86 | 0.86 | -6.44% |
| IJT | iShares S&P Small-Cap 600 Growth | | 123.36 | 70 | 0.94 | 0.94 | -1.42% |
| XSLV | PowerShares S&P SmallCap Low Volatil ETF | | 42.44 | 62 | 0.62 | 0.62 | -3.87% |
| SMLV | SPDR SSGA US Small Cap Low Volatil ETF | | 107.48 | 80 | 1.31 | 1.31 | -4.48% |
| SDD | ProShares UltraShort SmallCap600 | | 19.75 | 42 | -2.90 | -2.9 | 7.18% |
| SBB | ProShares Short SmallCap600 | | 16.62 | 42 | -1.31 | -1.31 | 4.33% |
| SAA | ProShares Ultra SmallCap600 | | 22.37 | 32 | 2.61 | 2.61 | -10.34% |
| 12Stocks.com: Charts, Trends, Fundamental Data and Performances of SmallCap Stocks | |
|
We now take in-depth look at all SmallCap stocks including charts, multi-period performances and overall trends (as measured by Smart Investing & Trading Score). One can sort SmallCap stocks (click link to choose) by Daily, Weekly and by Year-to-Date performances. Also, one can sort by size of the company or by market capitalization. |
| Select Your Default Chart Type: | |||||
| |||||
| Click on stock symbol or name for detailed view. Click on to add stock symbol to your watchlist and to view watchlist. Quick View: Move mouse or cursor over "Daily" to quickly view daily technical stock chart and over "Weekly" to view weekly technical stock chart. | |||||

 | VRNT Verint Systems Inc. |
| Sector: Technology | |
| SubSector: Business Software & Services | |
| MarketCap: 2902.18 Millions | |
| Recent Price: 29.16 Smart Investing & Trading Score: 28 | |
| Day Percent Change: 0.07% Day Change: 0.02 | |
| Week Change: 0.07% Year-to-date Change: 7.9% | |
| VRNT Links: Profile News Message Board | |
| Charts:- Daily , Weekly | |
| Add VRNT to Watchlist: View: Get Complete VRNT Trend Analysis ➞ | |
 | YMAB Y-mAbs Therapeutics, Inc. |
| Sector: Health Care | |
| SubSector: Biotechnology | |
| MarketCap: 899.585 Millions | |
| Recent Price: 15.16 Smart Investing & Trading Score: 78 | |
| Day Percent Change: 0.07% Day Change: 0.01 | |
| Week Change: 0.07% Year-to-date Change: 122.3% | |
| YMAB Links: Profile News Message Board | |
| Charts:- Daily , Weekly | |
| Add YMAB to Watchlist: View: Get Complete YMAB Trend Analysis ➞ | |
 | DNLI Denali Therapeutics Inc. |
| Sector: Health Care | |
| SubSector: Biotechnology | |
| MarketCap: 2020.05 Millions | |
| Recent Price: 15.99 Smart Investing & Trading Score: 17 | |
| Day Percent Change: 0.06% Day Change: 0.01 | |
| Week Change: 0.06% Year-to-date Change: -25.5% | |
| DNLI Links: Profile News Message Board | |
| Charts:- Daily , Weekly | |
| Add DNLI to Watchlist: View: Get Complete DNLI Trend Analysis ➞ | |
 | DOCN DigitalOcean Holdings, Inc. |
| Sector: Technology | |
| SubSector: Software - Infrastructure | |
| MarketCap: 3620 Millions | |
| Recent Price: 32.45 Smart Investing & Trading Score: 10 | |
| Day Percent Change: 0.06% Day Change: 0.02 | |
| Week Change: 0.06% Year-to-date Change: -12.3% | |
| DOCN Links: Profile News Message Board | |
| Charts:- Daily , Weekly | |
| Add DOCN to Watchlist: View: Get Complete DOCN Trend Analysis ➞ | |
 | REX REX American Resources Corporation |
| Sector: Industrials | |
| SubSector: Conglomerates | |
| MarketCap: 373.748 Millions | |
| Recent Price: 56.27 Smart Investing & Trading Score: 46 | |
| Day Percent Change: 0.05% Day Change: 0.03 | |
| Week Change: 0.05% Year-to-date Change: 19.0% | |
| REX Links: Profile News Message Board | |
| Charts:- Daily , Weekly | |
| Add REX to Watchlist: View: Get Complete REX Trend Analysis ➞ | |
 | REZI Resideo Technologies, Inc. |
| Sector: Services & Goods | |
| SubSector: Security & Protection Services | |
| MarketCap: 712.603 Millions | |
| Recent Price: 19.28 Smart Investing & Trading Score: 51 | |
| Day Percent Change: 0.05% Day Change: 0.01 | |
| Week Change: 0.05% Year-to-date Change: 2.4% | |
| REZI Links: Profile News Message Board | |
| Charts:- Daily , Weekly | |
| Add REZI to Watchlist: View: Get Complete REZI Trend Analysis ➞ | |
 | MSEX Middlesex Water Company |
| Sector: Utilities | |
| SubSector: Water Utilities | |
| MarketCap: 1082.02 Millions | |
| Recent Price: 48.02 Smart Investing & Trading Score: 67 | |
| Day Percent Change: 0.04% Day Change: 0.02 | |
| Week Change: 0.04% Year-to-date Change: -26.8% | |
| MSEX Links: Profile News Message Board | |
| Charts:- Daily , Weekly | |
| Add MSEX to Watchlist: View: Get Complete MSEX Trend Analysis ➞ | |
 | OTTR Otter Tail Corporation |
| Sector: Utilities | |
| SubSector: Diversified Utilities | |
| MarketCap: 1728.2 Millions | |
| Recent Price: 84.28 Smart Investing & Trading Score: 49 | |
| Day Percent Change: 0.04% Day Change: 0.03 | |
| Week Change: 0.04% Year-to-date Change: -0.8% | |
| OTTR Links: Profile News Message Board | |
| Charts:- Daily , Weekly | |
| Add OTTR to Watchlist: View: Get Complete OTTR Trend Analysis ➞ | |
 | HQI HireQuest, Inc. |
| Sector: Services & Goods | |
| SubSector: Staffing & Outsourcing Services | |
| MarketCap: 77 Millions | |
| Recent Price: 12.20 Smart Investing & Trading Score: 35 | |
| Day Percent Change: 0.04% Day Change: 0.00 | |
| Week Change: 0.04% Year-to-date Change: -20.5% | |
| HQI Links: Profile News Message Board | |
| Charts:- Daily , Weekly | |
| Add HQI to Watchlist: View: Get Complete HQI Trend Analysis ➞ | |
 | FLNG Flex LNG Ltd. |
| Sector: Energy | |
| SubSector: Oil & Gas Equipment & Services | |
| MarketCap: 220.261 Millions | |
| Recent Price: 25.80 Smart Investing & Trading Score: 67 | |
| Day Percent Change: 0.04% Day Change: 0.01 | |
| Week Change: 0.04% Year-to-date Change: -11.2% | |
| FLNG Links: Profile News Message Board | |
| Charts:- Daily , Weekly | |
| Add FLNG to Watchlist: View: Get Complete FLNG Trend Analysis ➞ | |
 | ITGR Integer Holdings Corporation |
| Sector: Health Care | |
| SubSector: Medical Appliances & Equipment | |
| MarketCap: 1794.8 Millions | |
| Recent Price: 116.65 Smart Investing & Trading Score: 51 | |
| Day Percent Change: 0.03% Day Change: 0.03 | |
| Week Change: 0.03% Year-to-date Change: 17.7% | |
| ITGR Links: Profile News Message Board | |
| Charts:- Daily , Weekly | |
| Add ITGR to Watchlist: View: Get Complete ITGR Trend Analysis ➞ | |
 | EVBG Everbridge, Inc. |
| Sector: Technology | |
| SubSector: Application Software | |
| MarketCap: 3697.92 Millions | |
| Recent Price: 34.89 Smart Investing & Trading Score: 68 | |
| Day Percent Change: 0.03% Day Change: 0.01 | |
| Week Change: 0.03% Year-to-date Change: 43.5% | |
| EVBG Links: Profile News Message Board | |
| Charts:- Daily , Weekly | |
| Add EVBG to Watchlist: View: Get Complete EVBG Trend Analysis ➞ | |
 | BOH Bank of Hawaii Corporation |
| Sector: Financials | |
| SubSector: Regional - Pacific Banks | |
| MarketCap: 2305.19 Millions | |
| Recent Price: 58.41 Smart Investing & Trading Score: 35 | |
| Day Percent Change: 0.02% Day Change: 0.01 | |
| Week Change: 0.02% Year-to-date Change: -19.4% | |
| BOH Links: Profile News Message Board | |
| Charts:- Daily , Weekly | |
| Add BOH to Watchlist: View: Get Complete BOH Trend Analysis ➞ | |
 | TARO Taro Pharmaceutical Industries Ltd. |
| Sector: Health Care | |
| SubSector: Drug Manufacturers - Other | |
| MarketCap: 2379.33 Millions | |
| Recent Price: 42.26 Smart Investing & Trading Score: 42 | |
| Day Percent Change: 0.02% Day Change: 0.01 | |
| Week Change: 0.02% Year-to-date Change: 1.2% | |
| TARO Links: Profile News Message Board | |
| Charts:- Daily , Weekly | |
| Add TARO to Watchlist: View: Get Complete TARO Trend Analysis ➞ | |
 | VTS Vitesse Energy, Inc. |
| Sector: Energy | |
| SubSector: Oil & Gas E&P | |
| MarketCap: 639 Millions | |
| Recent Price: 23.00 Smart Investing & Trading Score: 51 | |
| Day Percent Change: 0.00% Day Change: 0.00 | |
| Week Change: 0% Year-to-date Change: 3.9% | |
| VTS Links: Profile News Message Board | |
| Charts:- Daily , Weekly | |
| Add VTS to Watchlist: View: Get Complete VTS Trend Analysis ➞ | |
 | TTI TETRA Technologies, Inc. |
| Sector: Energy | |
| SubSector: Oil & Gas Equipment & Services | |
| MarketCap: 56.9461 Millions | |
| Recent Price: 4.42 Smart Investing & Trading Score: 68 | |
| Day Percent Change: 0.00% Day Change: 0.00 | |
| Week Change: 0% Year-to-date Change: -2.2% | |
| TTI Links: Profile News Message Board | |
| Charts:- Daily , Weekly | |
| Add TTI to Watchlist: View: Get Complete TTI Trend Analysis ➞ | |
 | SMRT SmartRent, Inc. |
| Sector: Technology | |
| SubSector: Software - Application | |
| MarketCap: 733 Millions | |
| Recent Price: 2.29 Smart Investing & Trading Score: 10 | |
| Day Percent Change: 0.00% Day Change: 0.00 | |
| Week Change: 0% Year-to-date Change: -28.2% | |
| SMRT Links: Profile News Message Board | |
| Charts:- Daily , Weekly | |
| Add SMRT to Watchlist: View: Get Complete SMRT Trend Analysis ➞ | |
 | HAFC Hanmi Financial Corporation |
| Sector: Financials | |
| SubSector: Regional - Pacific Banks | |
| MarketCap: 319.929 Millions | |
| Recent Price: 15.21 Smart Investing & Trading Score: 67 | |
| Day Percent Change: 0.00% Day Change: 0.00 | |
| Week Change: 0% Year-to-date Change: -21.6% | |
| HAFC Links: Profile News Message Board | |
| Charts:- Daily , Weekly | |
| Add HAFC to Watchlist: View: Get Complete HAFC Trend Analysis ➞ | |
 | RGR Sturm, Ruger & Company, Inc. |
| Sector: Industrials | |
| SubSector: Aerospace/Defense Products & Services | |
| MarketCap: 752 Millions | |
| Recent Price: 46.75 Smart Investing & Trading Score: 88 | |
| Day Percent Change: 0.00% Day Change: 0.00 | |
| Week Change: 0% Year-to-date Change: 2.9% | |
| RGR Links: Profile News Message Board | |
| Charts:- Daily , Weekly | |
| Add RGR to Watchlist: View: Get Complete RGR Trend Analysis ➞ | |
 | DMRC Digimarc Corporation |
| Sector: Technology | |
| SubSector: Information Technology Services | |
| MarketCap: 222.268 Millions | |
| Recent Price: 22.59 Smart Investing & Trading Score: 28 | |
| Day Percent Change: 0.00% Day Change: 0.00 | |
| Week Change: 0% Year-to-date Change: -37.5% | |
| DMRC Links: Profile News Message Board | |
| Charts:- Daily , Weekly | |
| Add DMRC to Watchlist: View: Get Complete DMRC Trend Analysis ➞ | |
 | ANGO AngioDynamics, Inc. |
| Sector: Health Care | |
| SubSector: Medical Instruments & Supplies | |
| MarketCap: 370.86 Millions | |
| Recent Price: 6.26 Smart Investing & Trading Score: 48 | |
| Day Percent Change: 0.00% Day Change: 0.00 | |
| Week Change: 0% Year-to-date Change: -20.2% | |
| ANGO Links: Profile News Message Board | |
| Charts:- Daily , Weekly | |
| Add ANGO to Watchlist: View: Get Complete ANGO Trend Analysis ➞ | |
 | CDZI Cadiz Inc. |
| Sector: Utilities | |
| SubSector: Water Utilities | |
| MarketCap: 265.502 Millions | |
| Recent Price: 2.25 Smart Investing & Trading Score: 32 | |
| Day Percent Change: 0.00% Day Change: 0.00 | |
| Week Change: 0% Year-to-date Change: -19.6% | |
| CDZI Links: Profile News Message Board | |
| Charts:- Daily , Weekly | |
| Add CDZI to Watchlist: View: Get Complete CDZI Trend Analysis ➞ | |
 | FF FutureFuel Corp. |
| Sector: Materials | |
| SubSector: Chemicals - Major Diversified | |
| MarketCap: 450.736 Millions | |
| Recent Price: 5.63 Smart Investing & Trading Score: 10 | |
| Day Percent Change: 0.00% Day Change: 0.00 | |
| Week Change: 0% Year-to-date Change: -7.4% | |
| FF Links: Profile News Message Board | |
| Charts:- Daily , Weekly | |
| Add FF to Watchlist: View: Get Complete FF Trend Analysis ➞ | |
 | LXU LSB Industries, Inc. |
| Sector: Materials | |
| SubSector: Chemicals - Major Diversified | |
| MarketCap: 51.7736 Millions | |
| Recent Price: 8.05 Smart Investing & Trading Score: 61 | |
| Day Percent Change: 0.00% Day Change: 0.00 | |
| Week Change: 0% Year-to-date Change: -13.5% | |
| LXU Links: Profile News Message Board | |
| Charts:- Daily , Weekly | |
| Add LXU to Watchlist: View: Get Complete LXU Trend Analysis ➞ | |
 | CIM Chimera Investment Corporation |
| Sector: Financials | |
| SubSector: Mortgage Investment | |
| MarketCap: 2164.09 Millions | |
| Recent Price: 4.11 Smart Investing & Trading Score: 49 | |
| Day Percent Change: 0.00% Day Change: 0.00 | |
| Week Change: 0% Year-to-date Change: -17.6% | |
| CIM Links: Profile News Message Board | |
| Charts:- Daily , Weekly | |
| Add CIM to Watchlist: View: Get Complete CIM Trend Analysis ➞ | |
| Too many stocks? View smallcap stocks filtered by marketcap & sector |
| Marketcap: All SmallCap Stocks (default-no microcap), Large, Mid-Range, Small & MicroCap |
| Sector: Tech, Finance, Energy, Staples, Retail, Industrial, Materials, Utilities & Medical |
|
Best Stocks Today 12Stocks.com |
© 2024 12Stocks.com Terms & Conditions Privacy Contact Us
All Information Provided Only For Education And Not To Be Used For Investing or Trading. See Terms & Conditions


One More Thing ... Get Best Stocks Delivered Daily!
Never Ever Miss A Move With Our Top Ten Stocks Lists
Find Best Stocks In Any Market - Bull or Bear Market
Take A Peek At Our Top Ten Stocks Lists: Daily, Weekly, Year-to-Date & Top Trends
Find Best Stocks In Any Market - Bull or Bear Market
Take A Peek At Our Top Ten Stocks Lists: Daily, Weekly, Year-to-Date & Top Trends
Smallcap Stocks With Best Up Trends [0-bearish to 100-bullish]: Matterport [100], Riot Blockchain[100], Ingevity [100], Vista Outdoor[100], Park National[100], Maiden [100], Amplify Energy[100], Excelerate Energy[100], Perella Weinberg[100], Zuora [100], Vertex Energy[100]
Best Smallcap Stocks Year-to-Date:
CareMax [561.86%], Janux [354.91%], Alpine Immune[239.18%], Viking [237.13%], Longboard [205.56%], Arcutis Bio[176.78%], Avidity Biosciences[167.26%], Vera [152.78%], Super Micro[152.24%], Hippo [125.58%], Y-mAbs [122.29%] Best Smallcap Stocks This Week:
Matterport [175.86%], ProKidney [33.33%], CareMax [24.9%], Riot Blockchain[23.11%], Cipher Mining[18.75%], OptiNose [15.07%], Assertio [13.48%], MicroStrategy [12.77%], Vuzix [11.57%], Seres [11.56%], Energy Vault[11.11%] Best Smallcap Stocks Daily:
Matterport [175.86%], ProKidney [33.33%], CareMax [24.90%], Riot Blockchain[23.11%], Cipher Mining[18.75%], OptiNose [15.07%], Assertio [13.48%], MicroStrategy [12.77%], Vuzix [11.57%], Seres [11.56%], Energy Vault[11.11%]